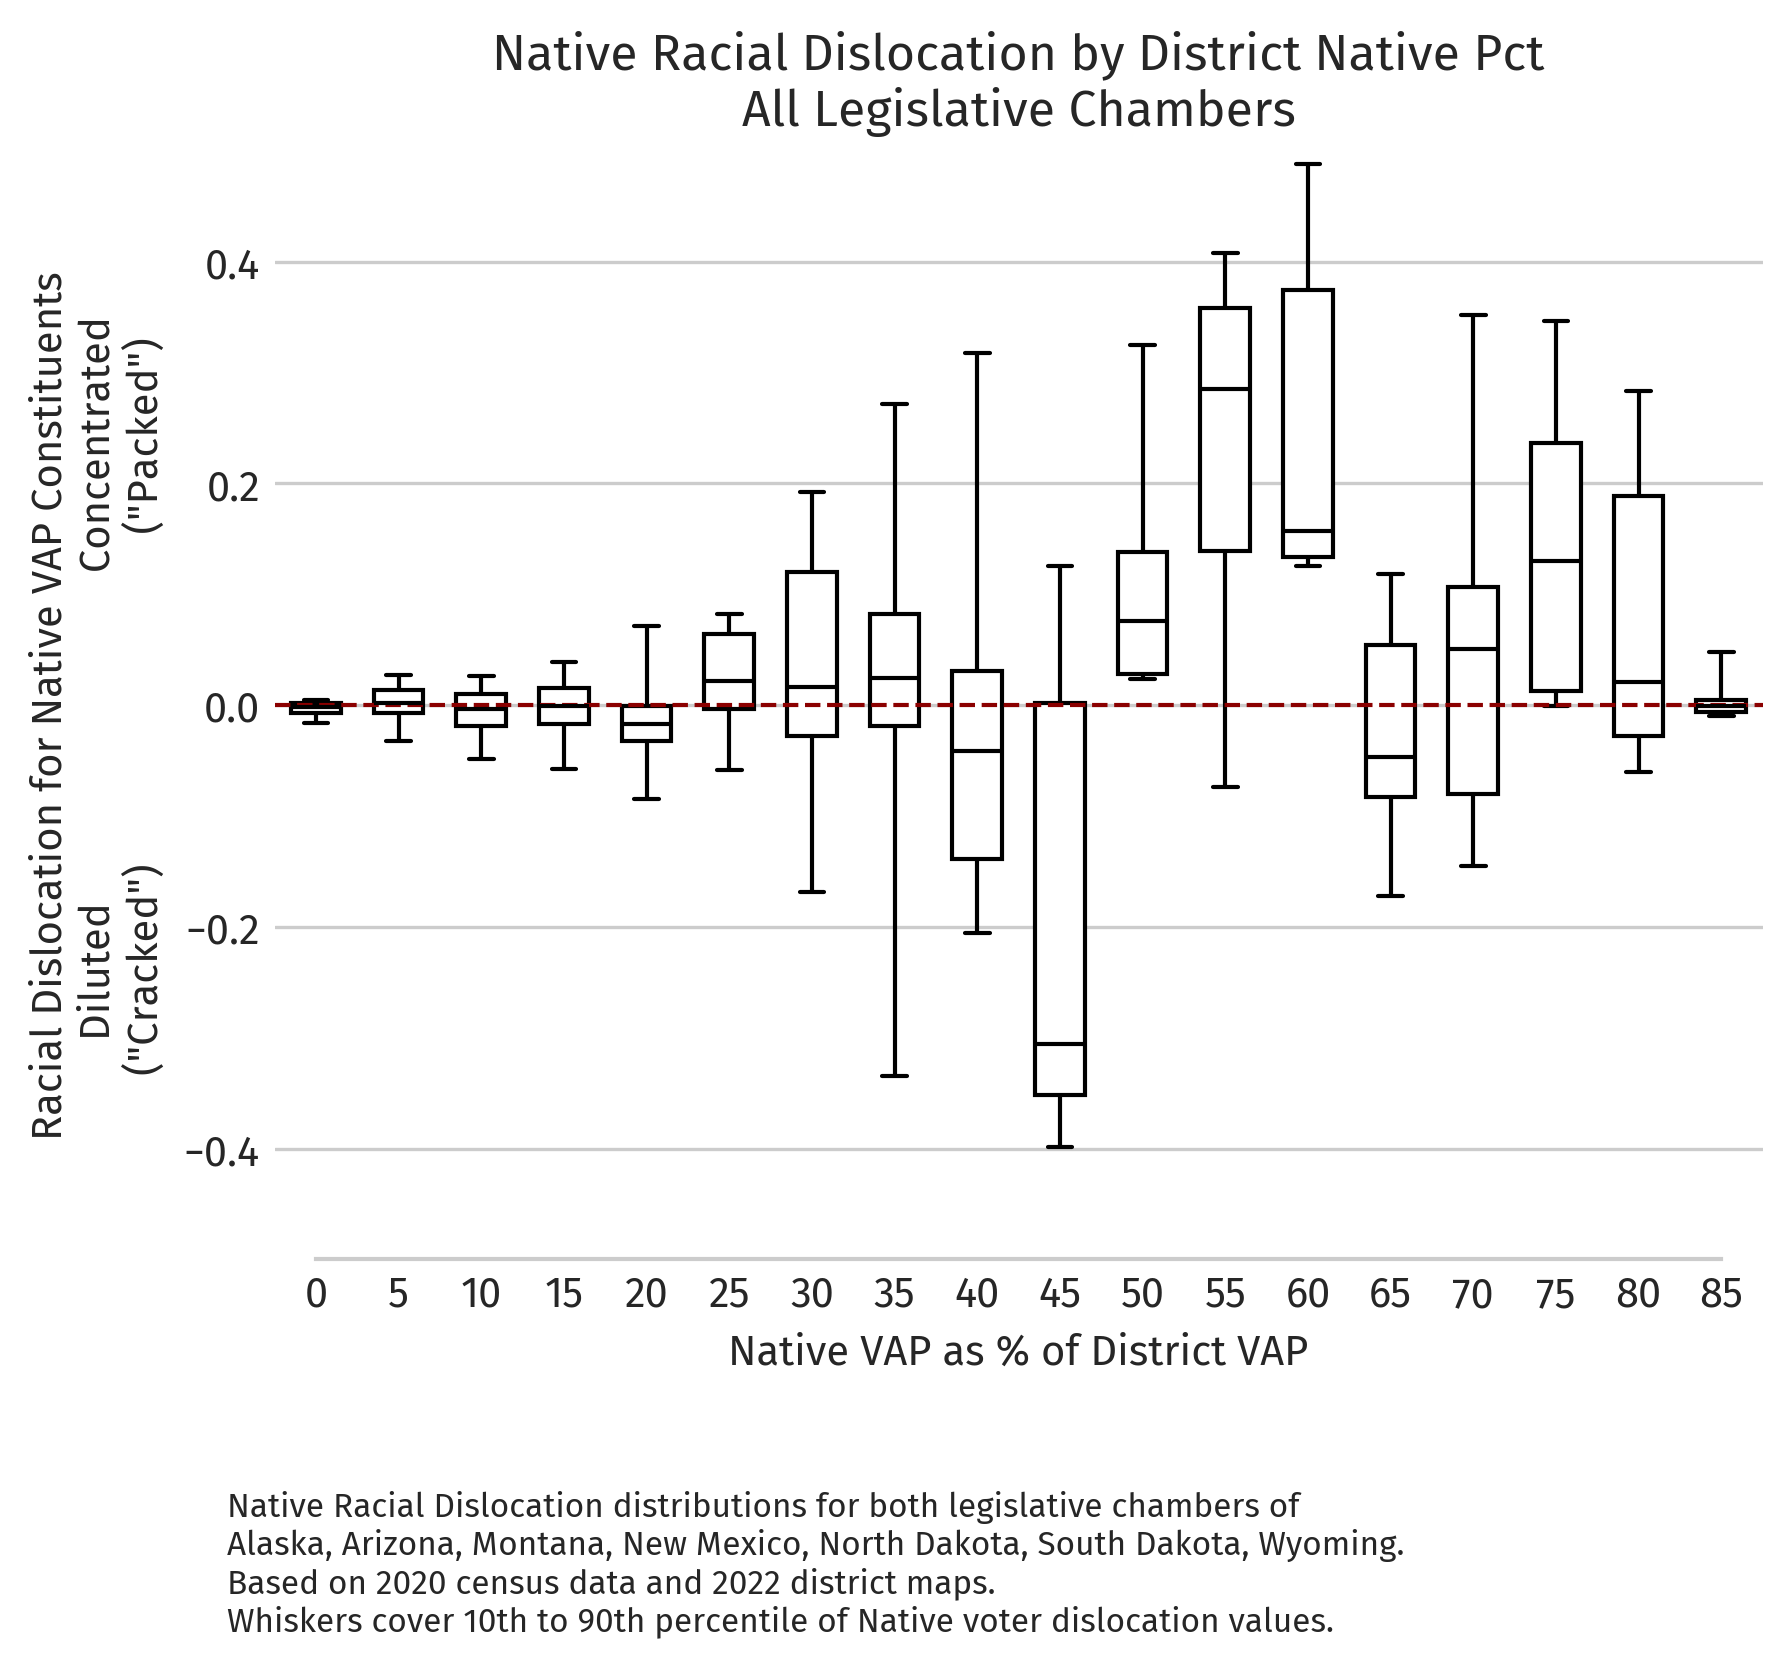
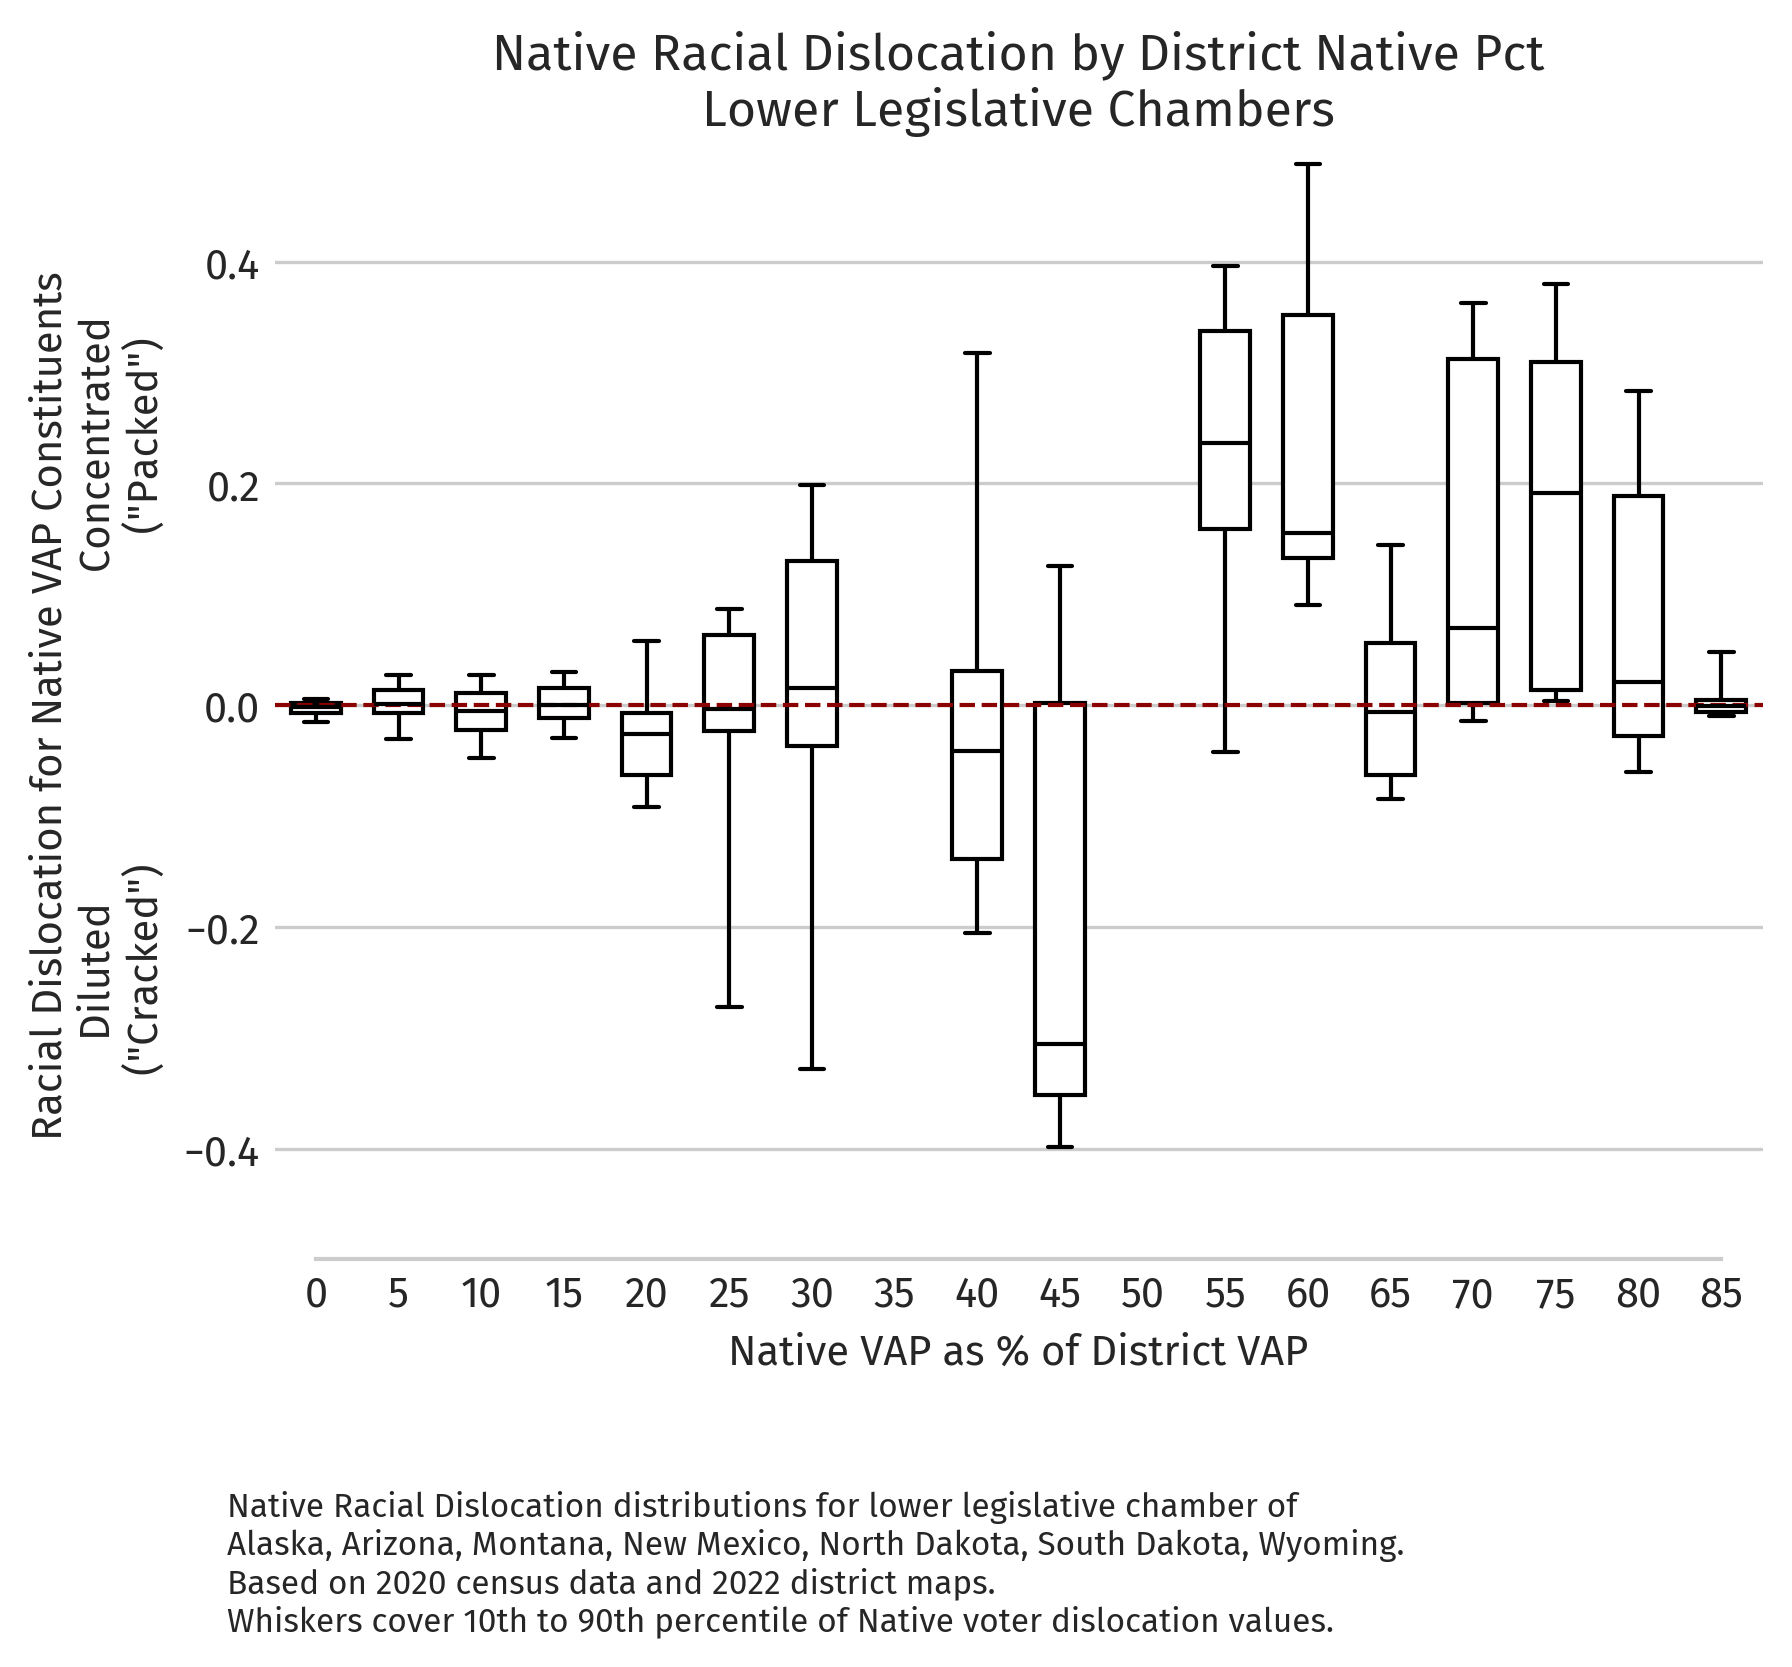
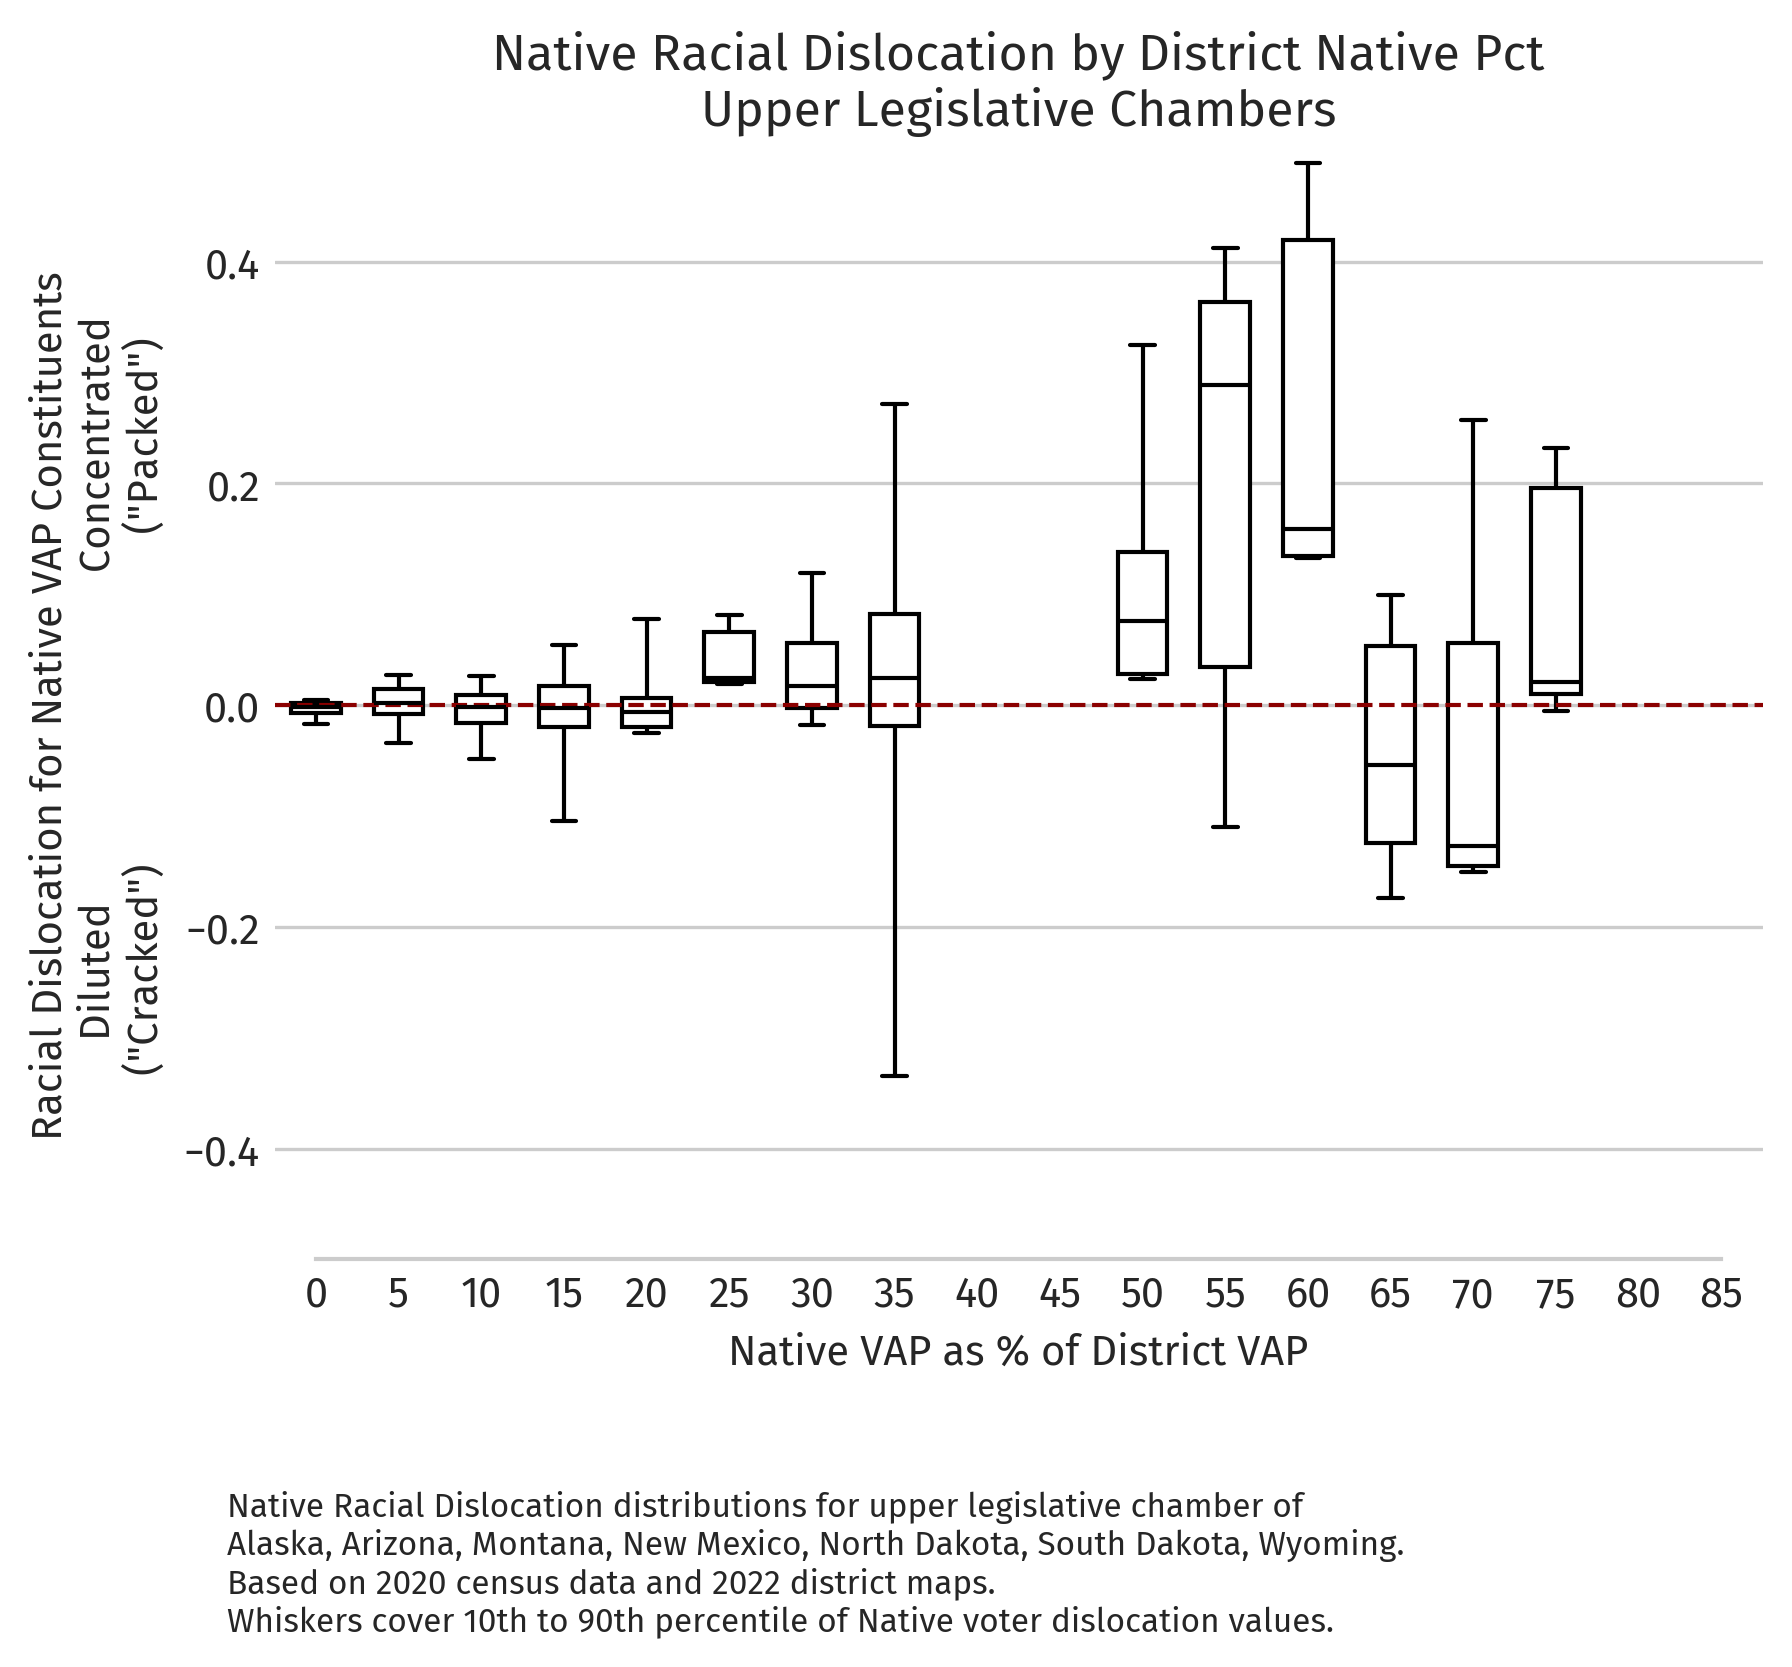
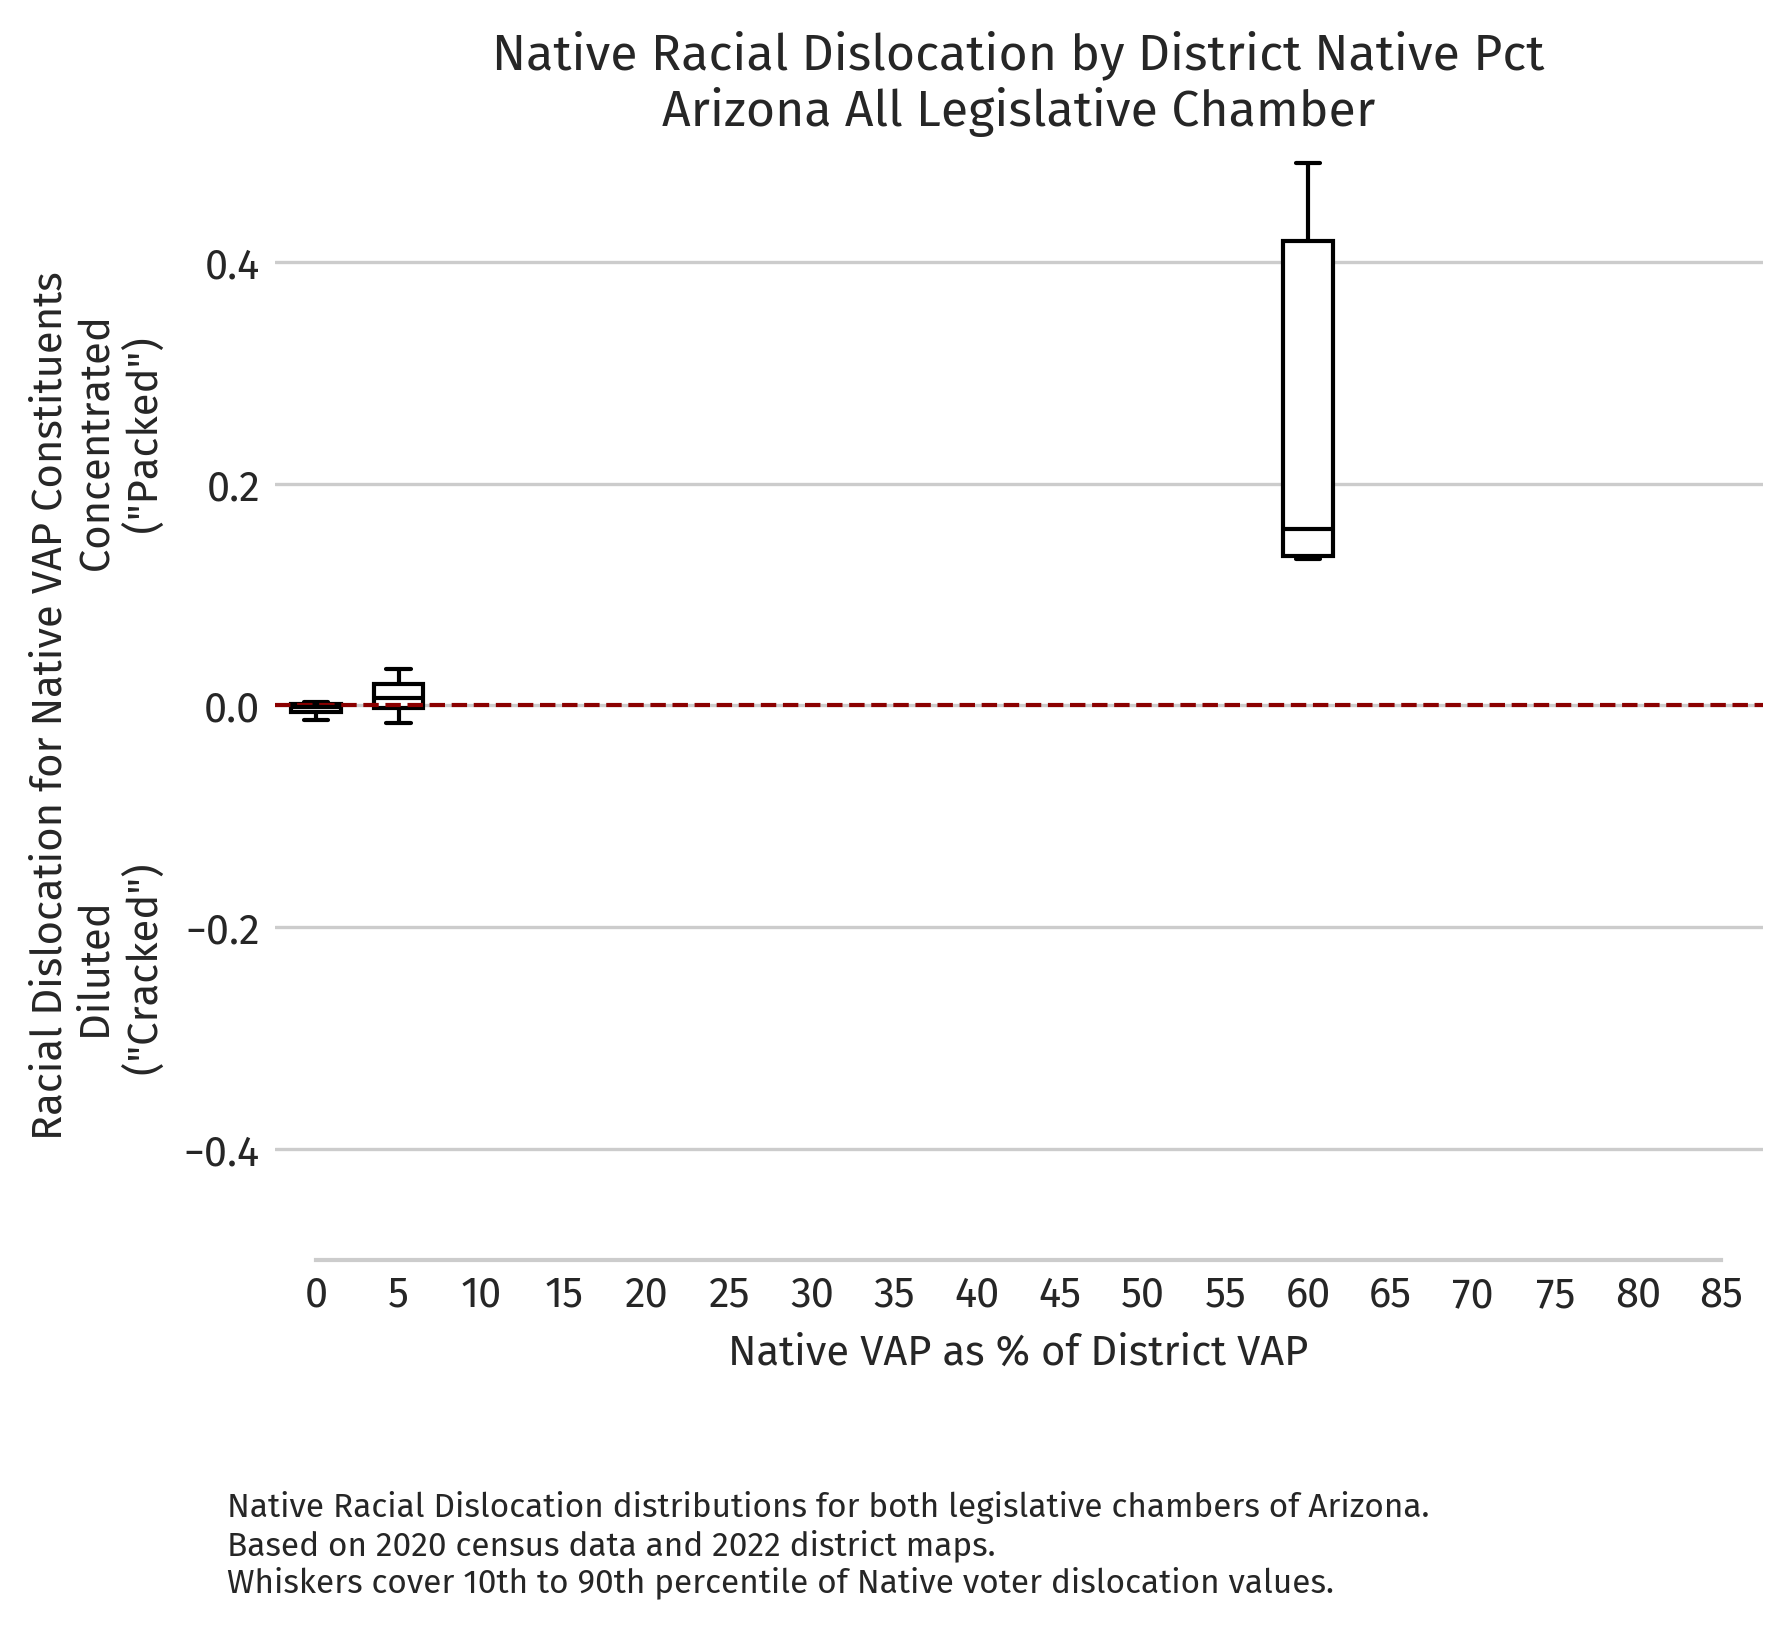
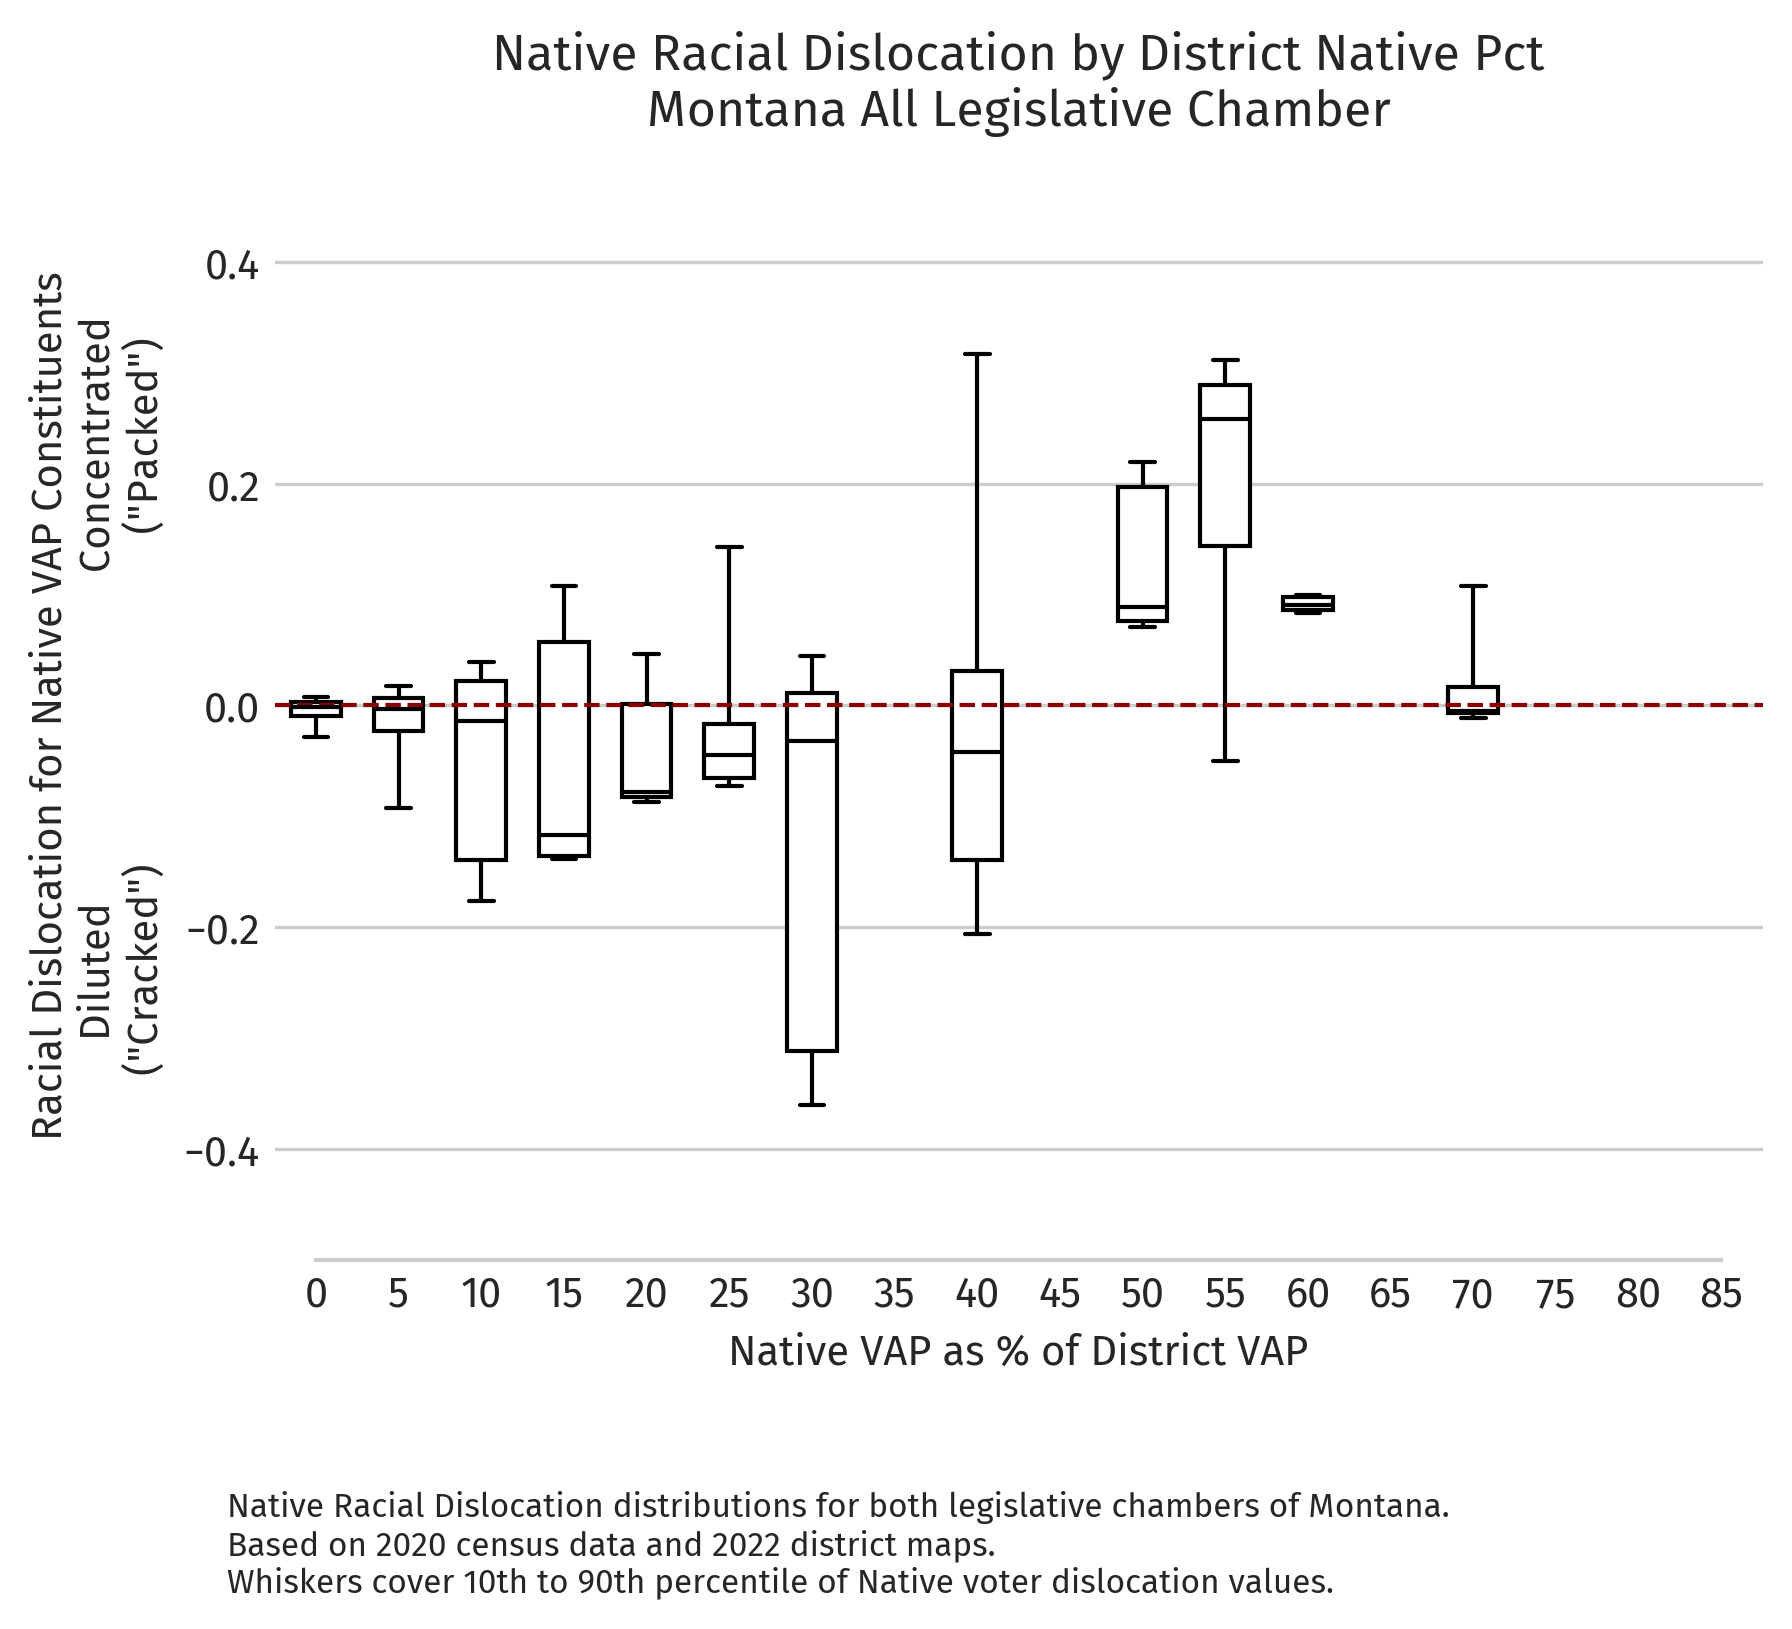
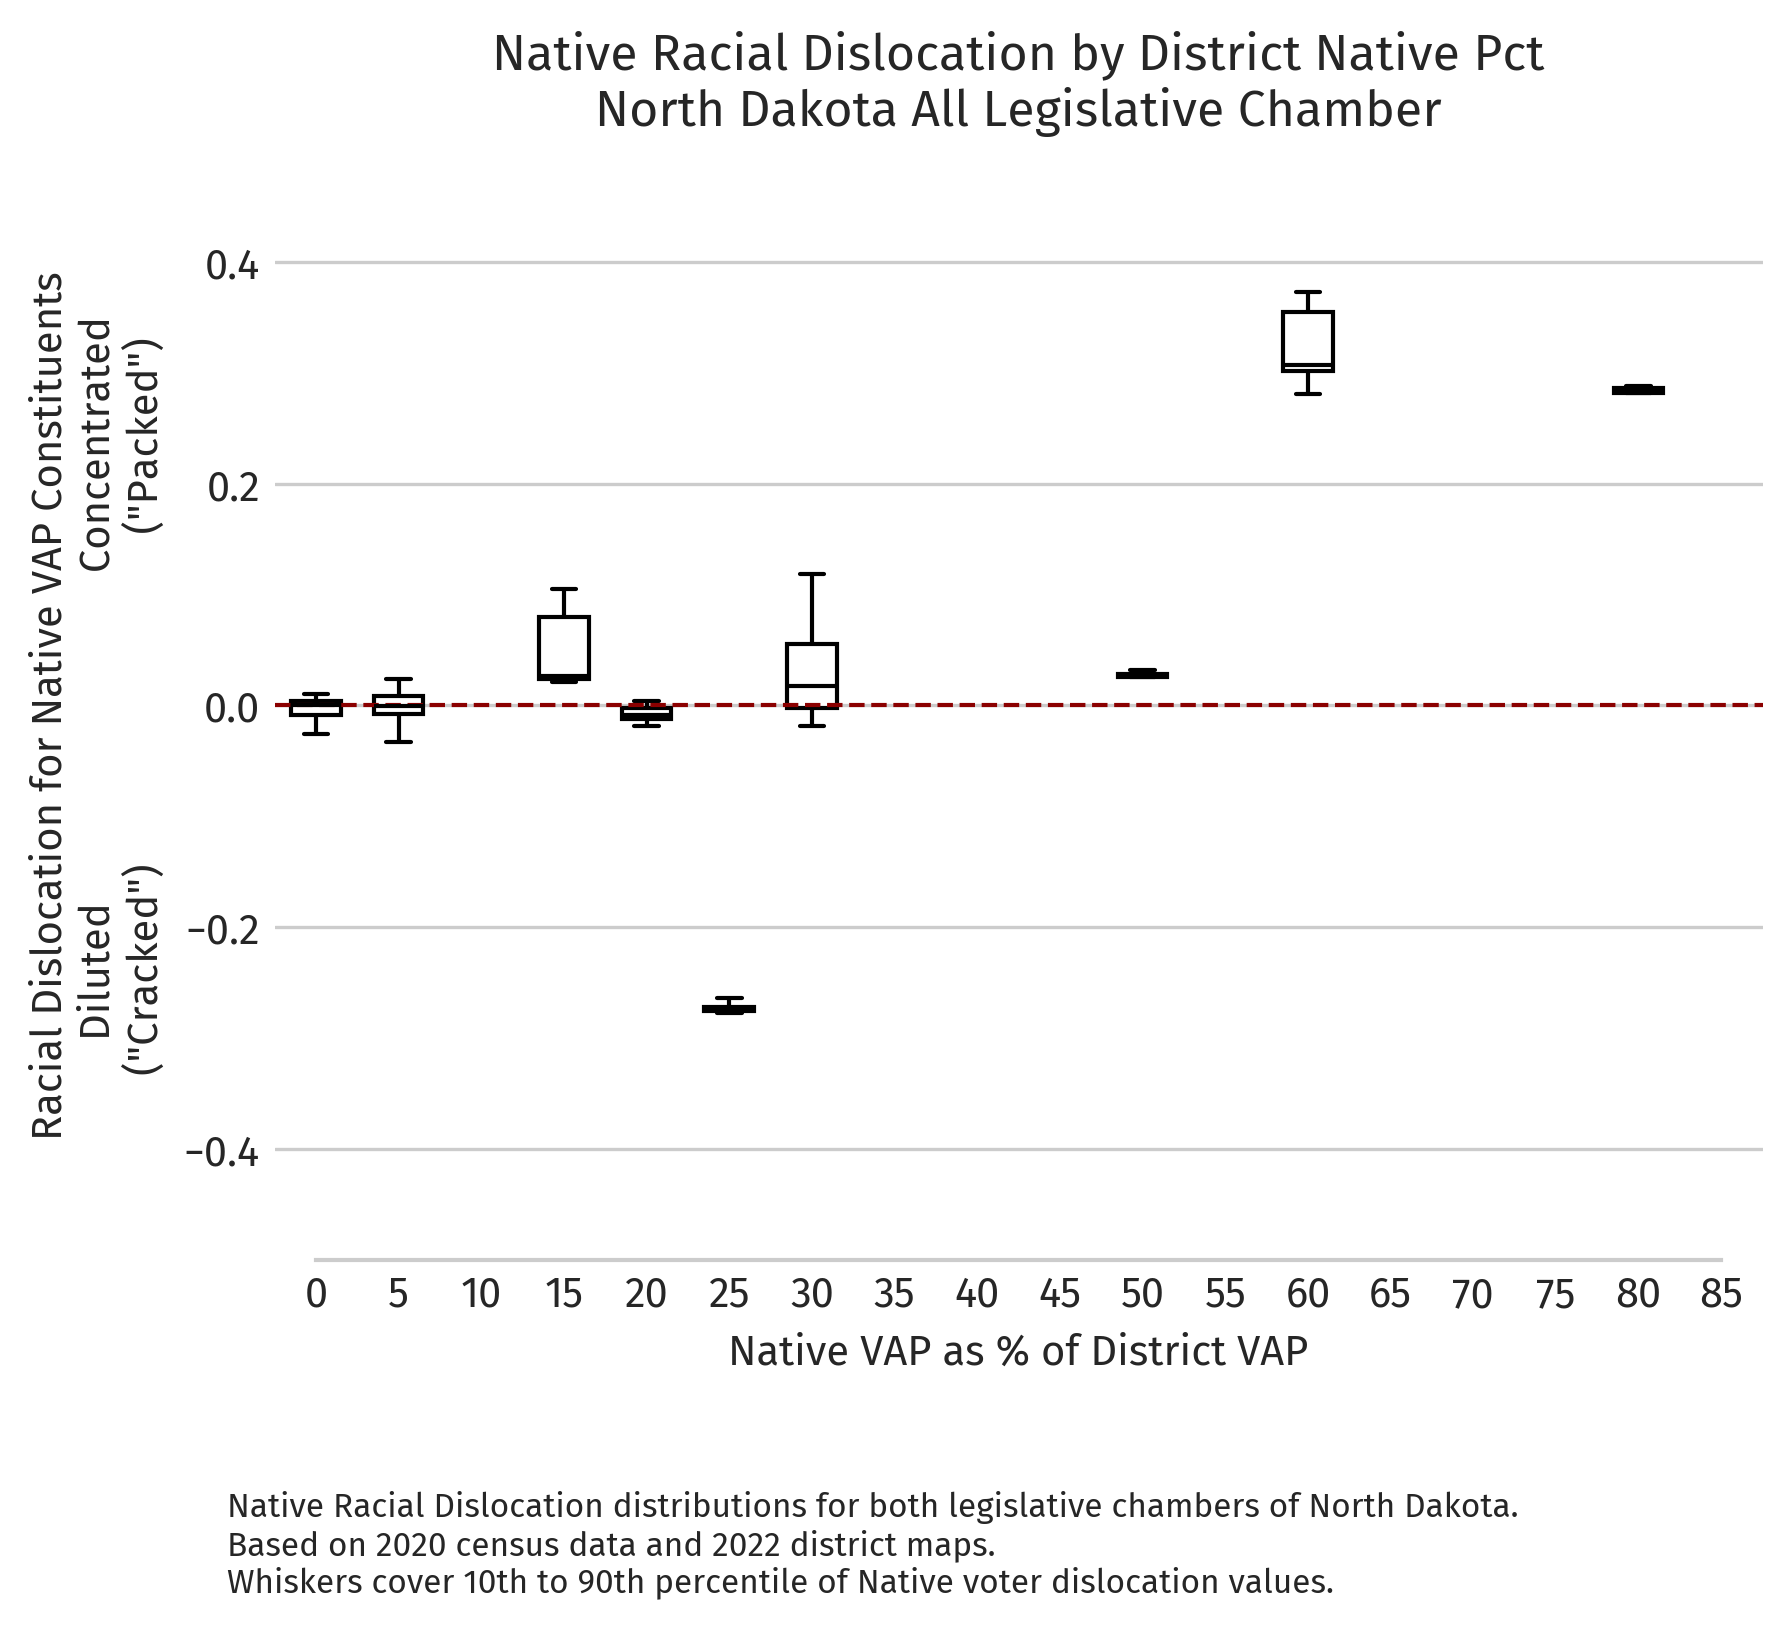
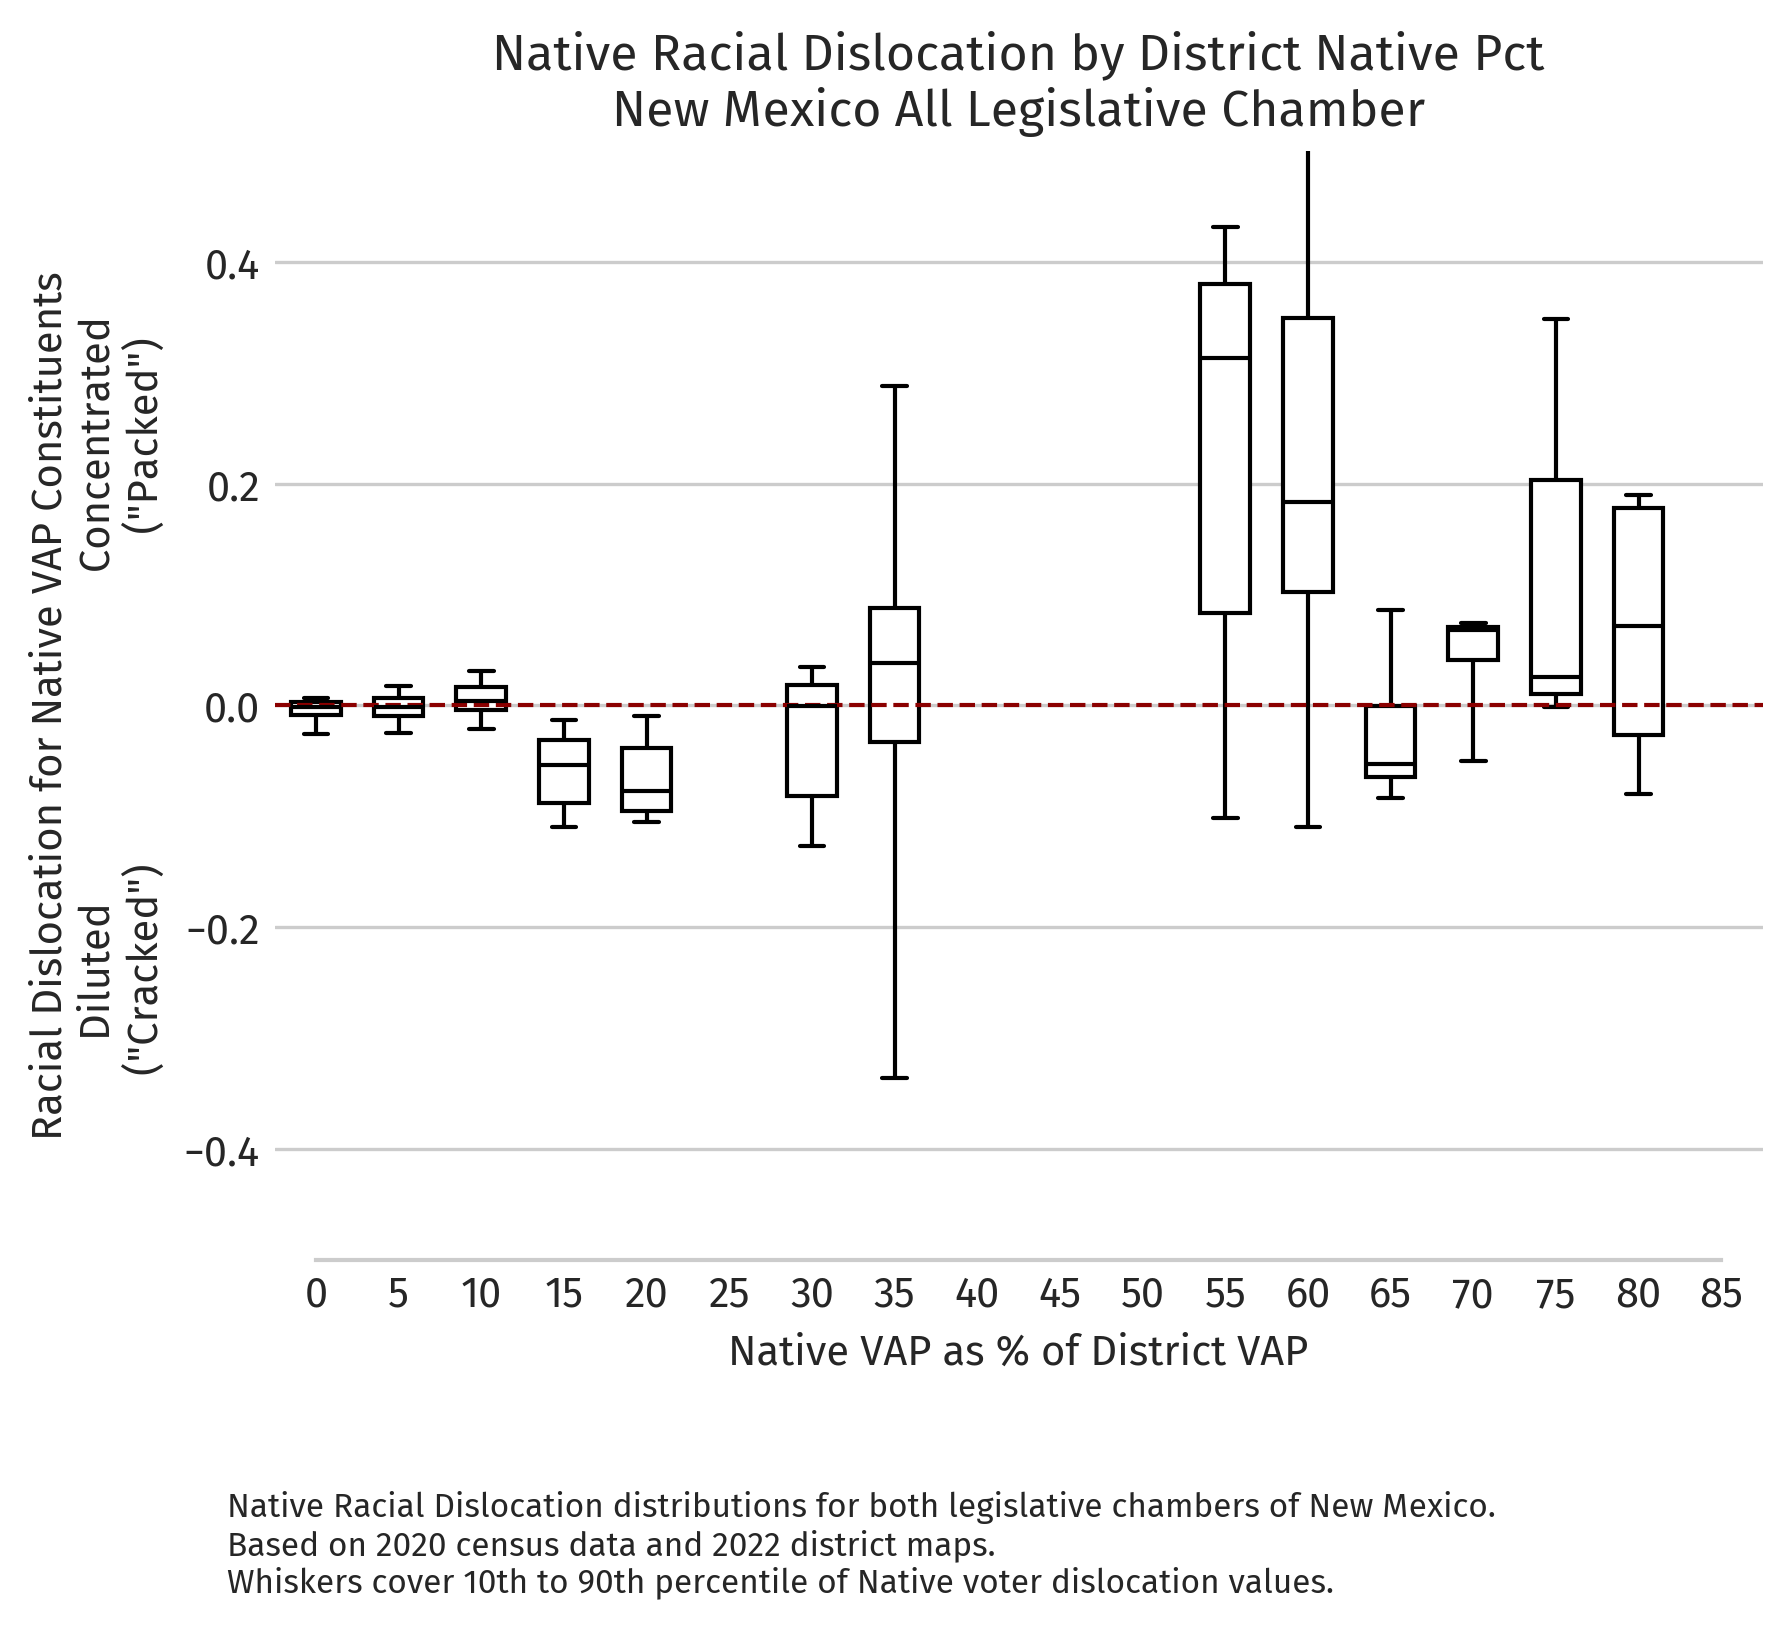
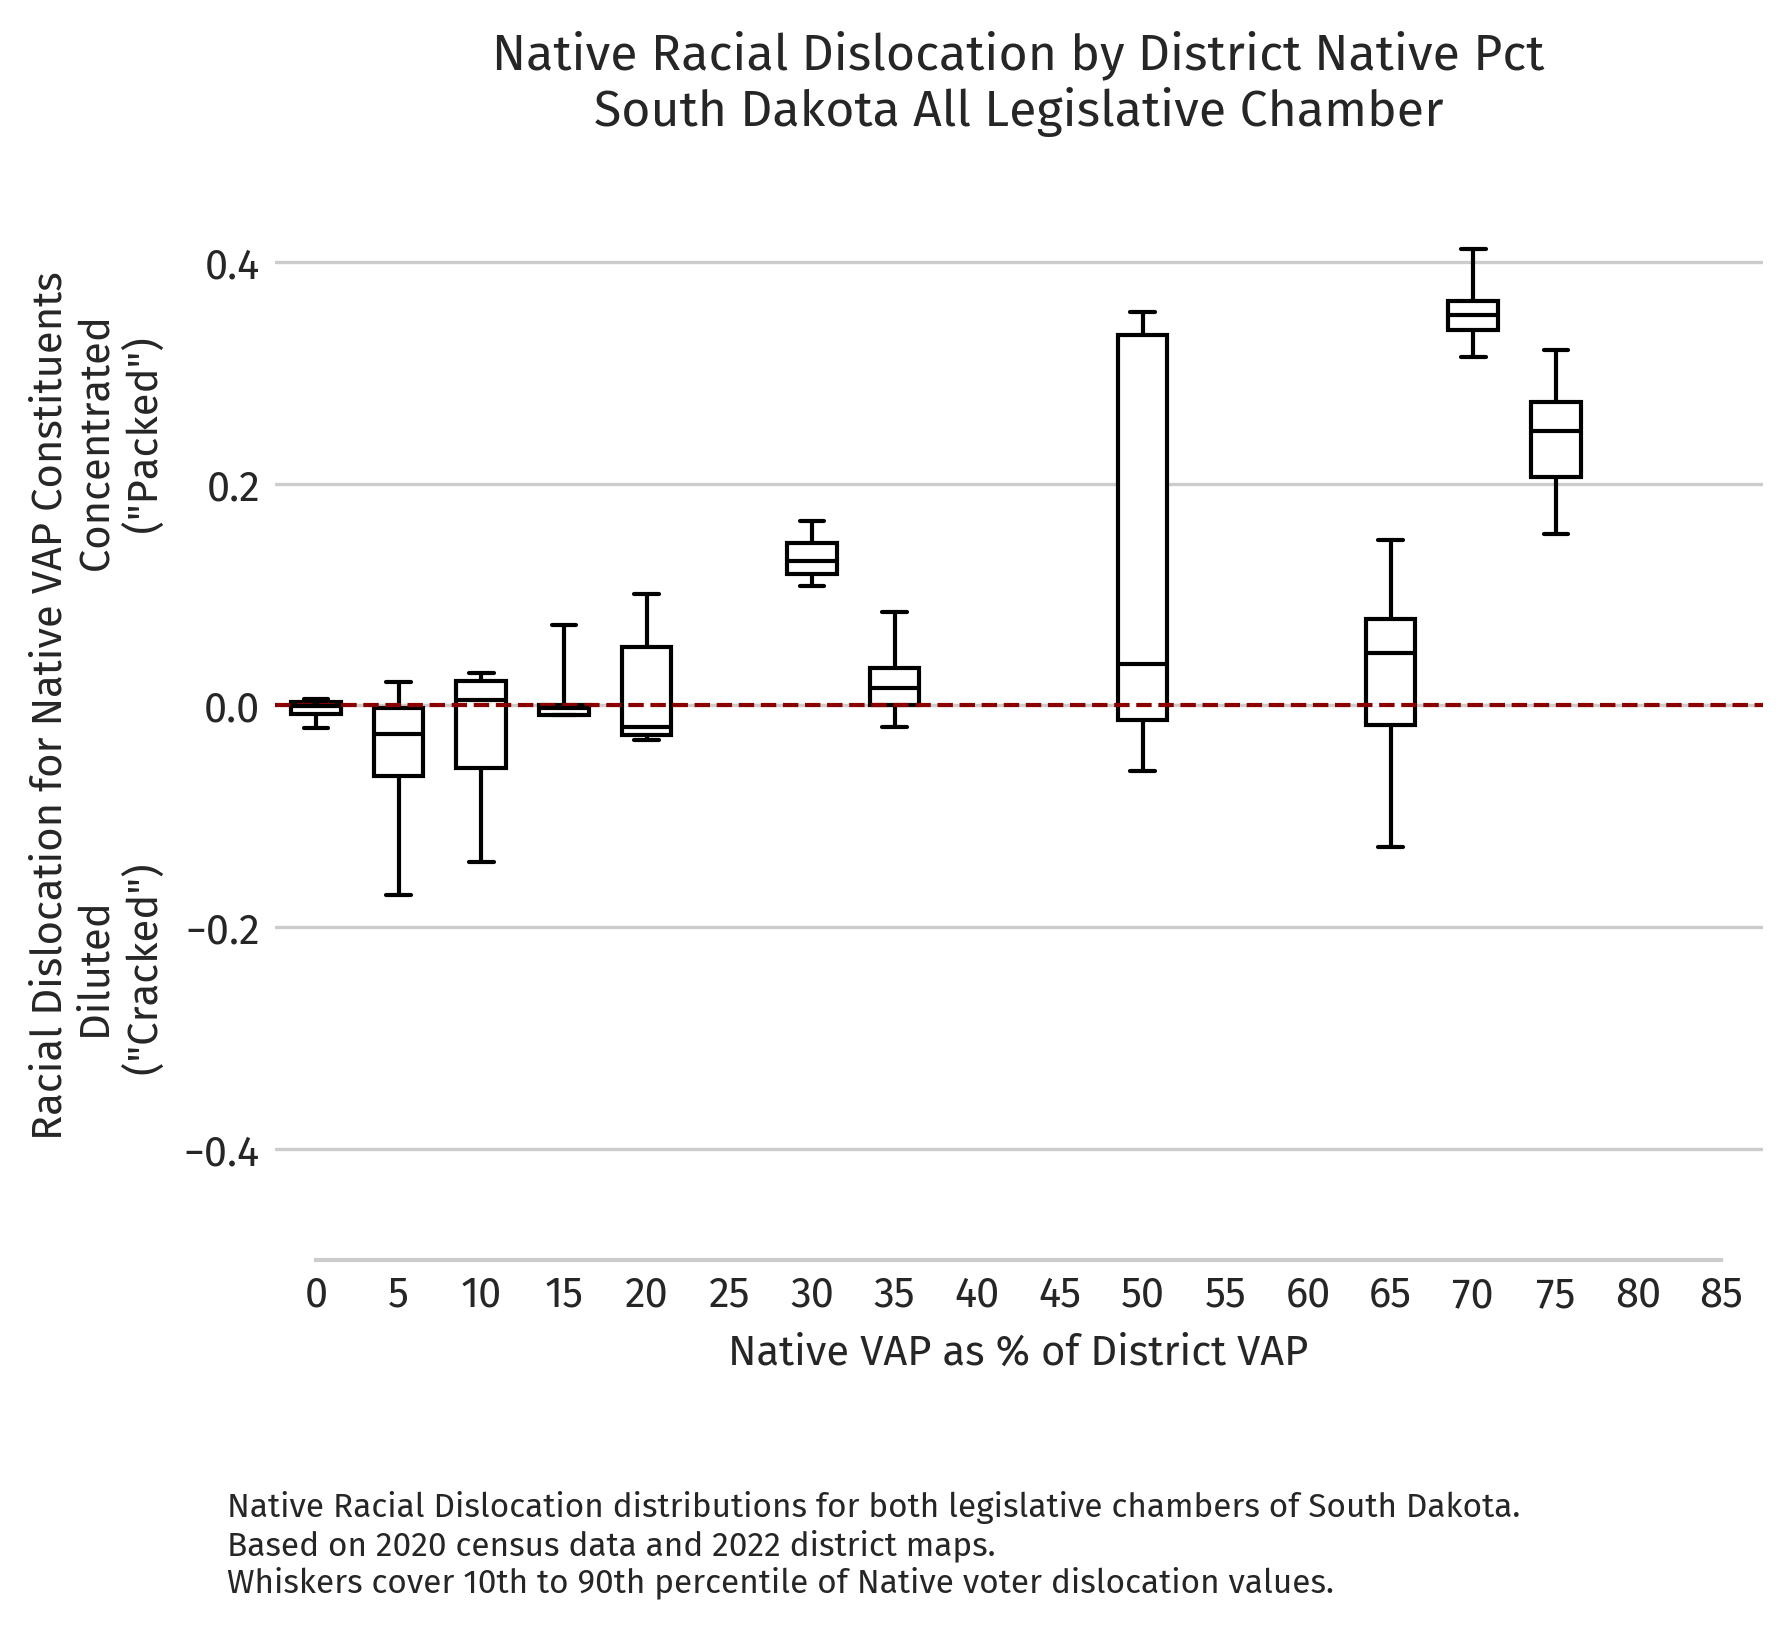
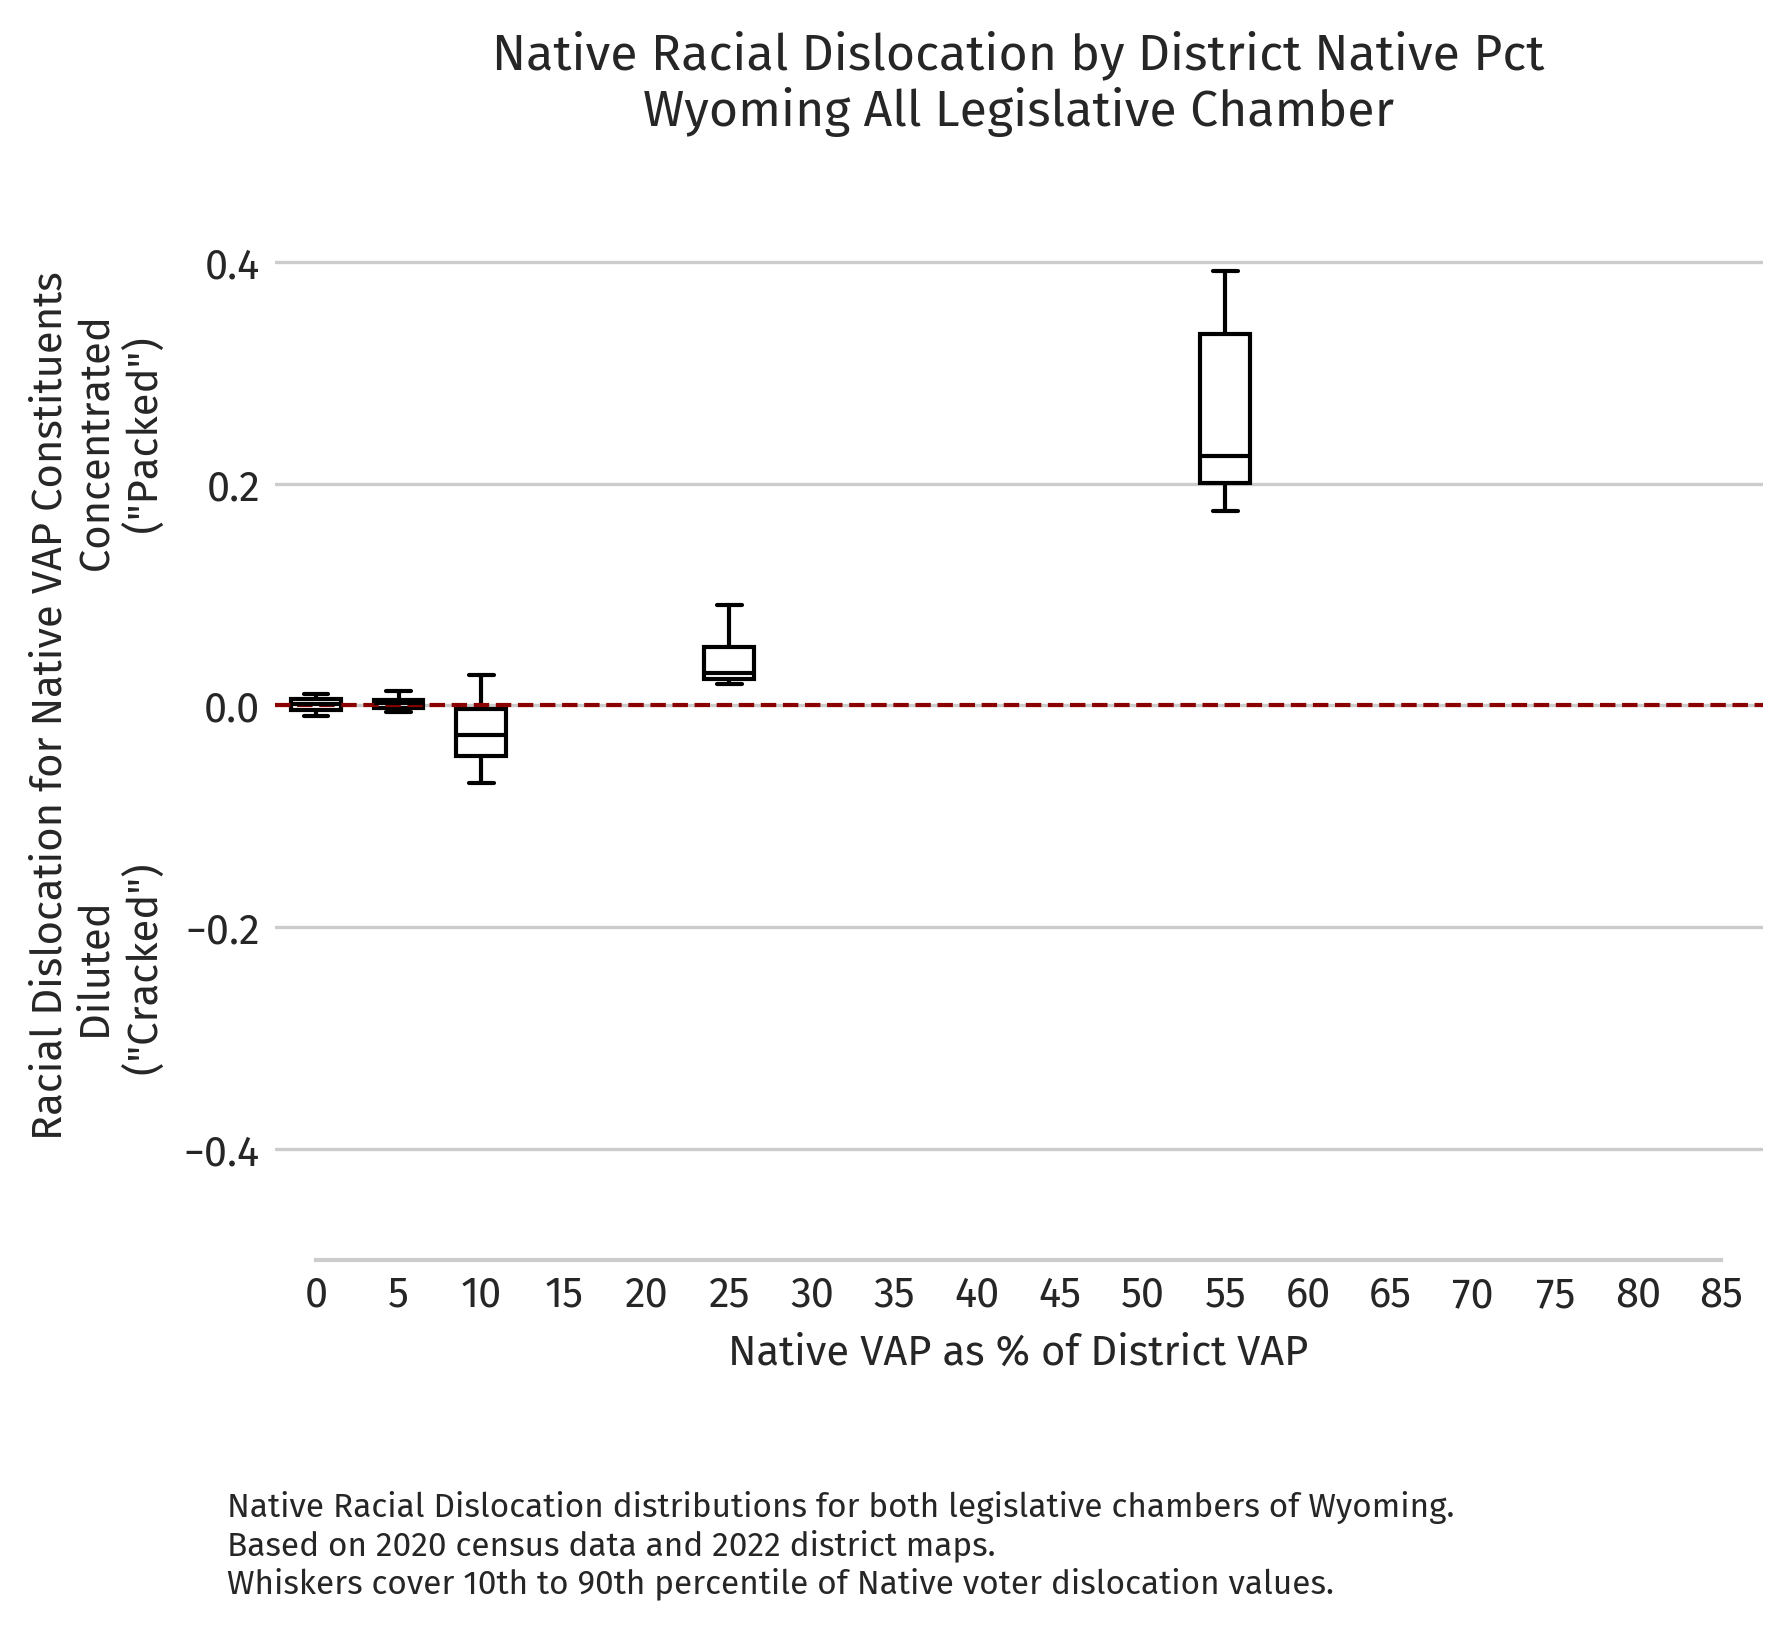
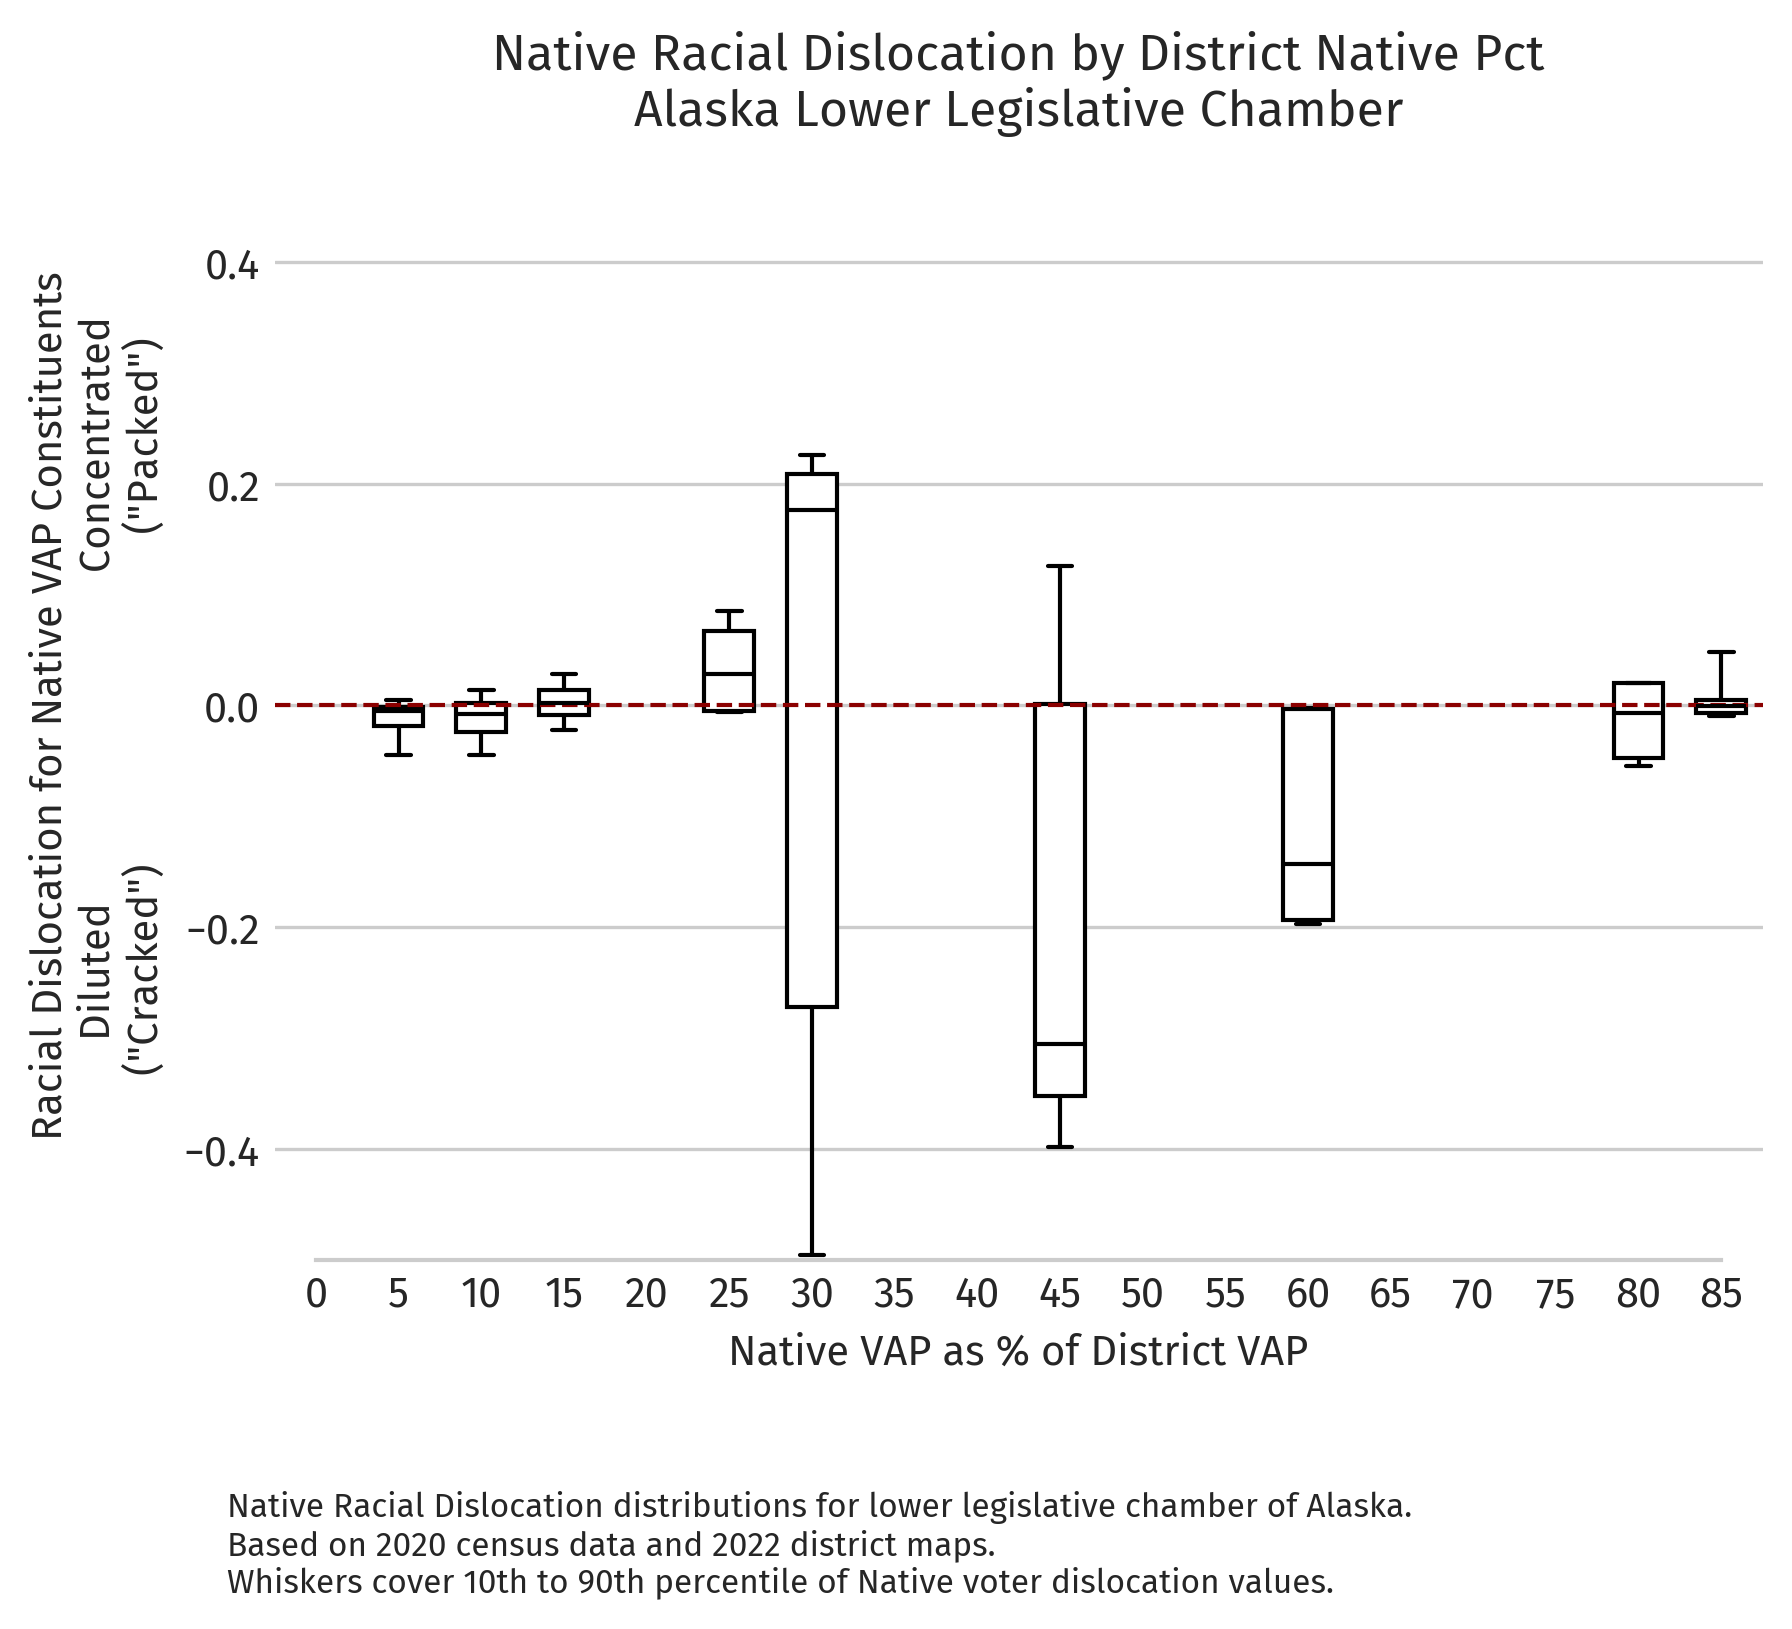
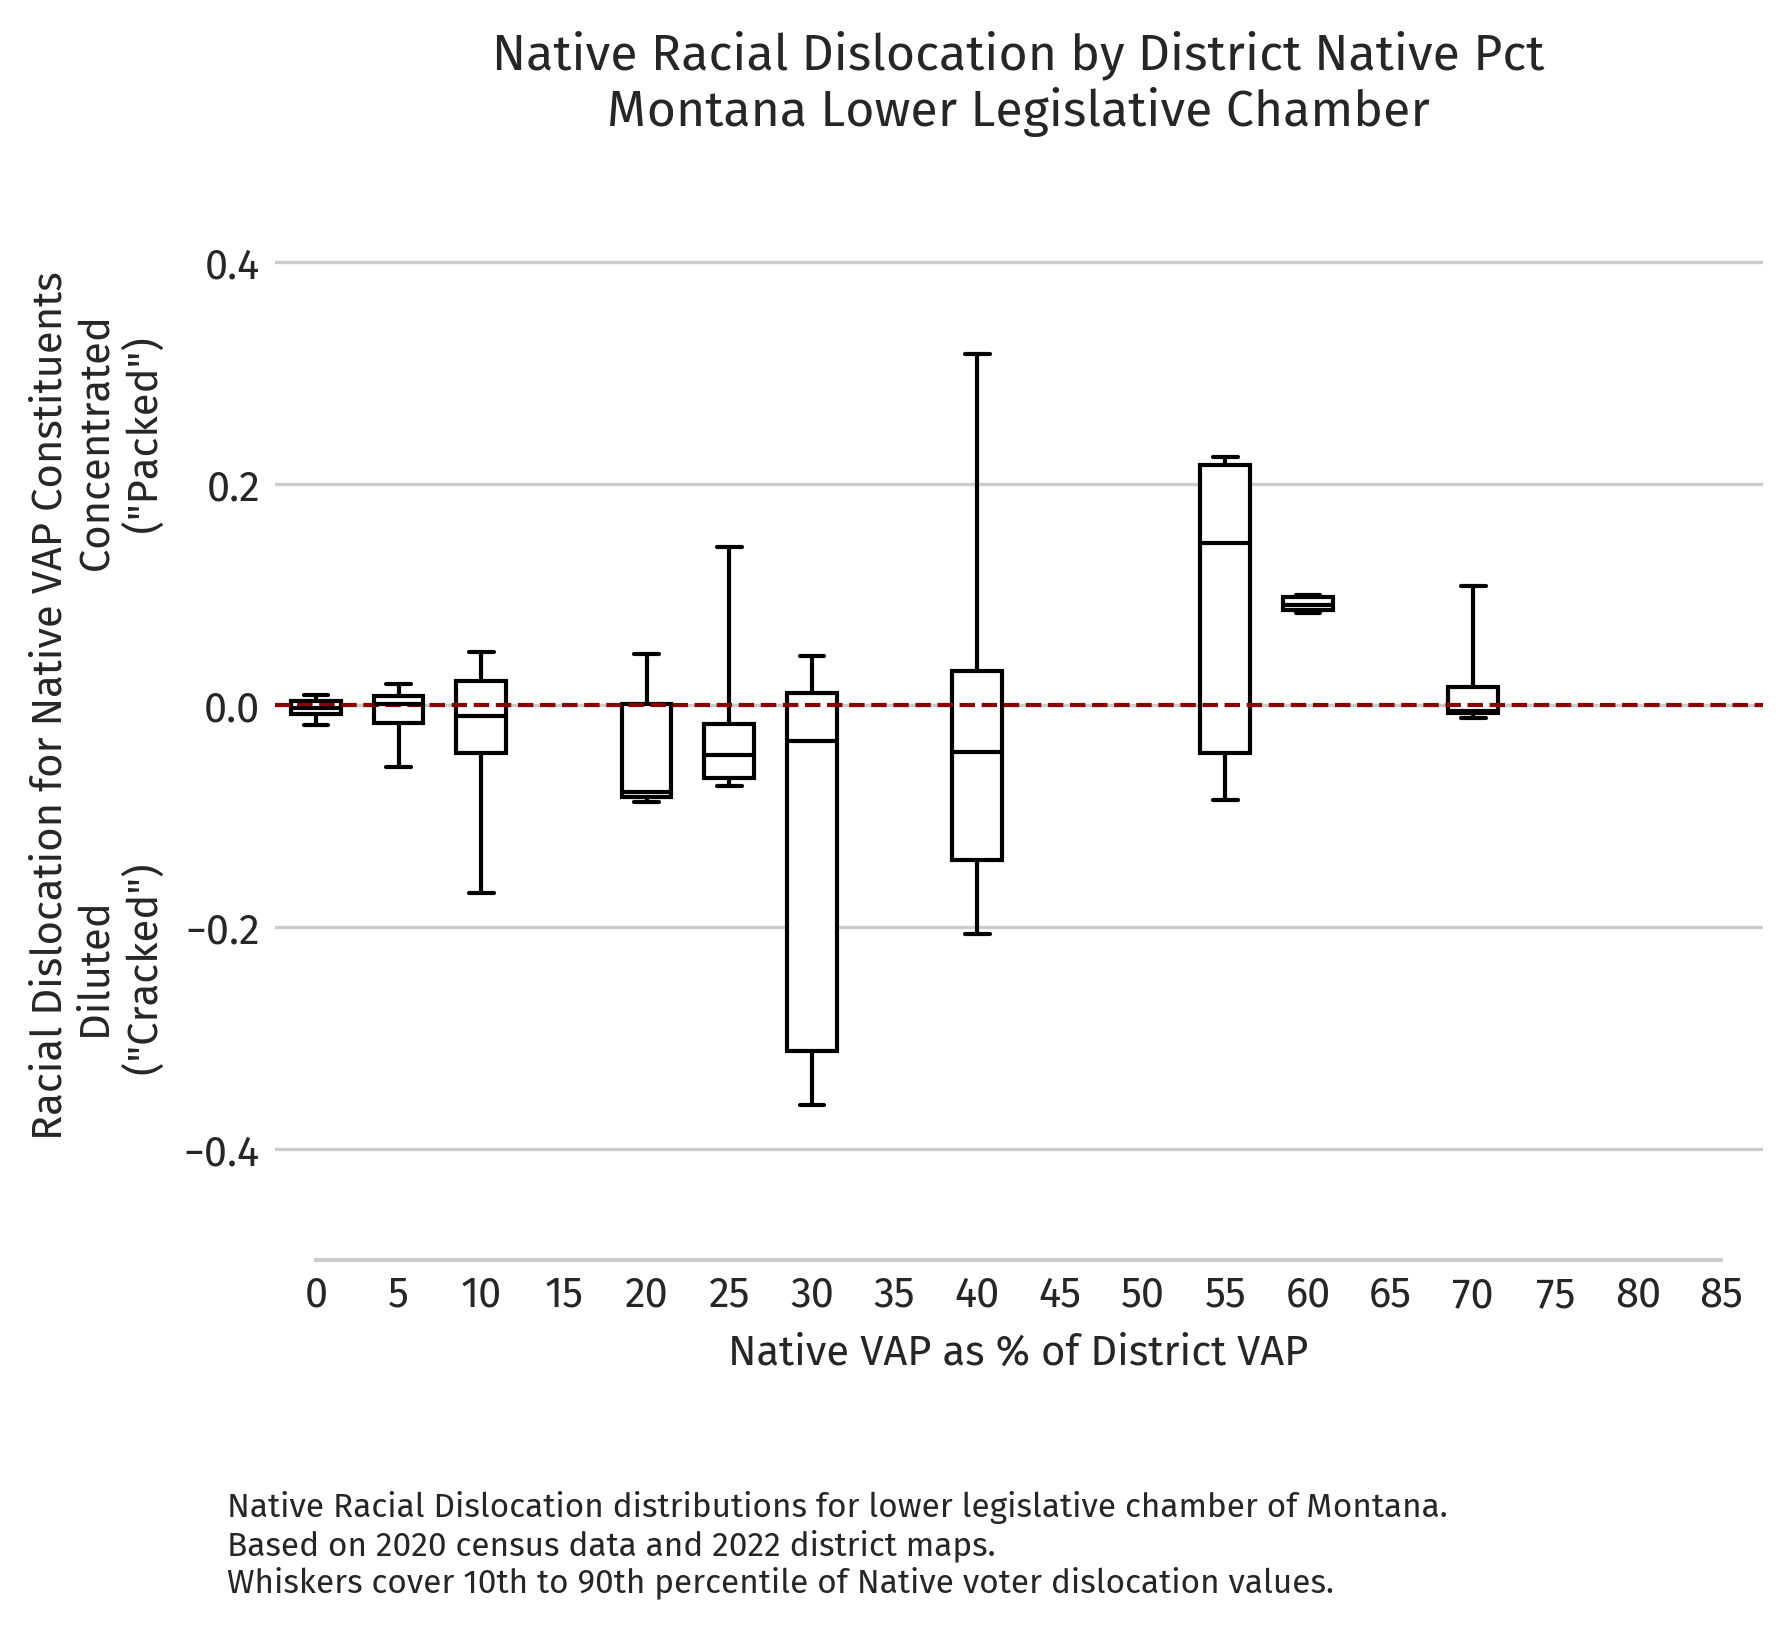
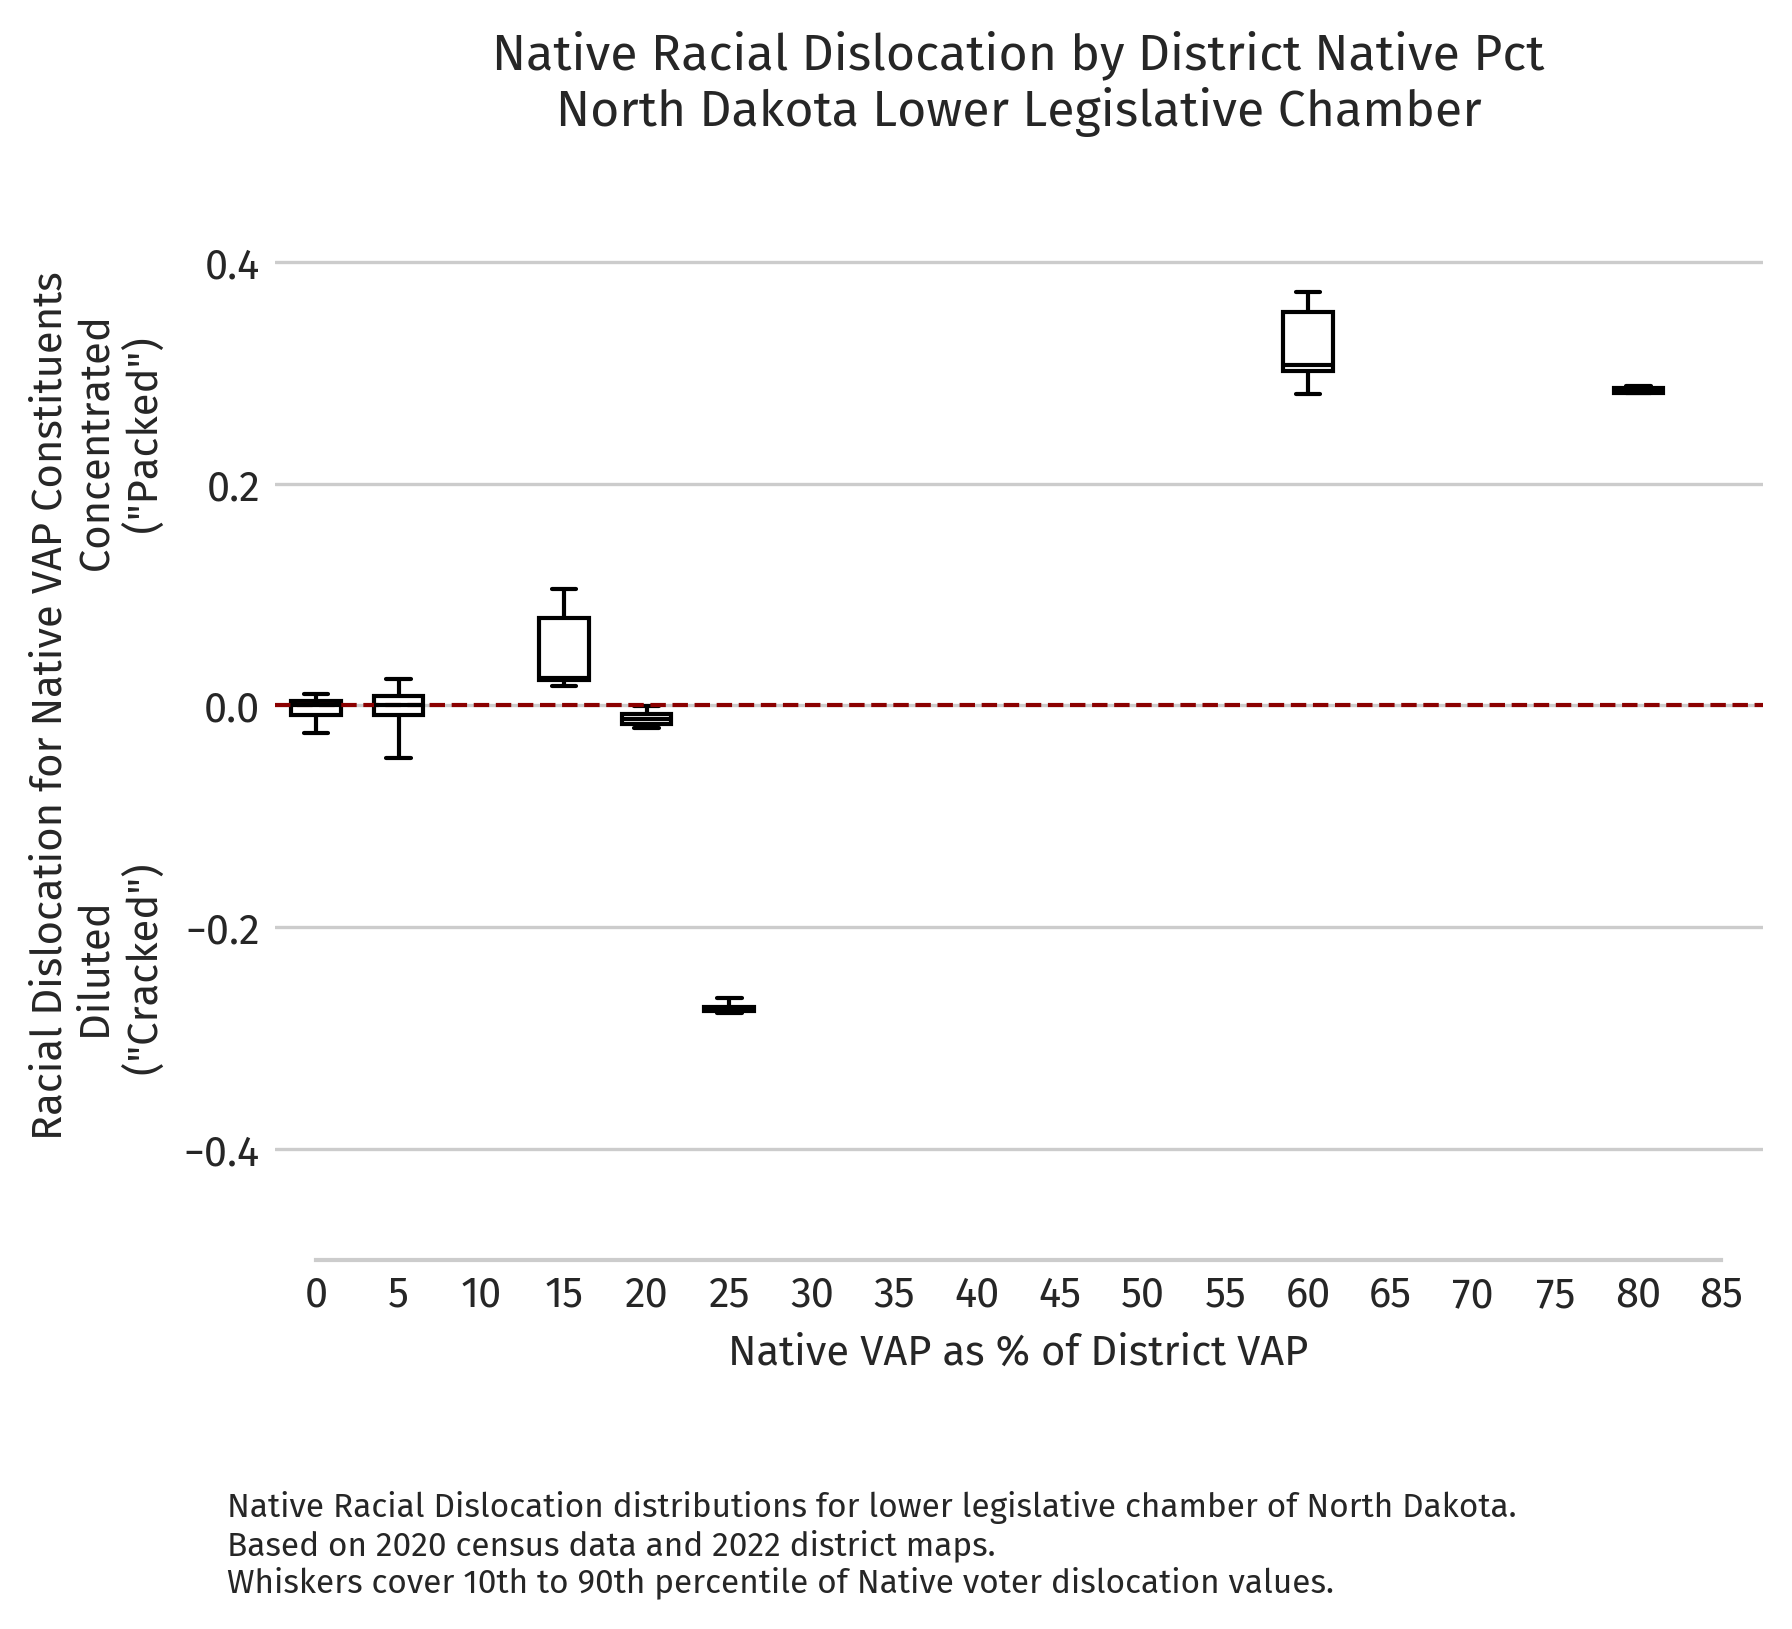
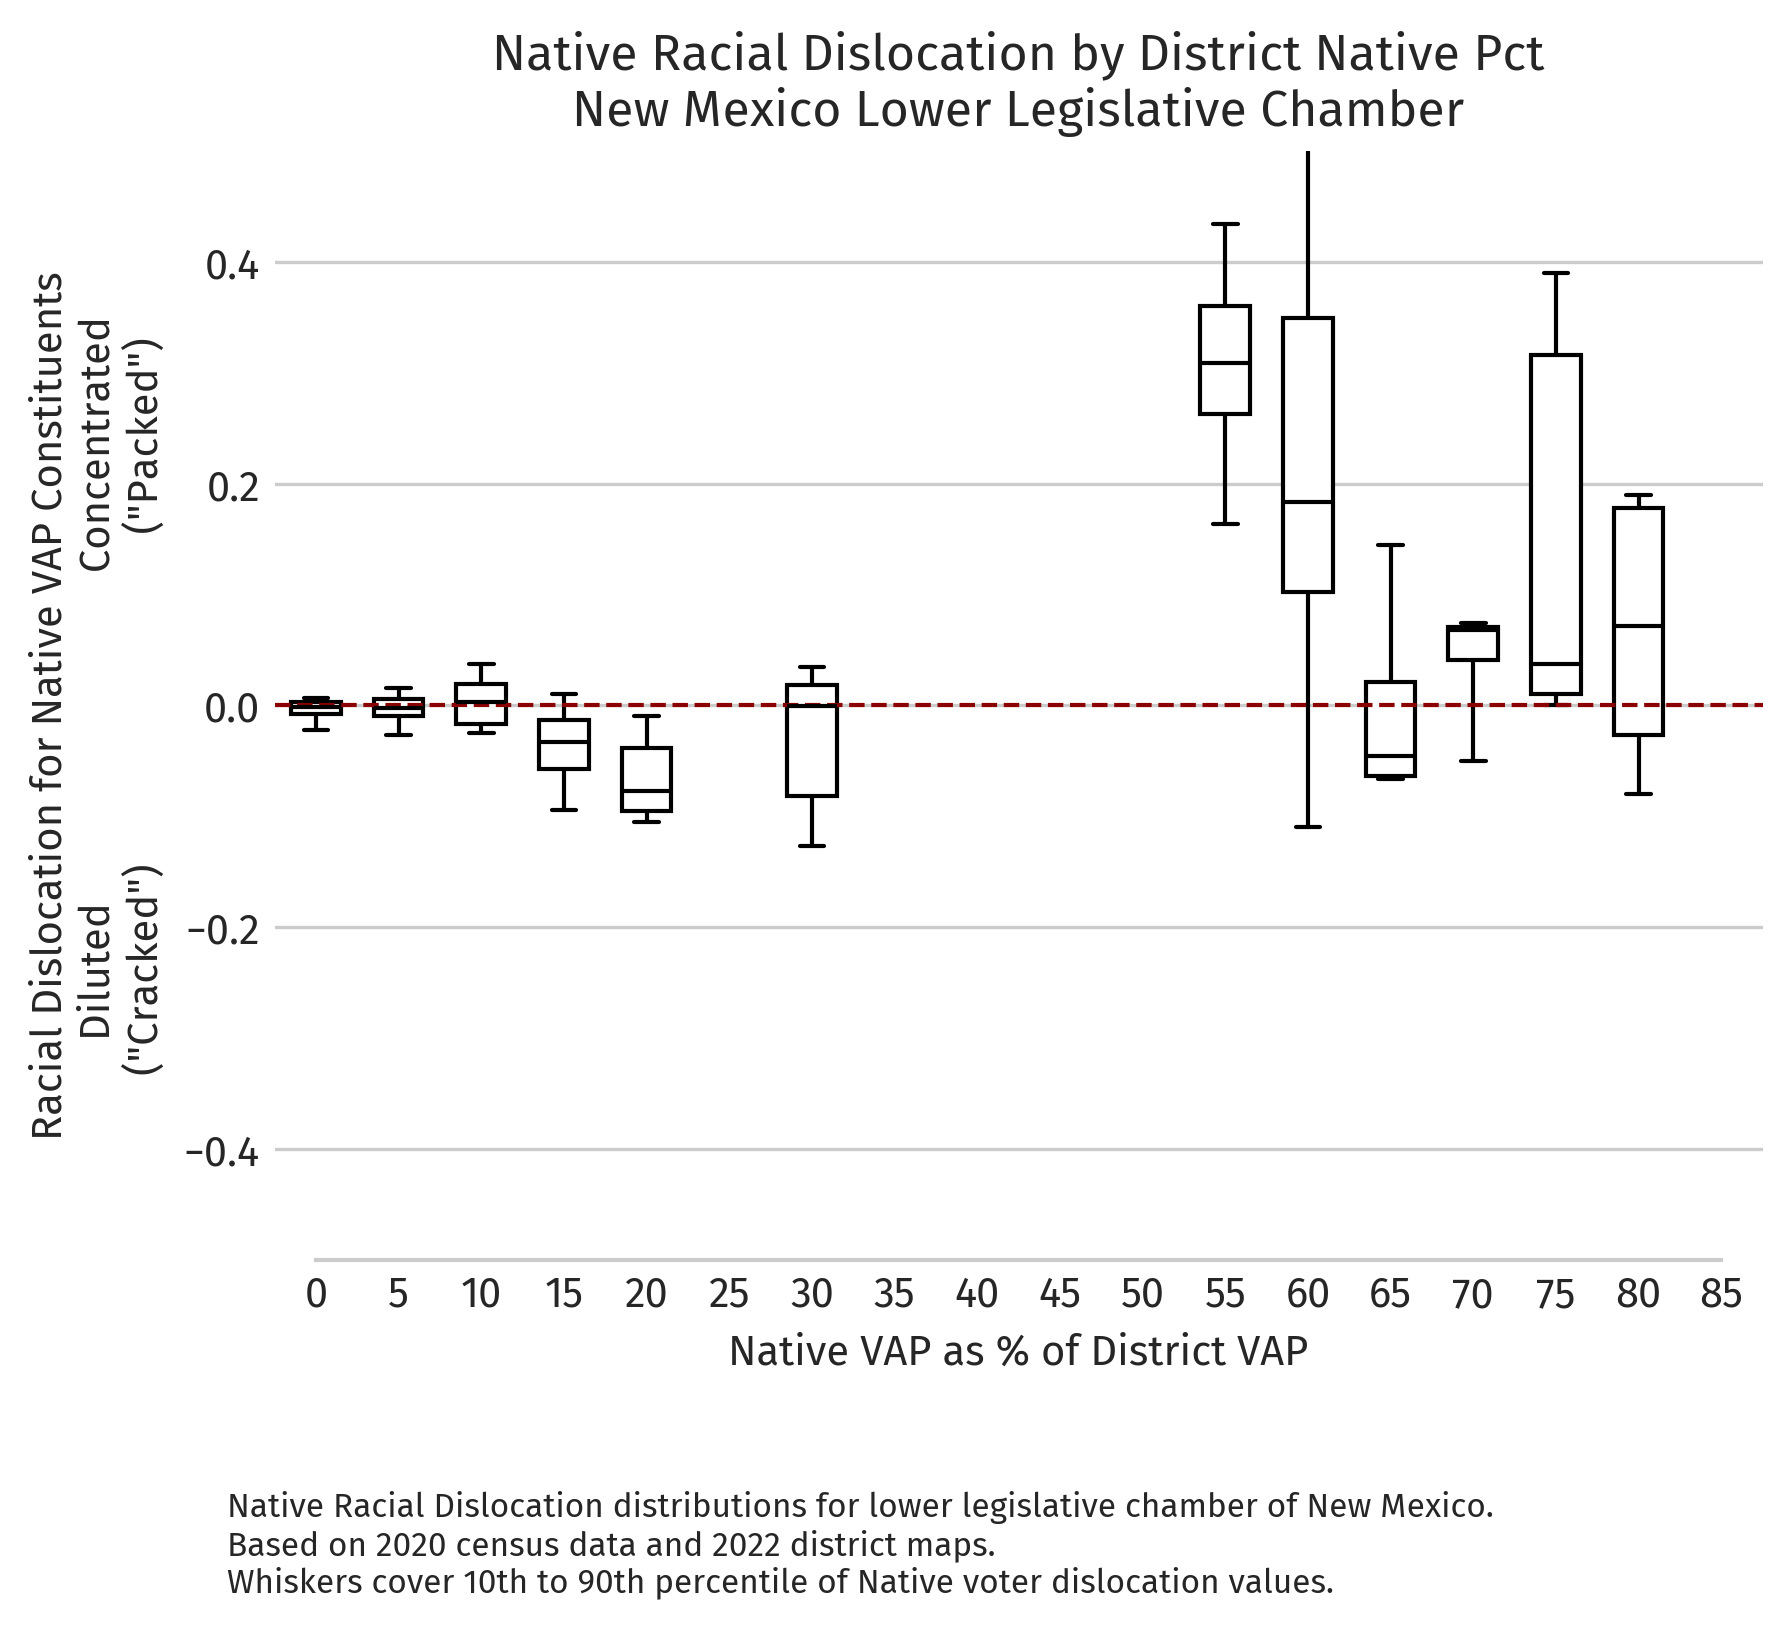
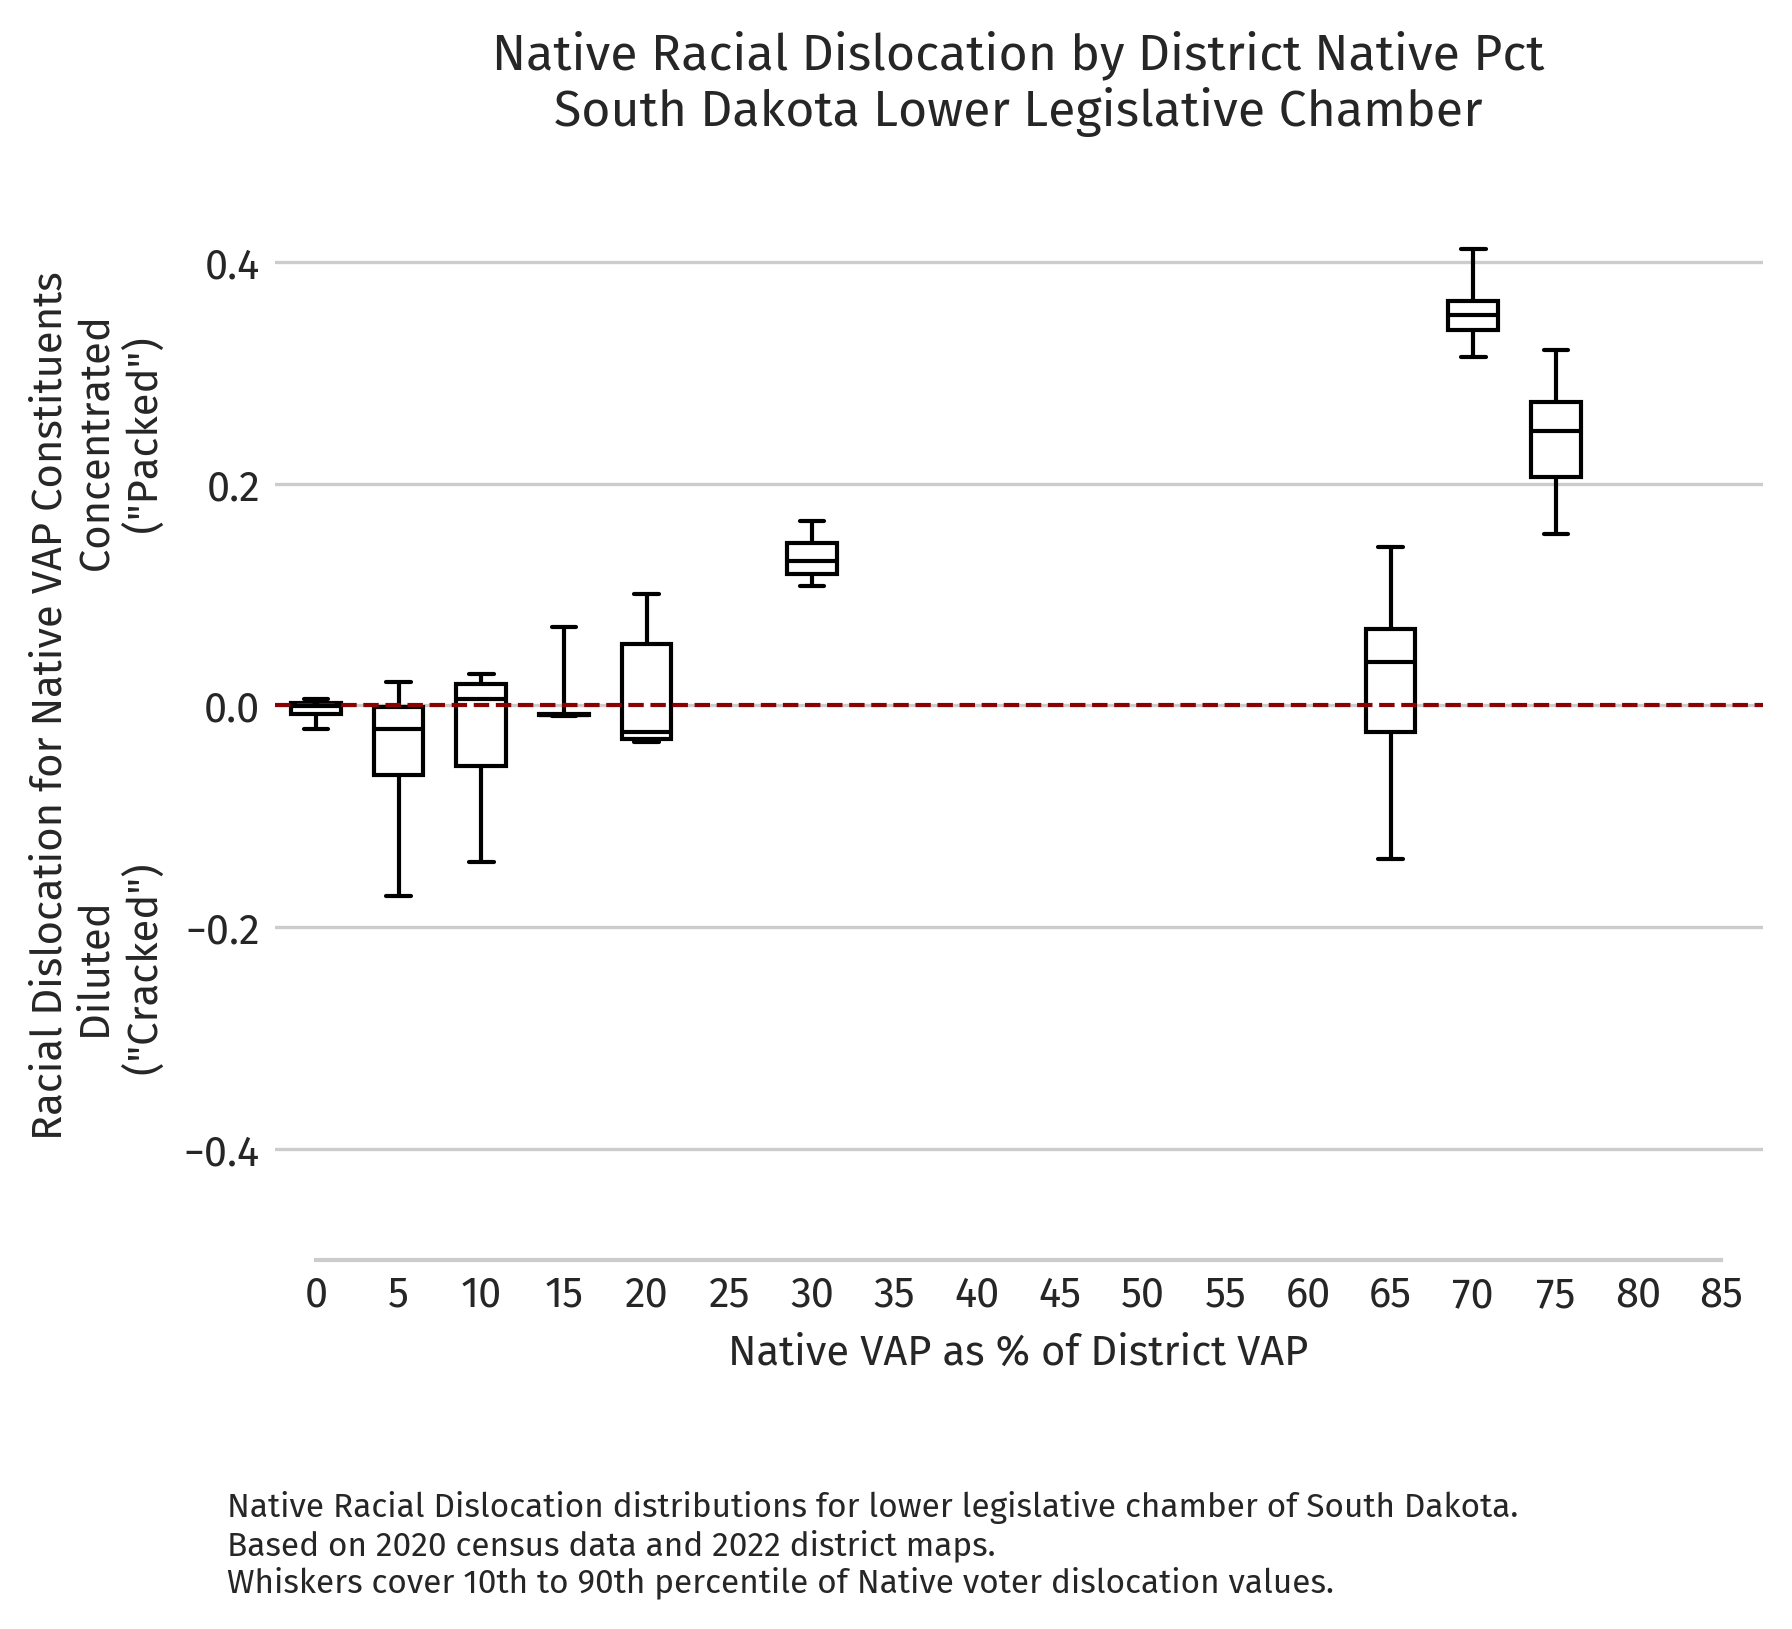
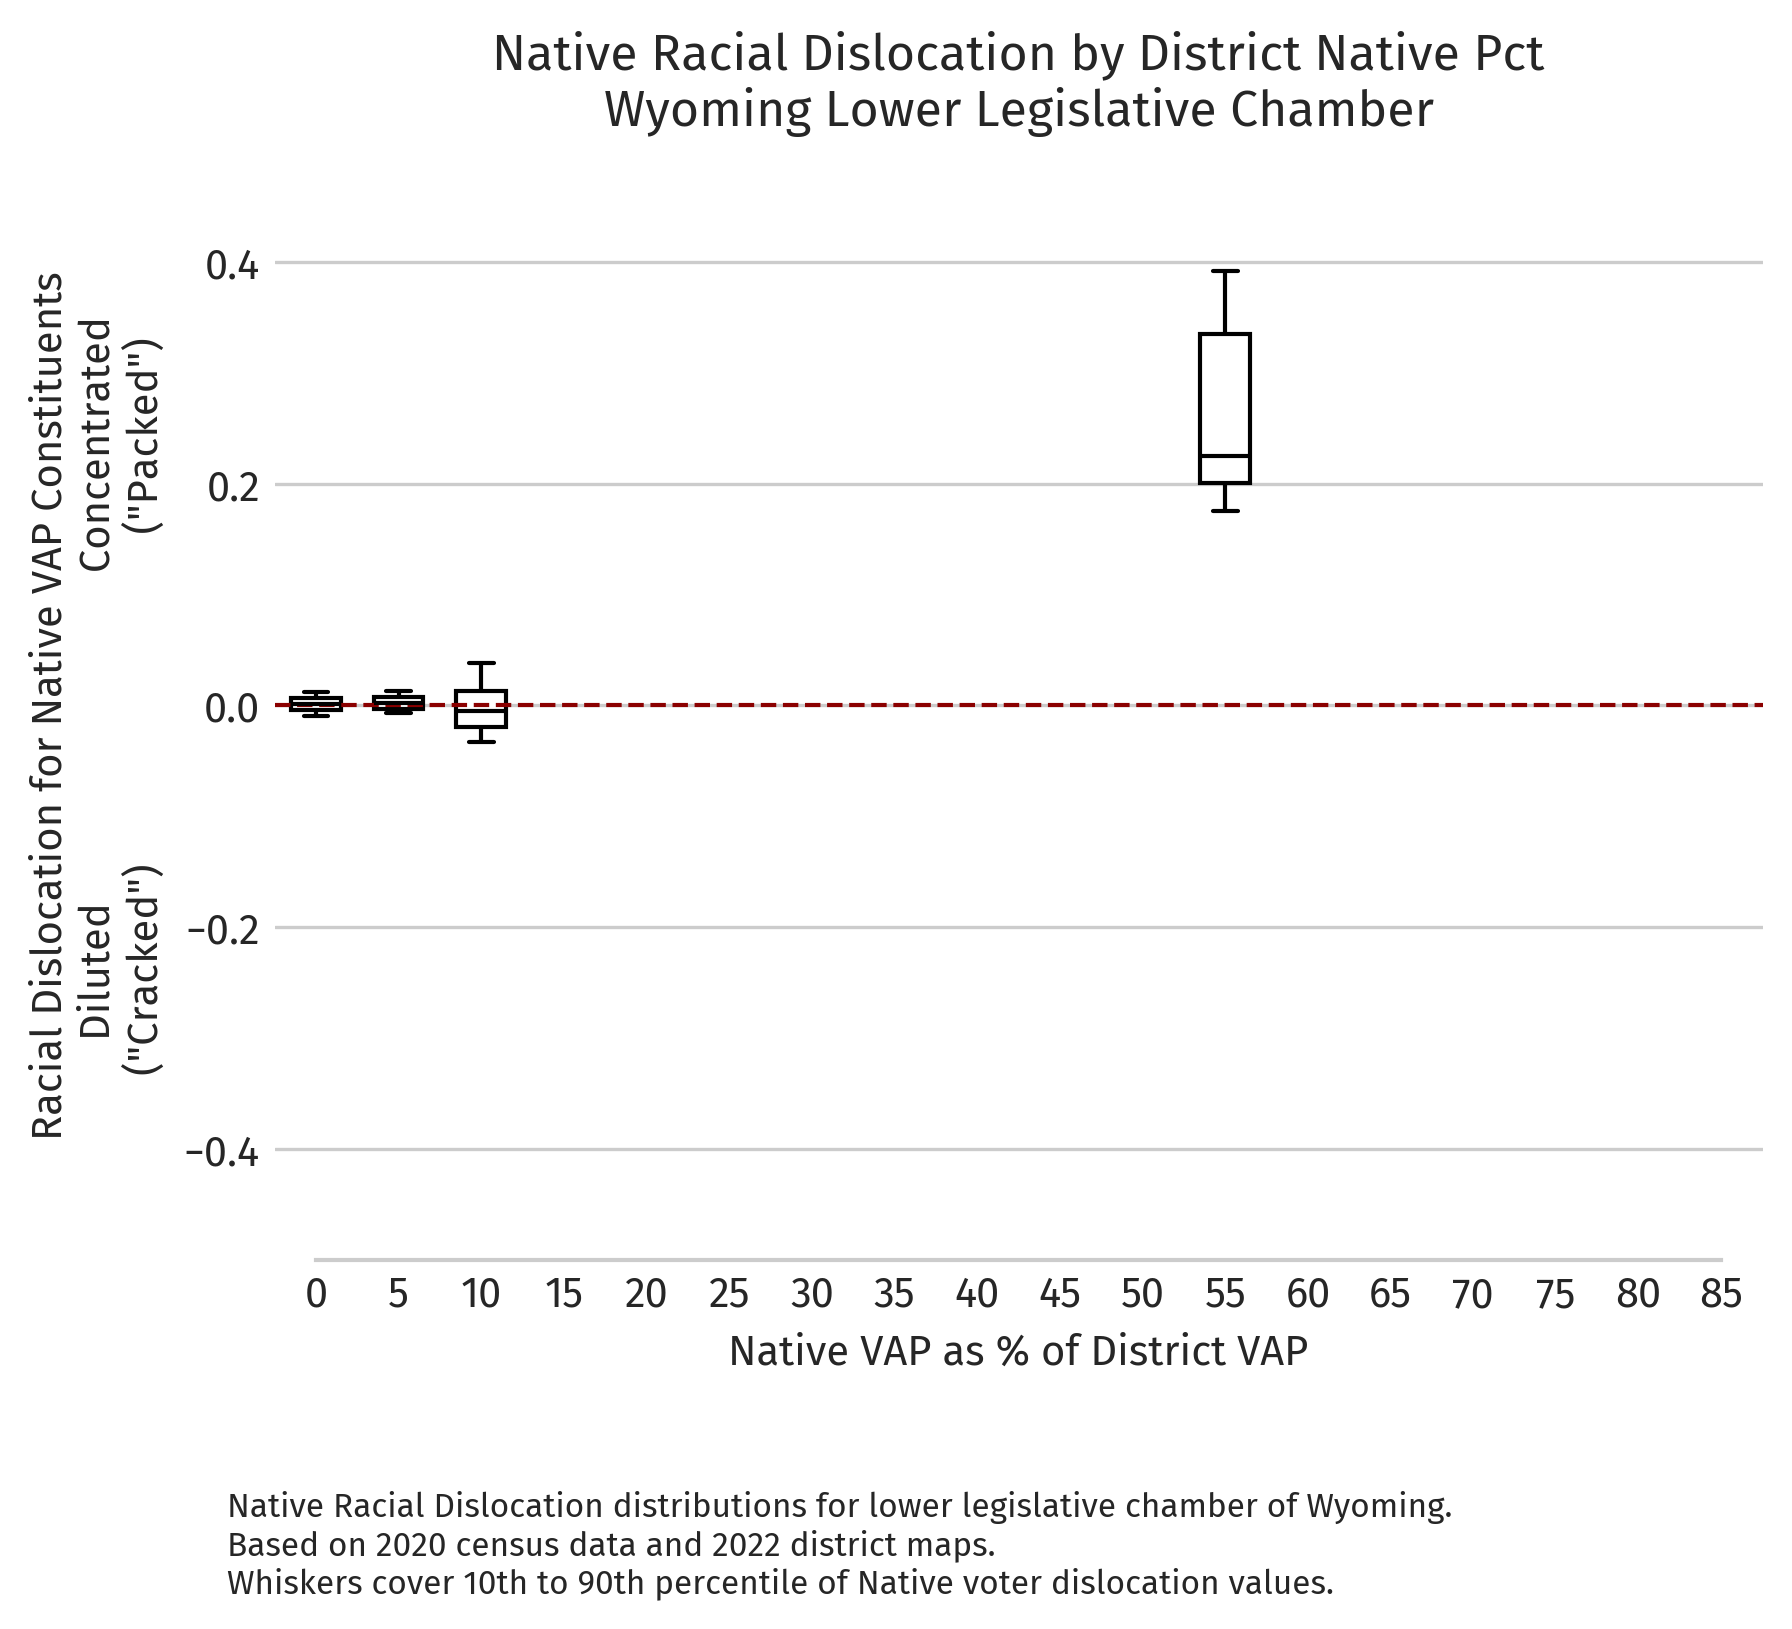
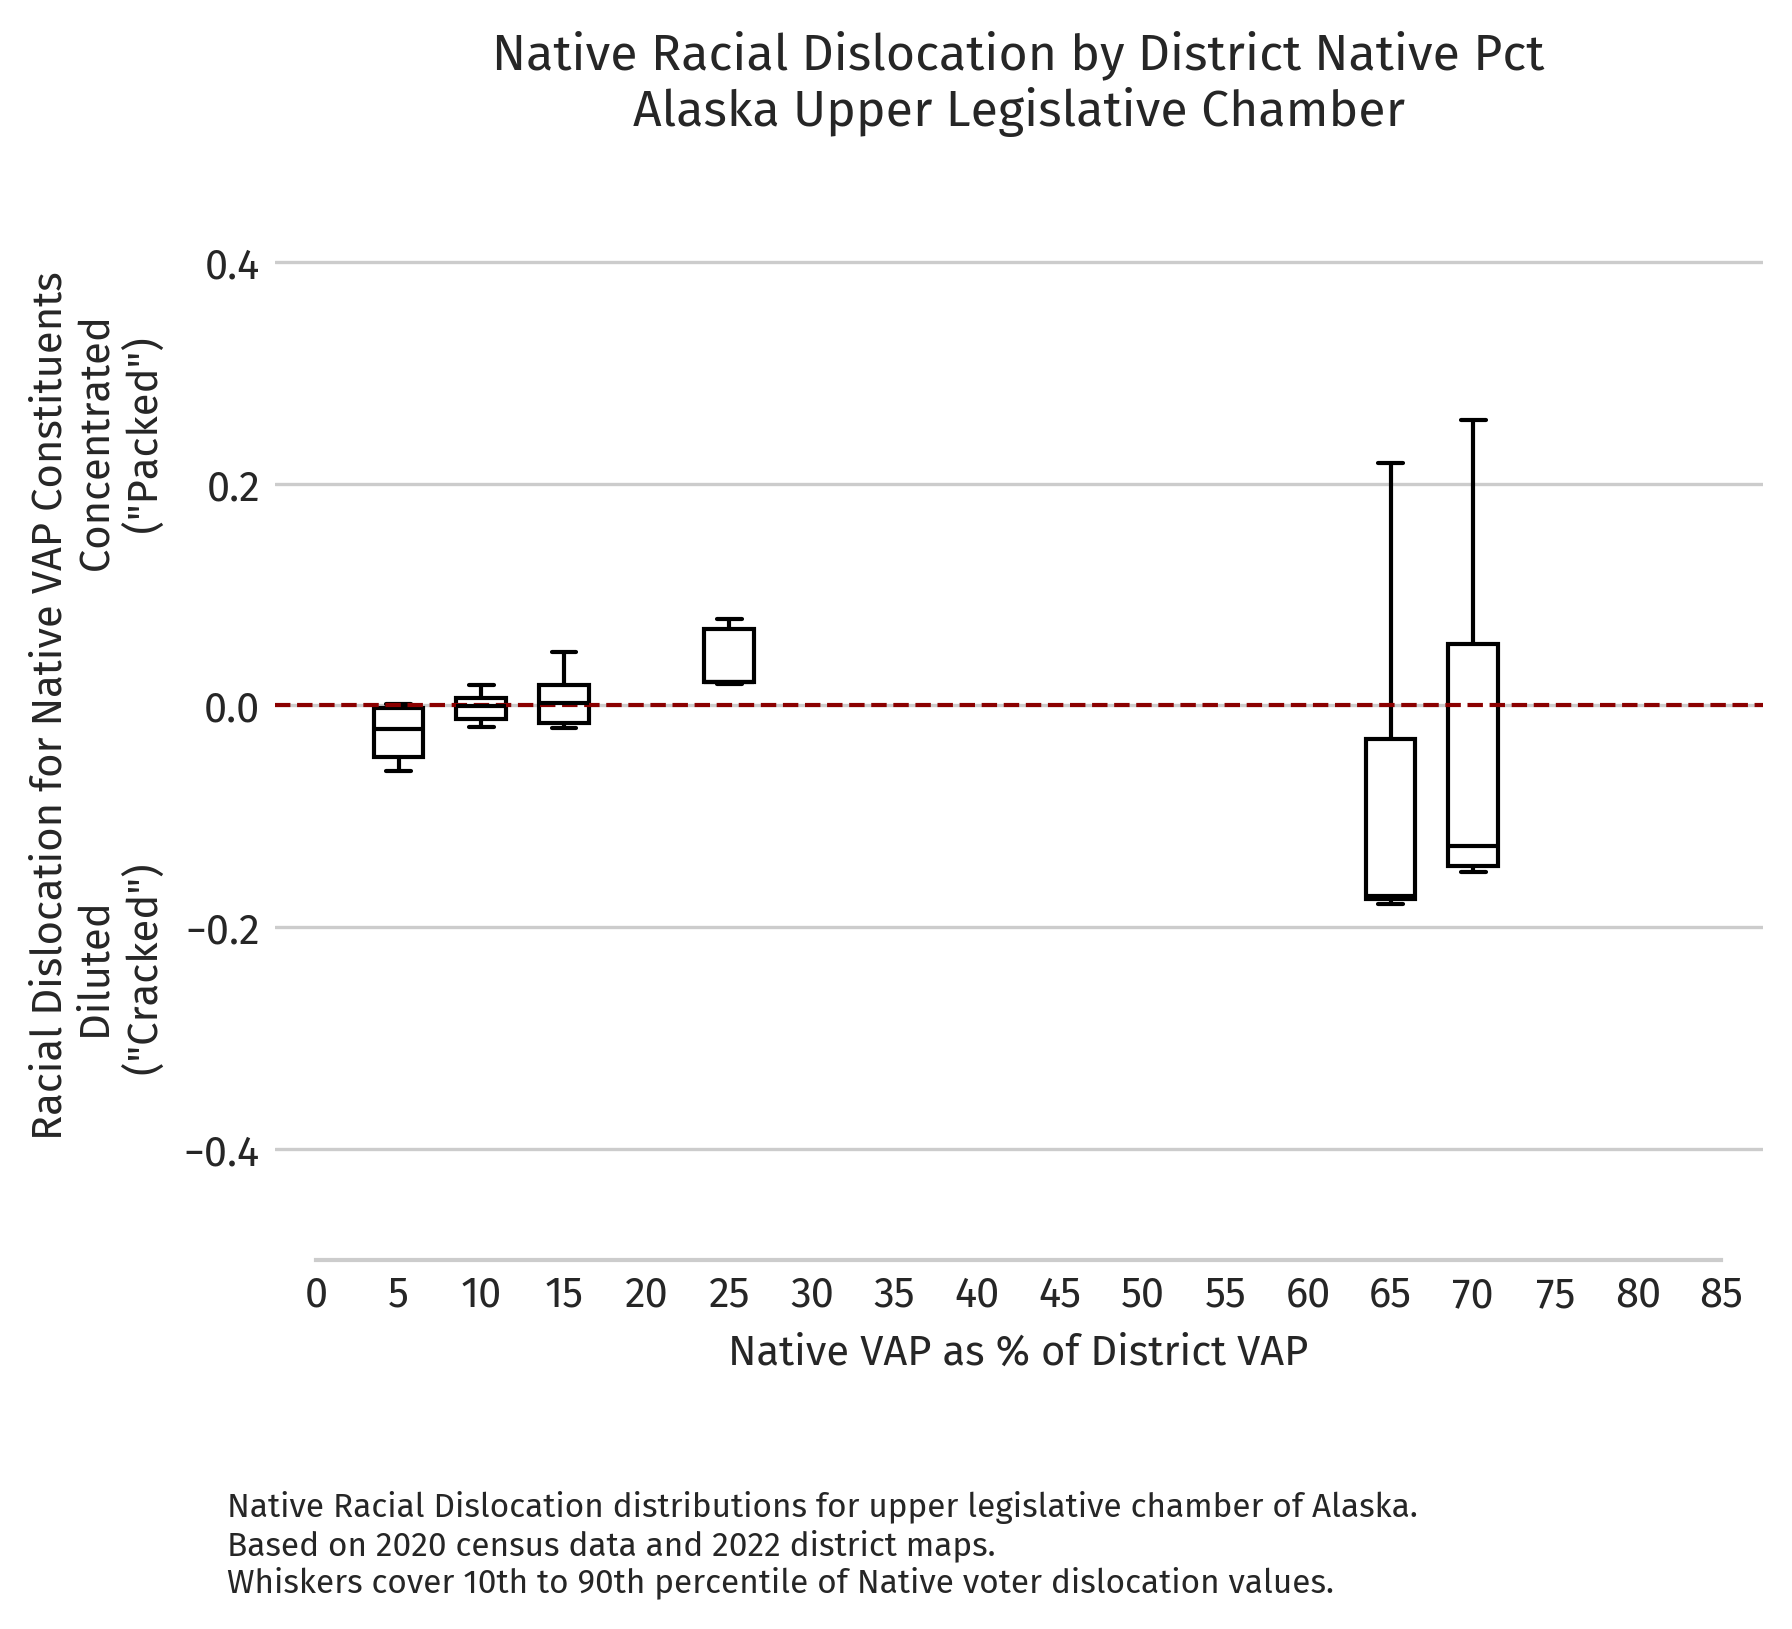
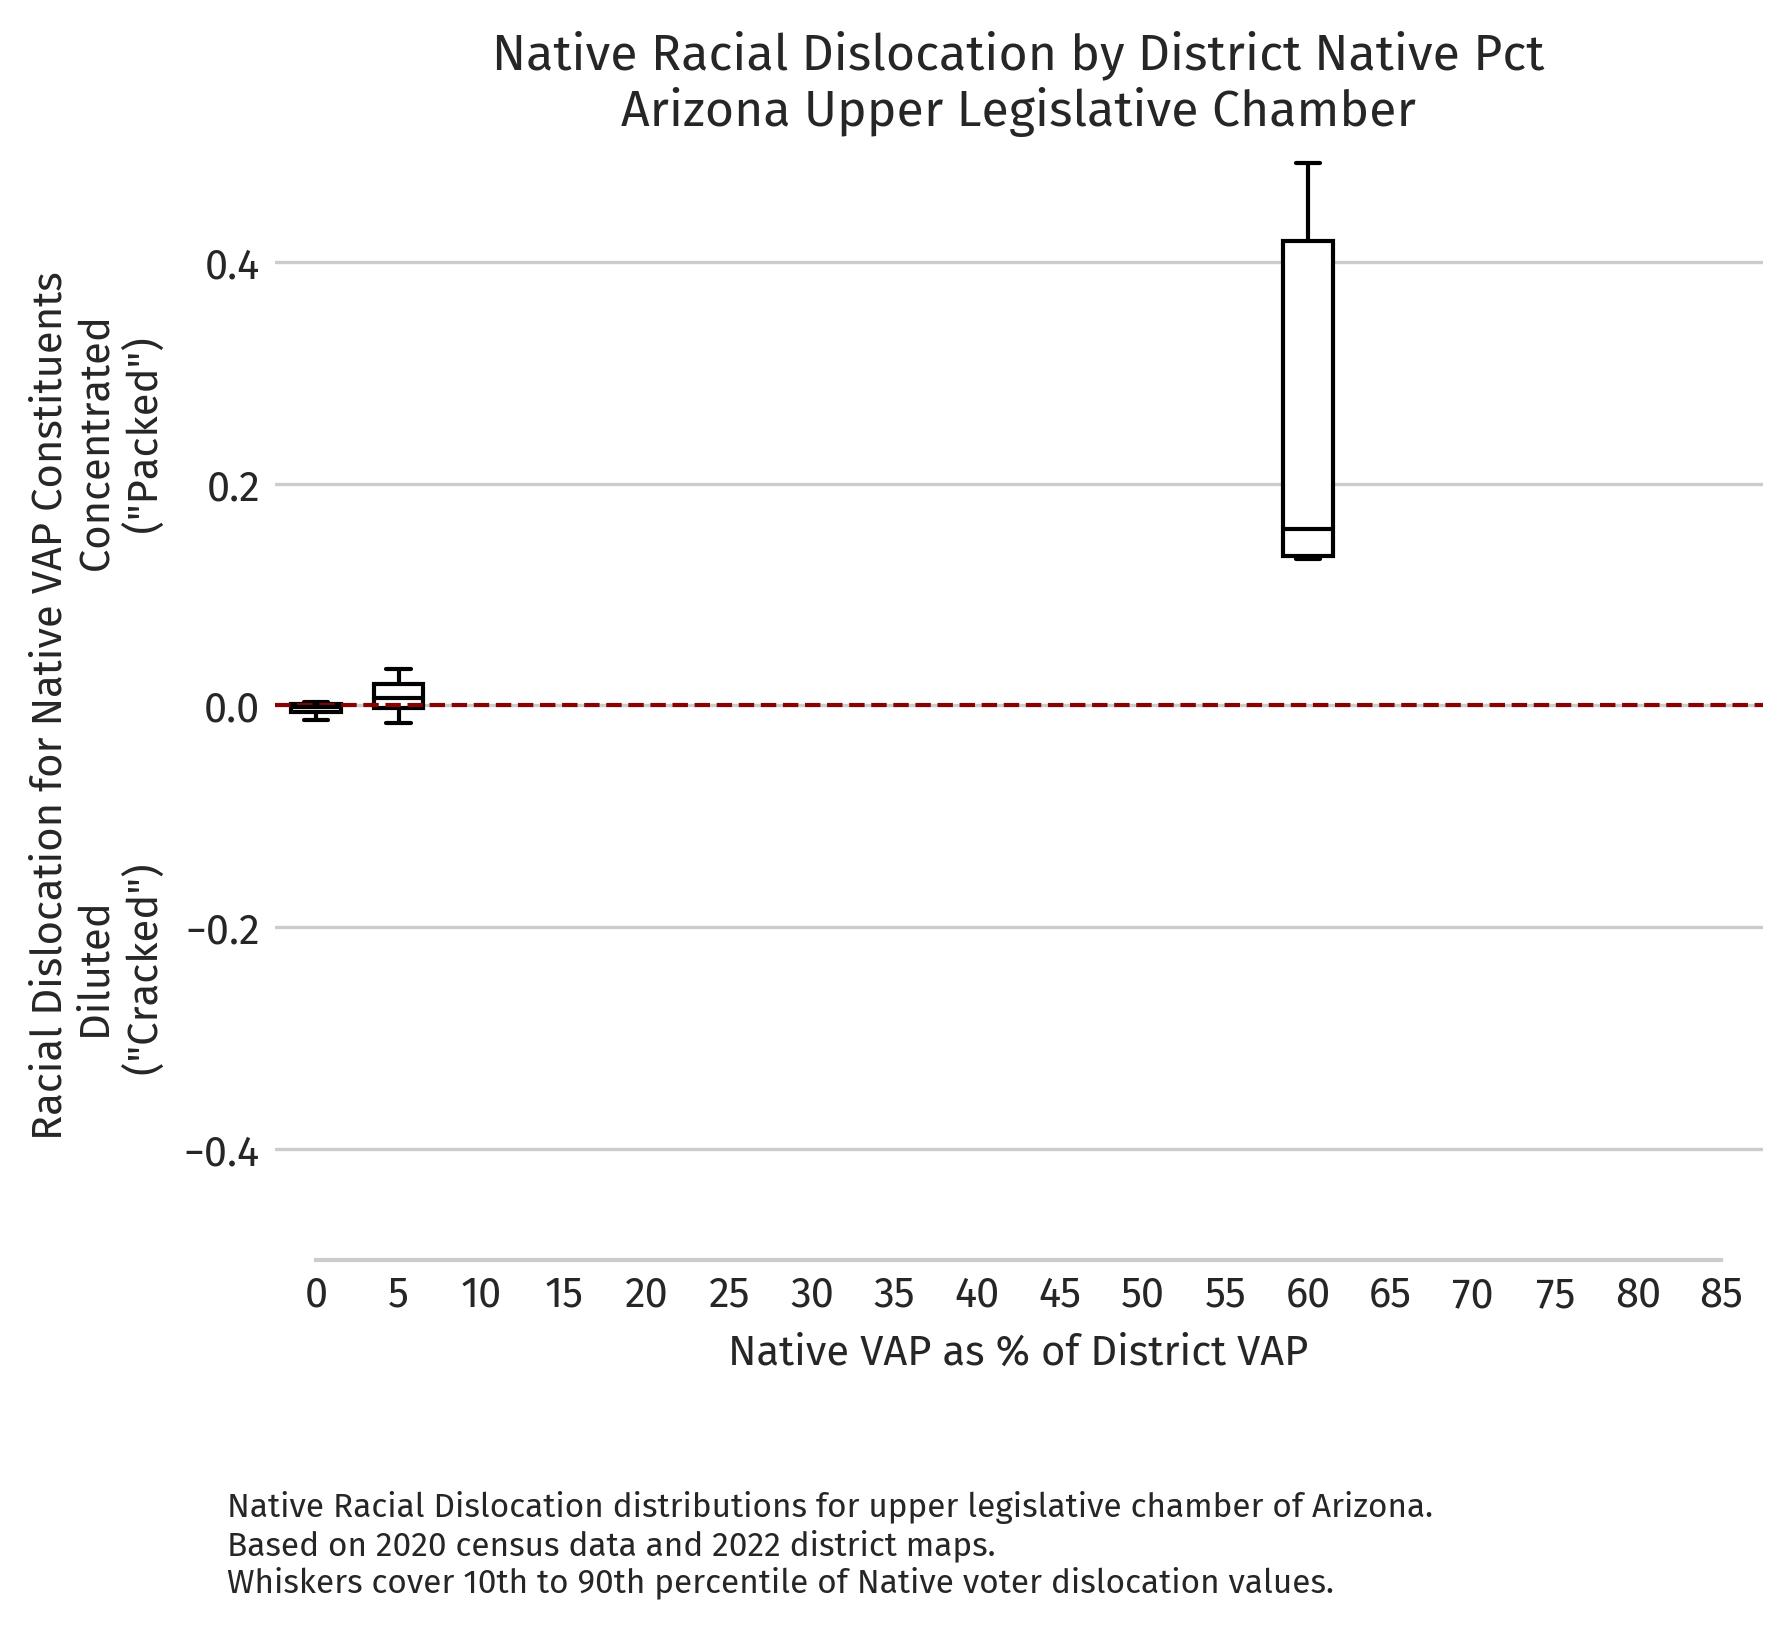
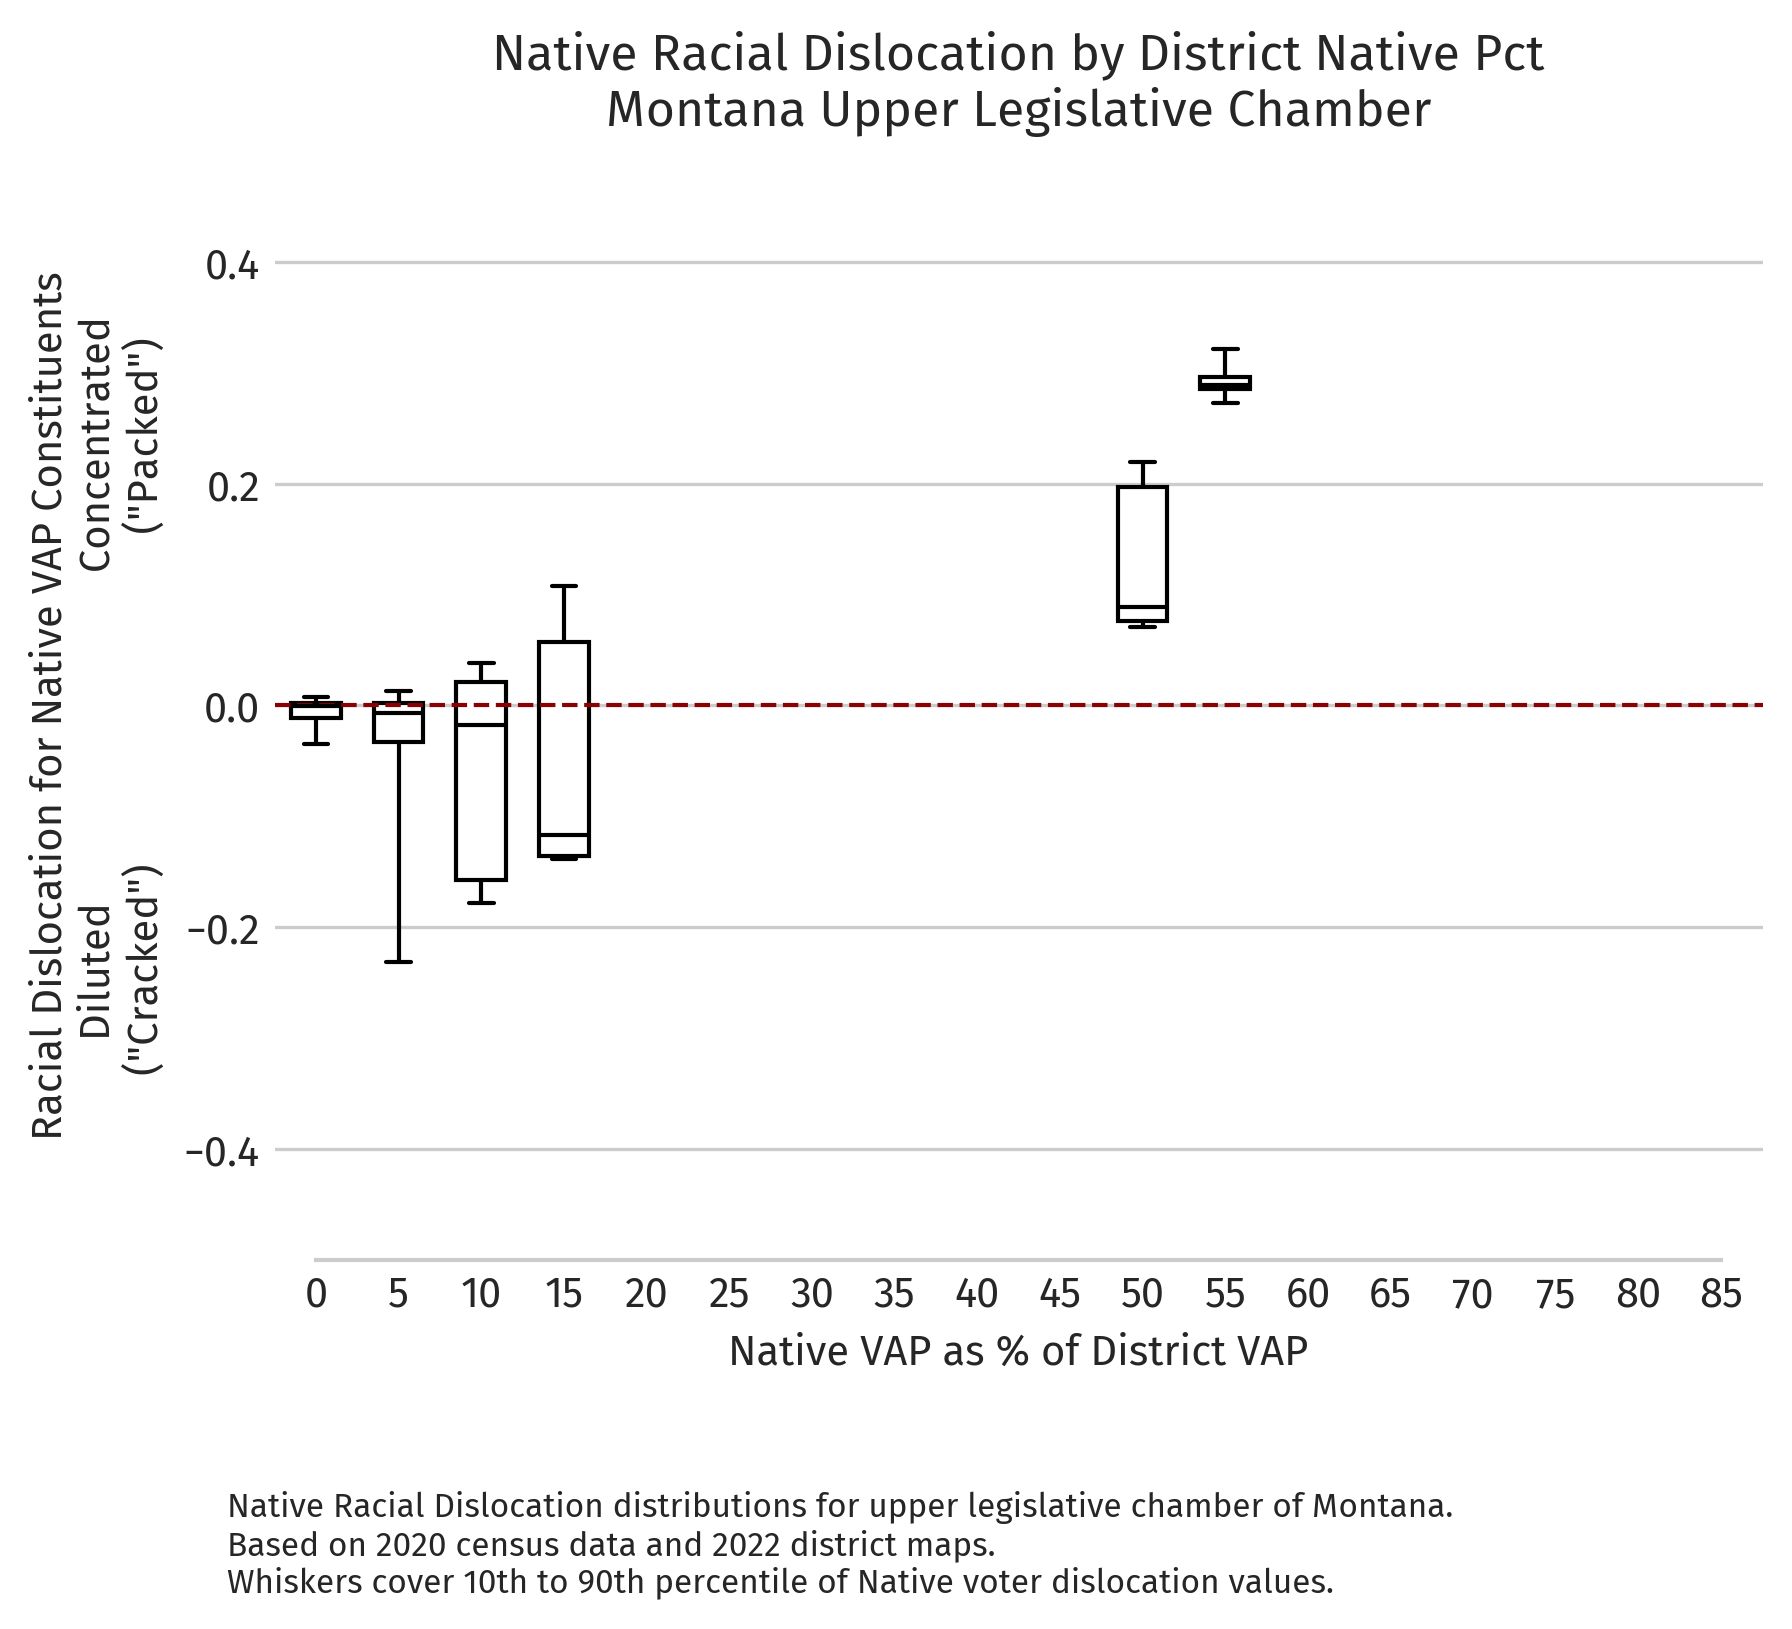
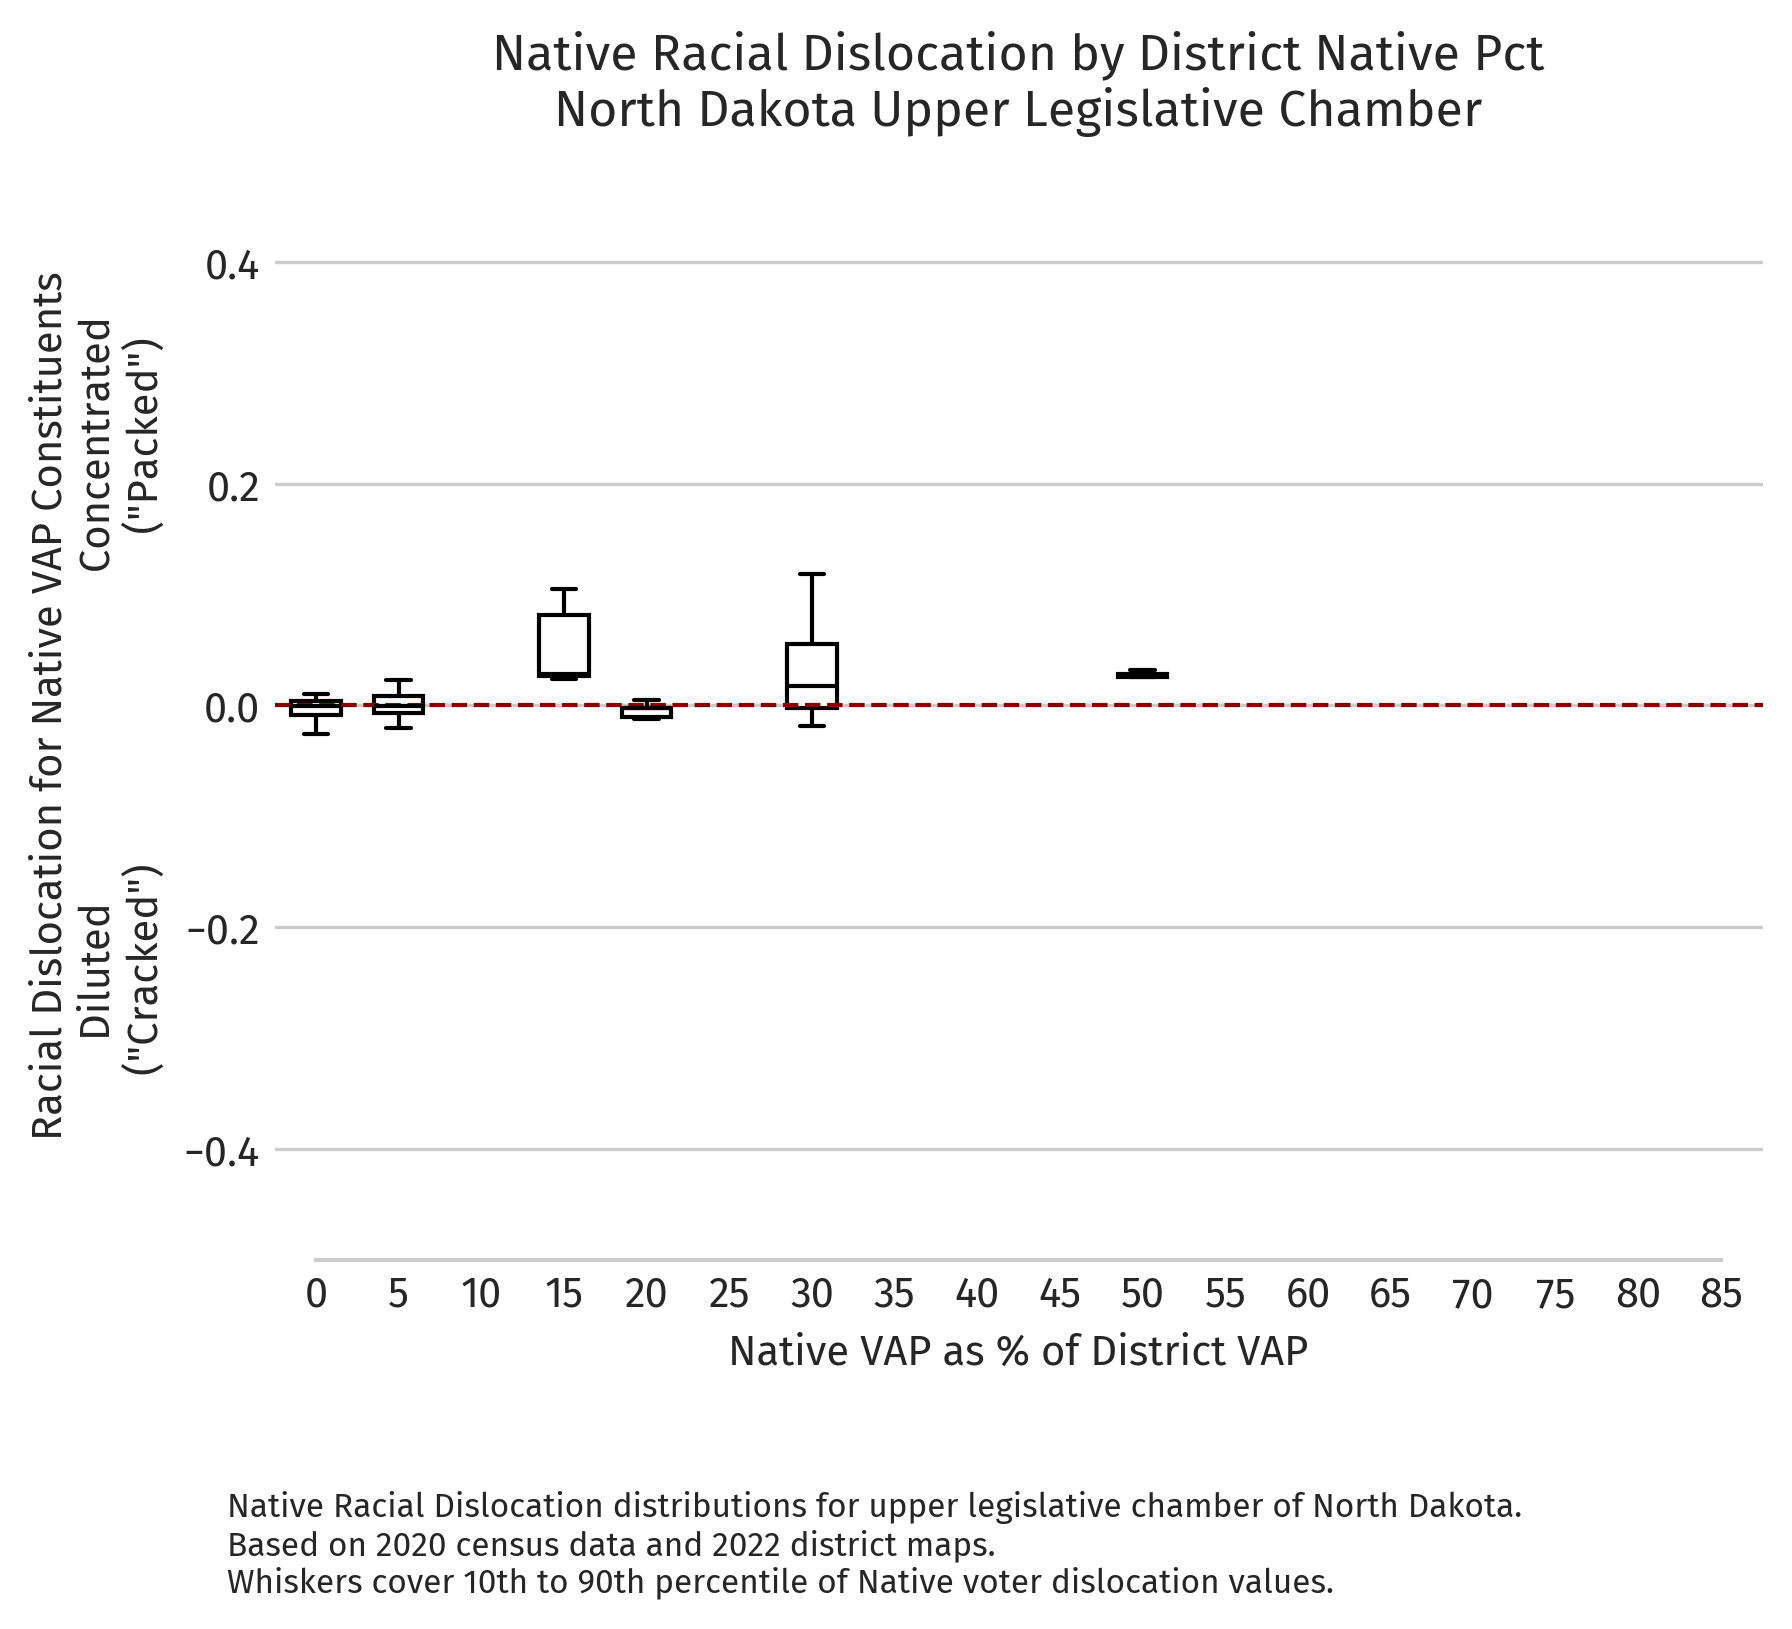
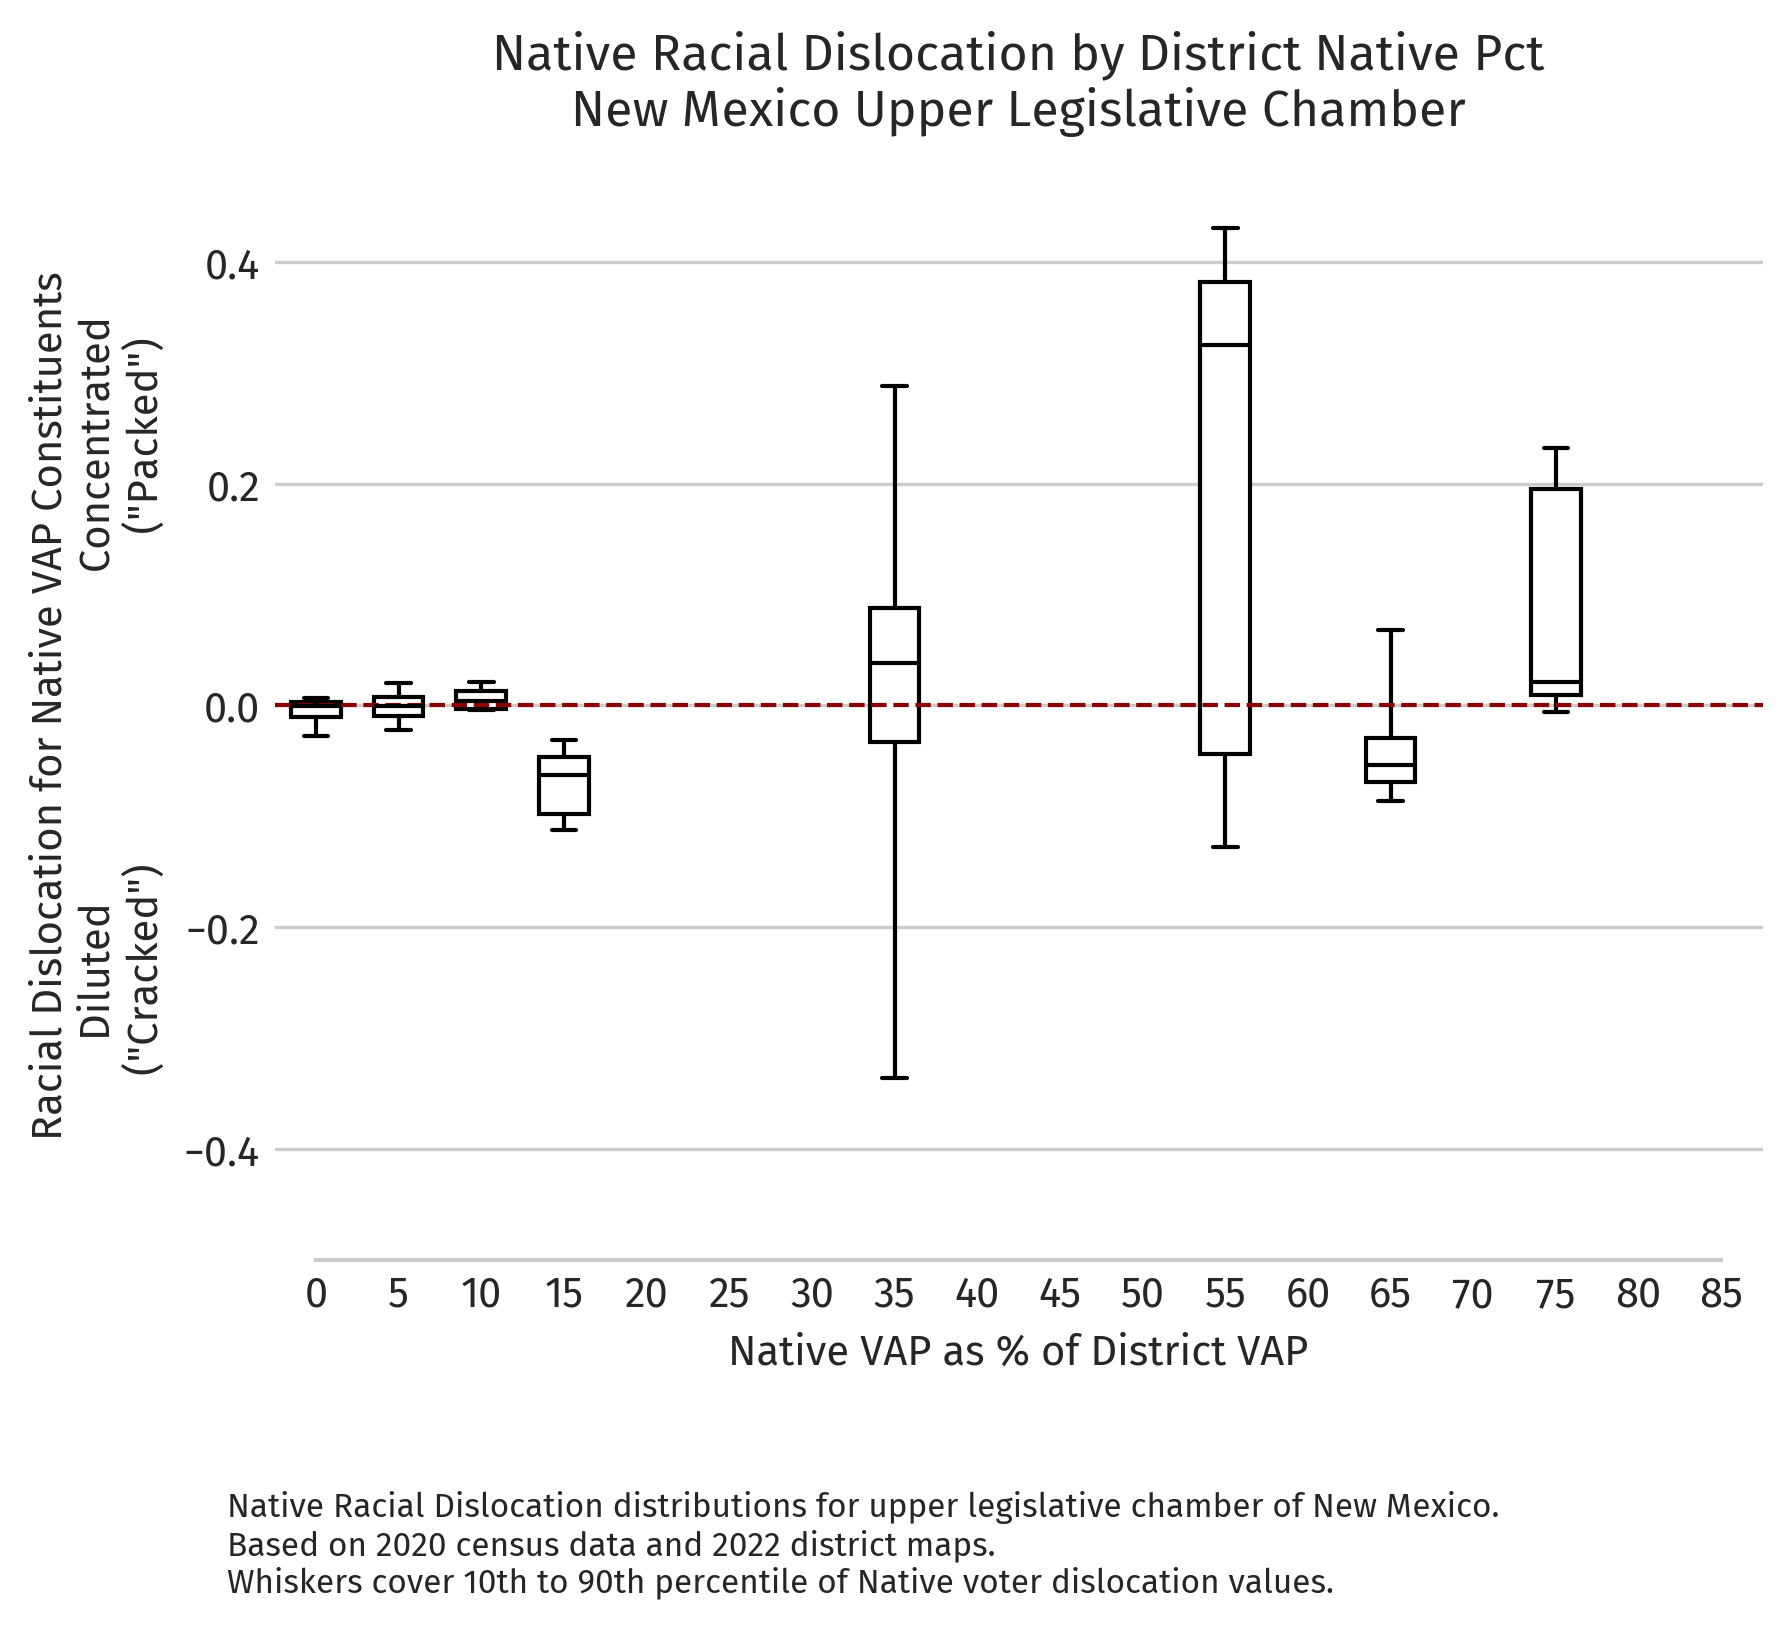
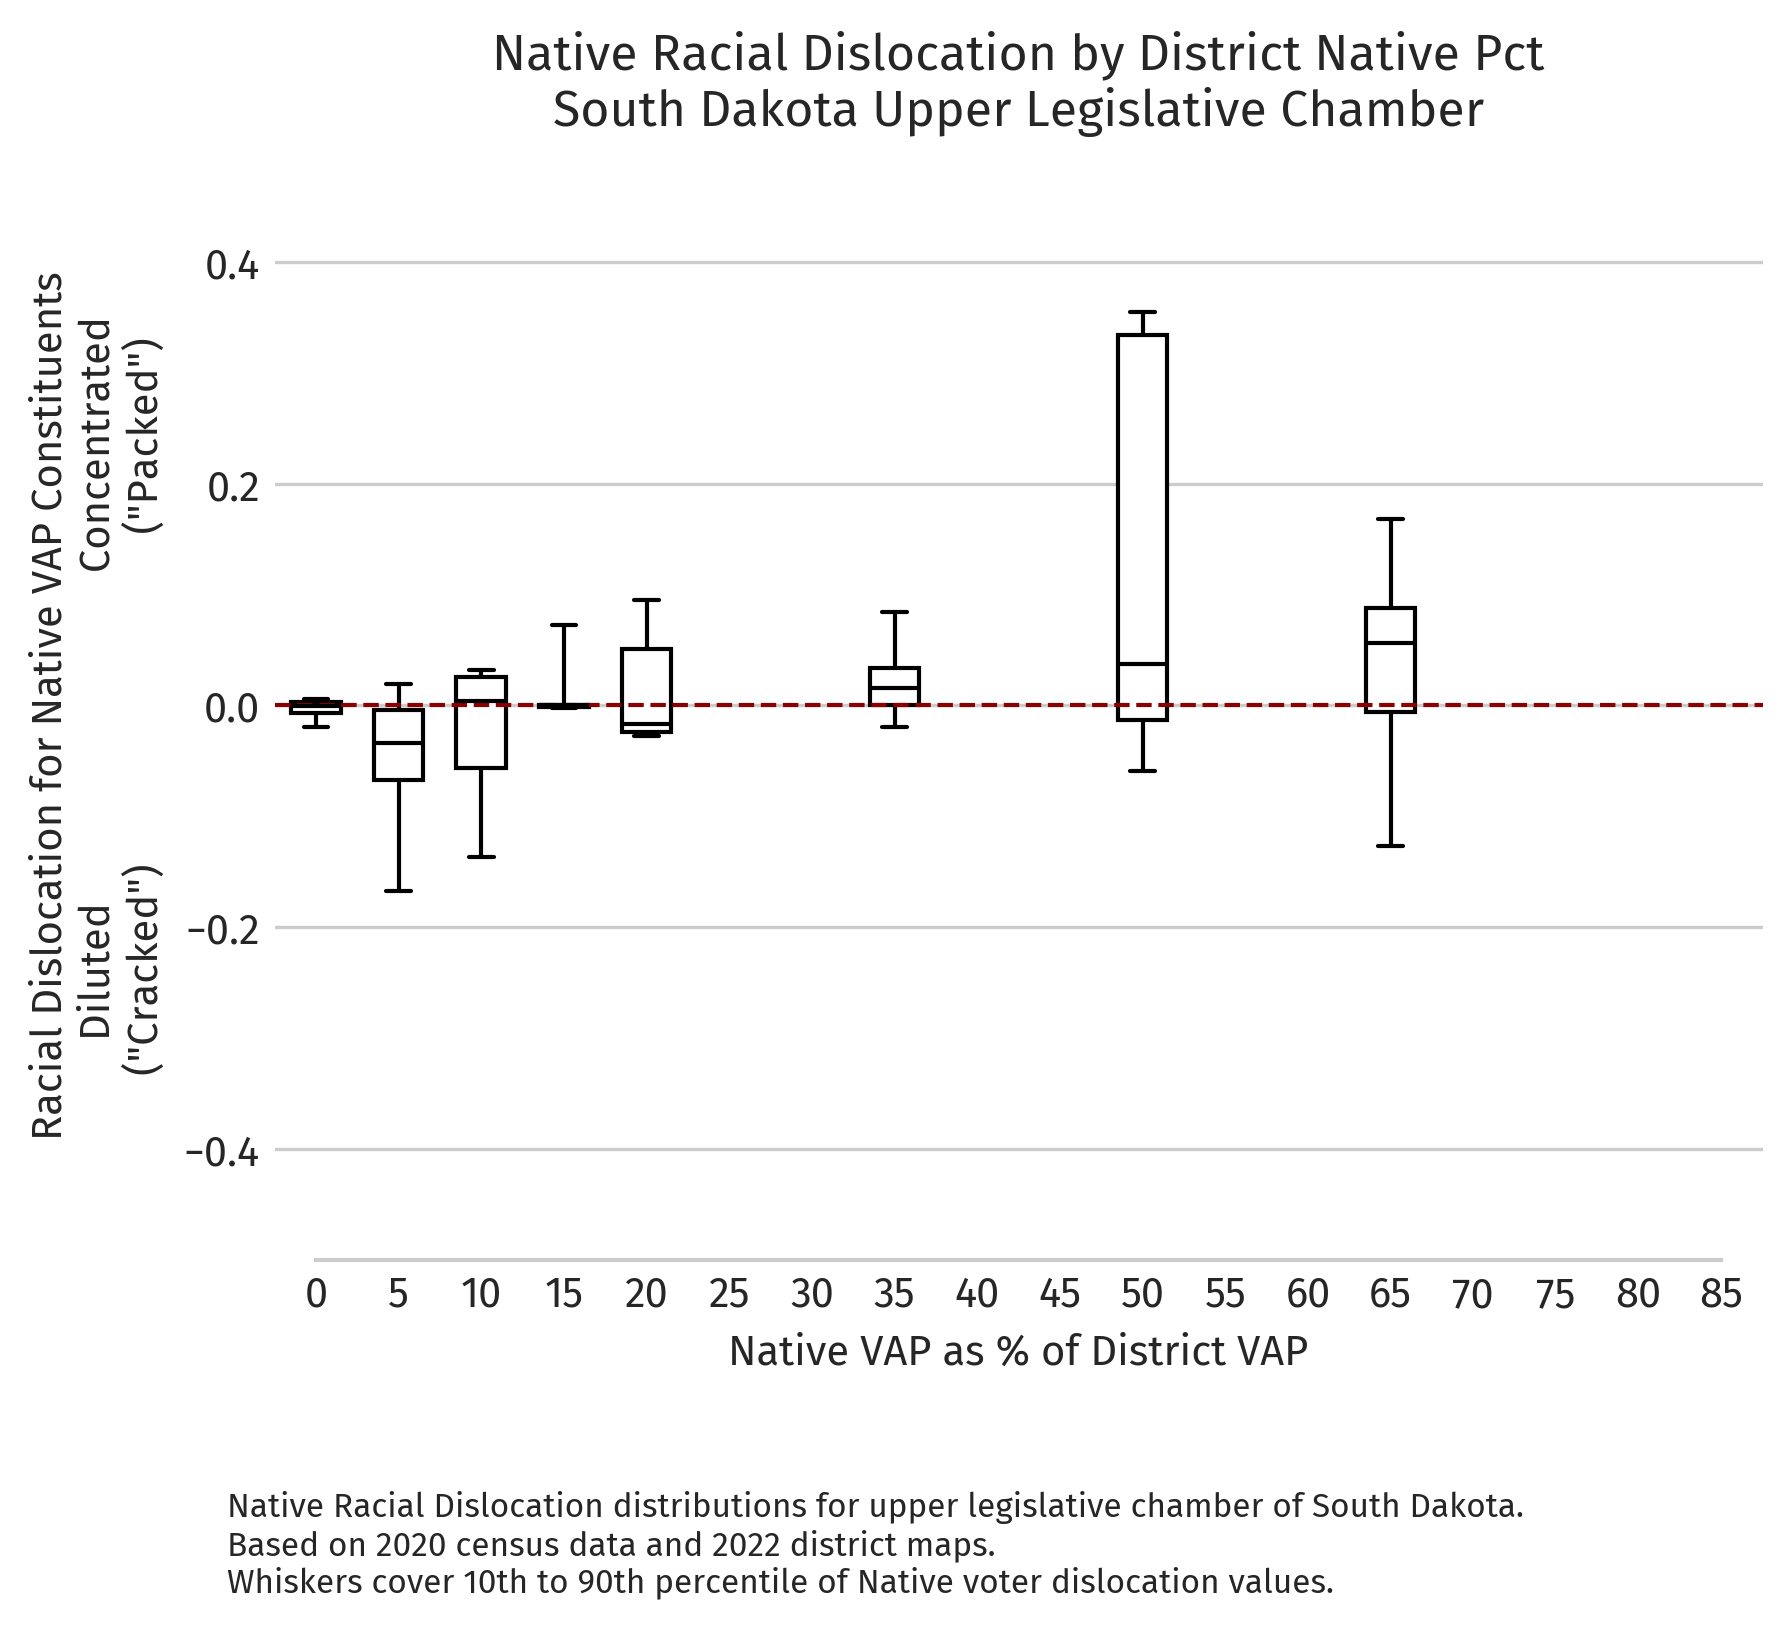
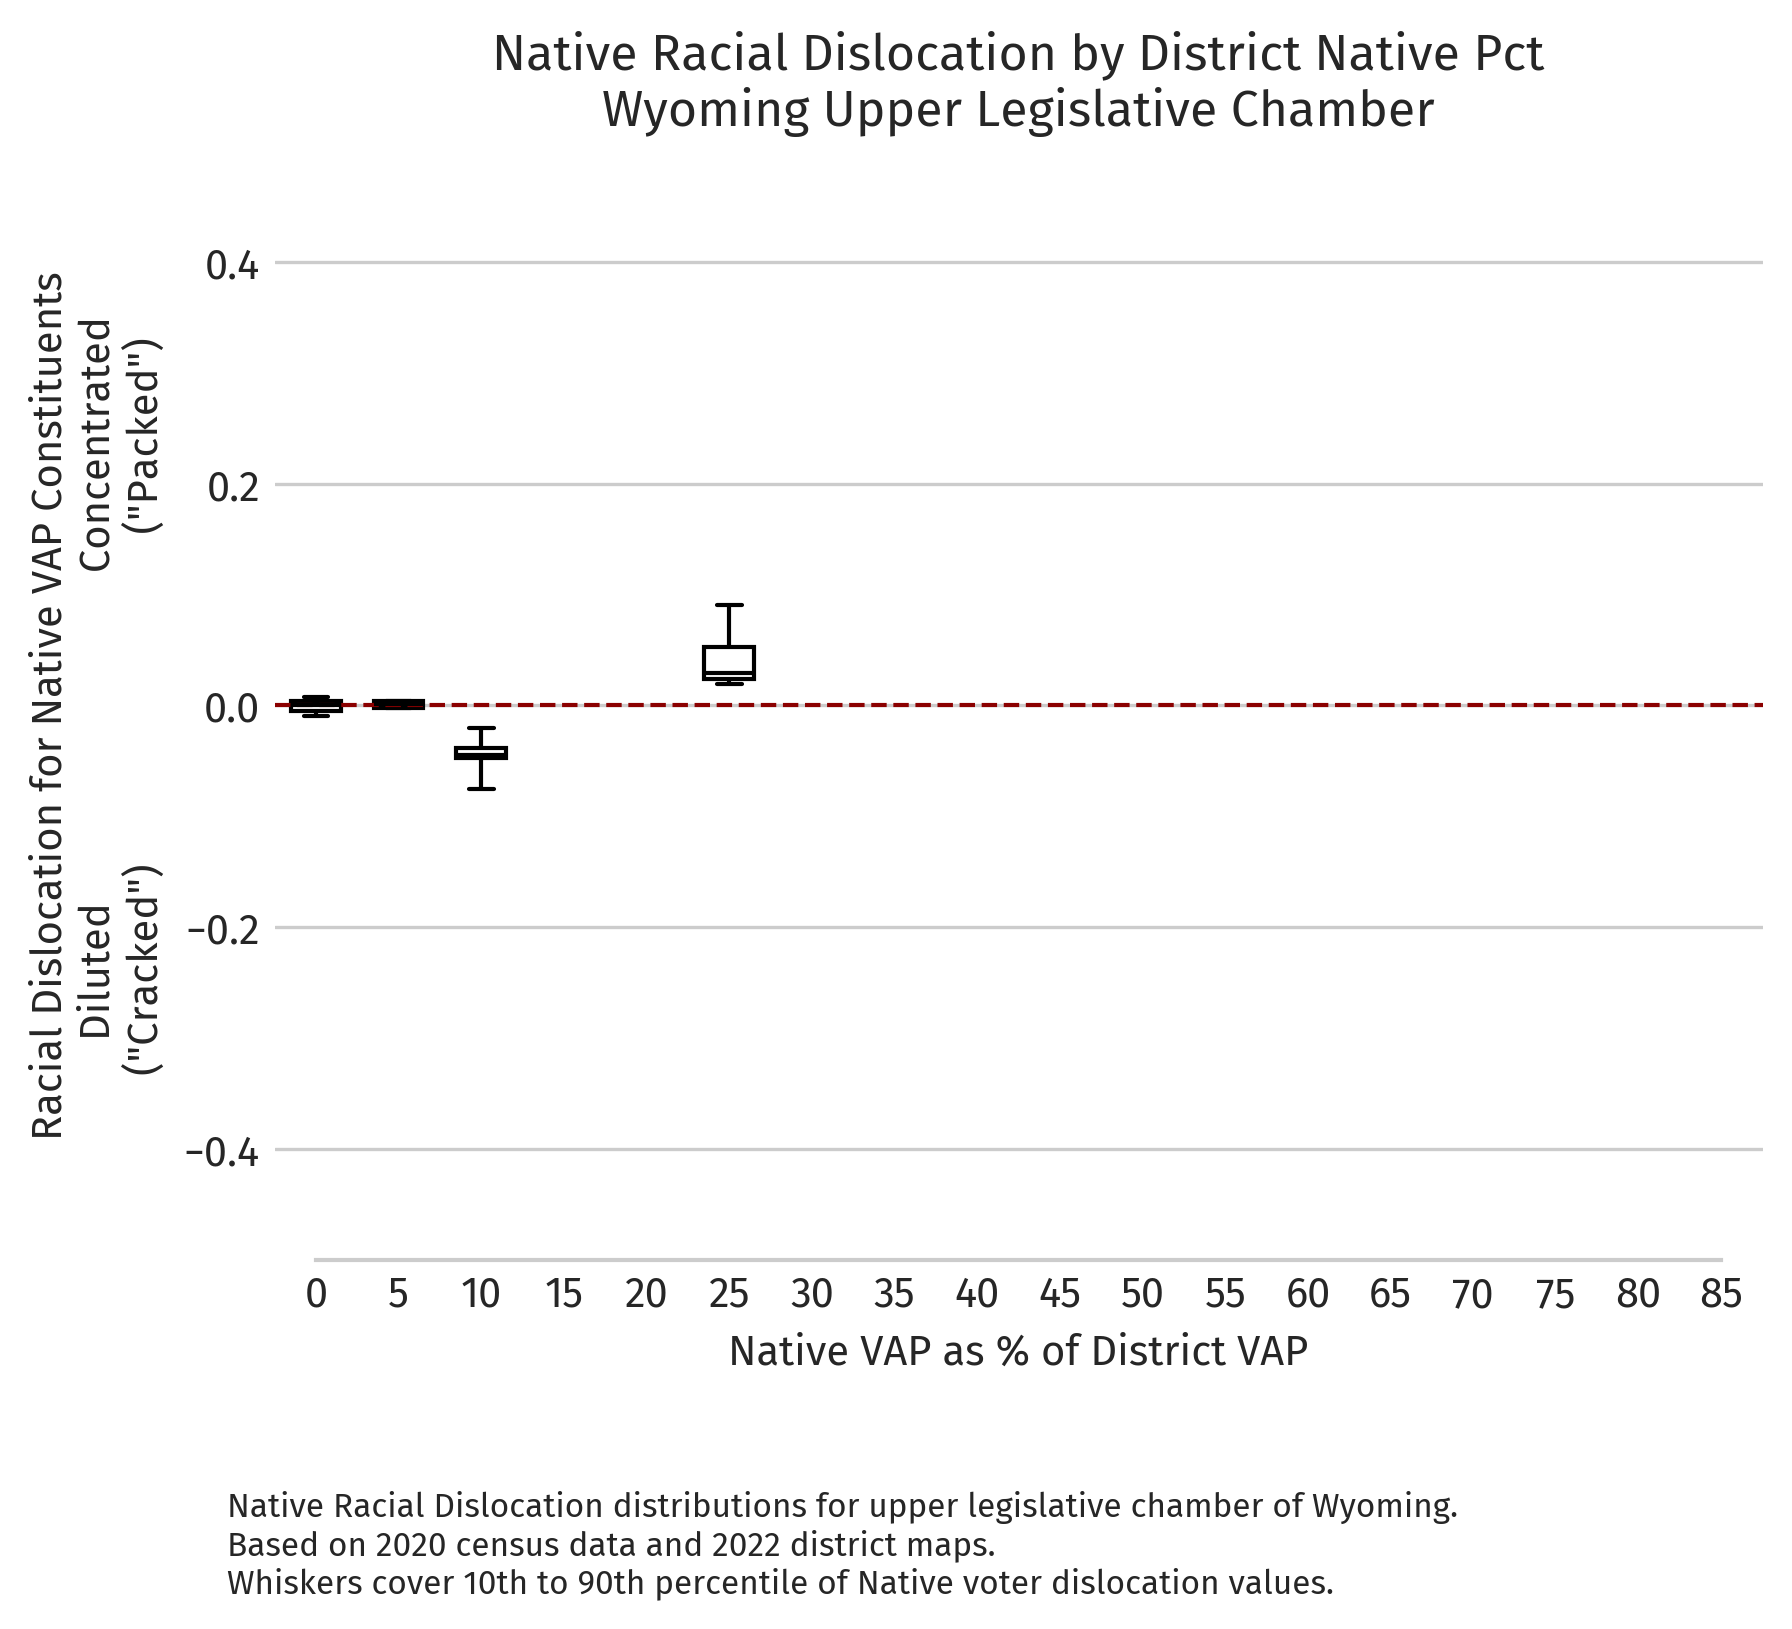
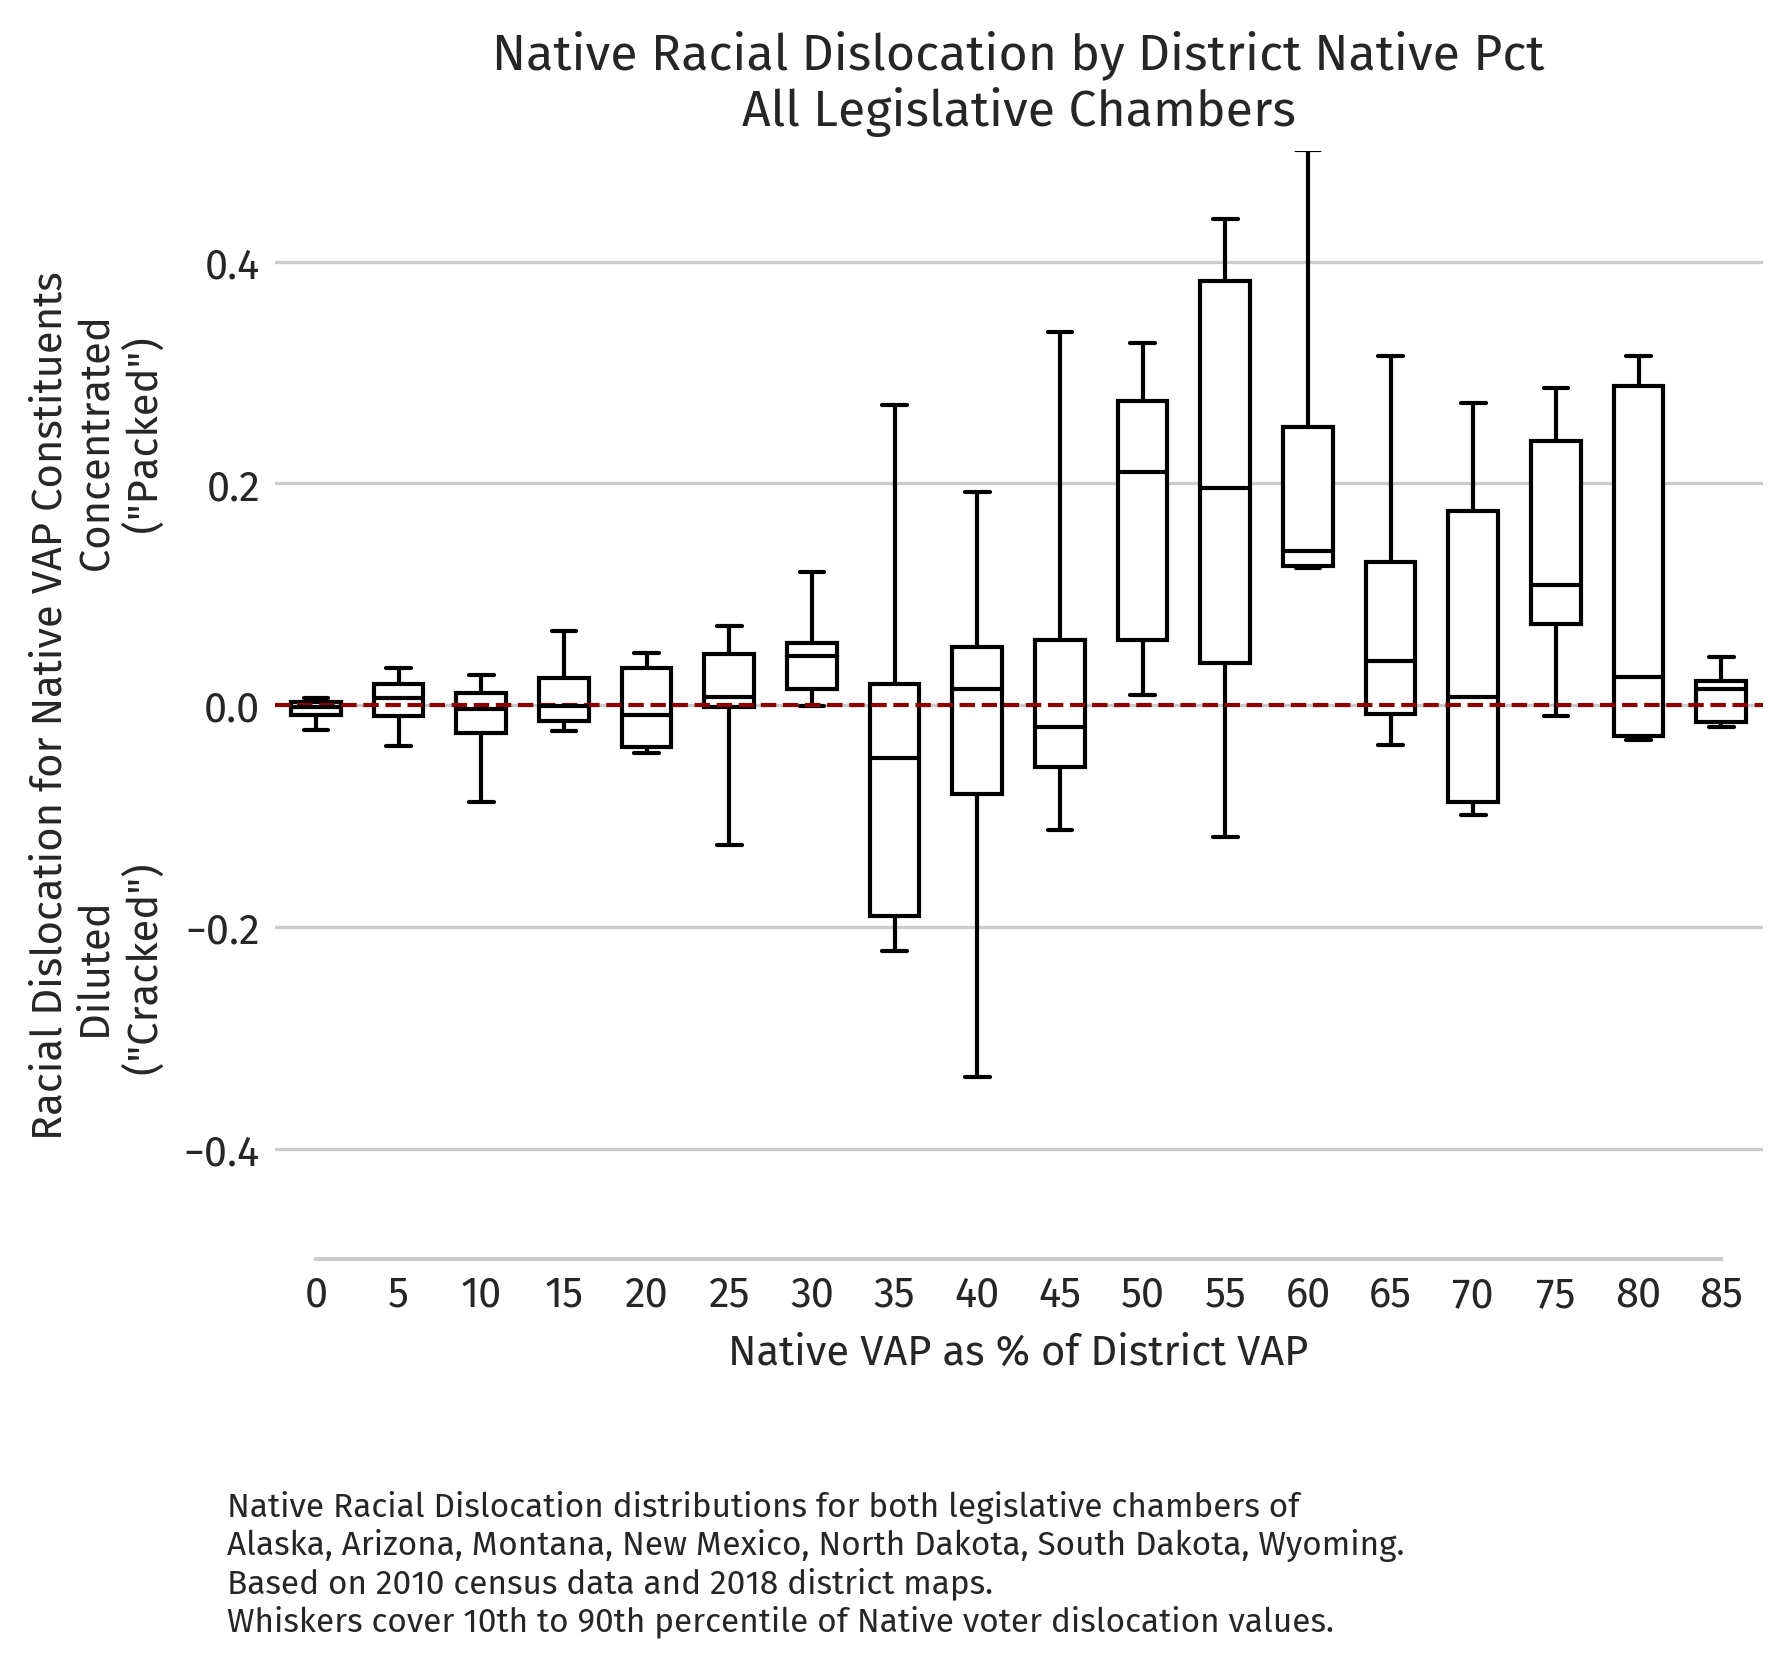
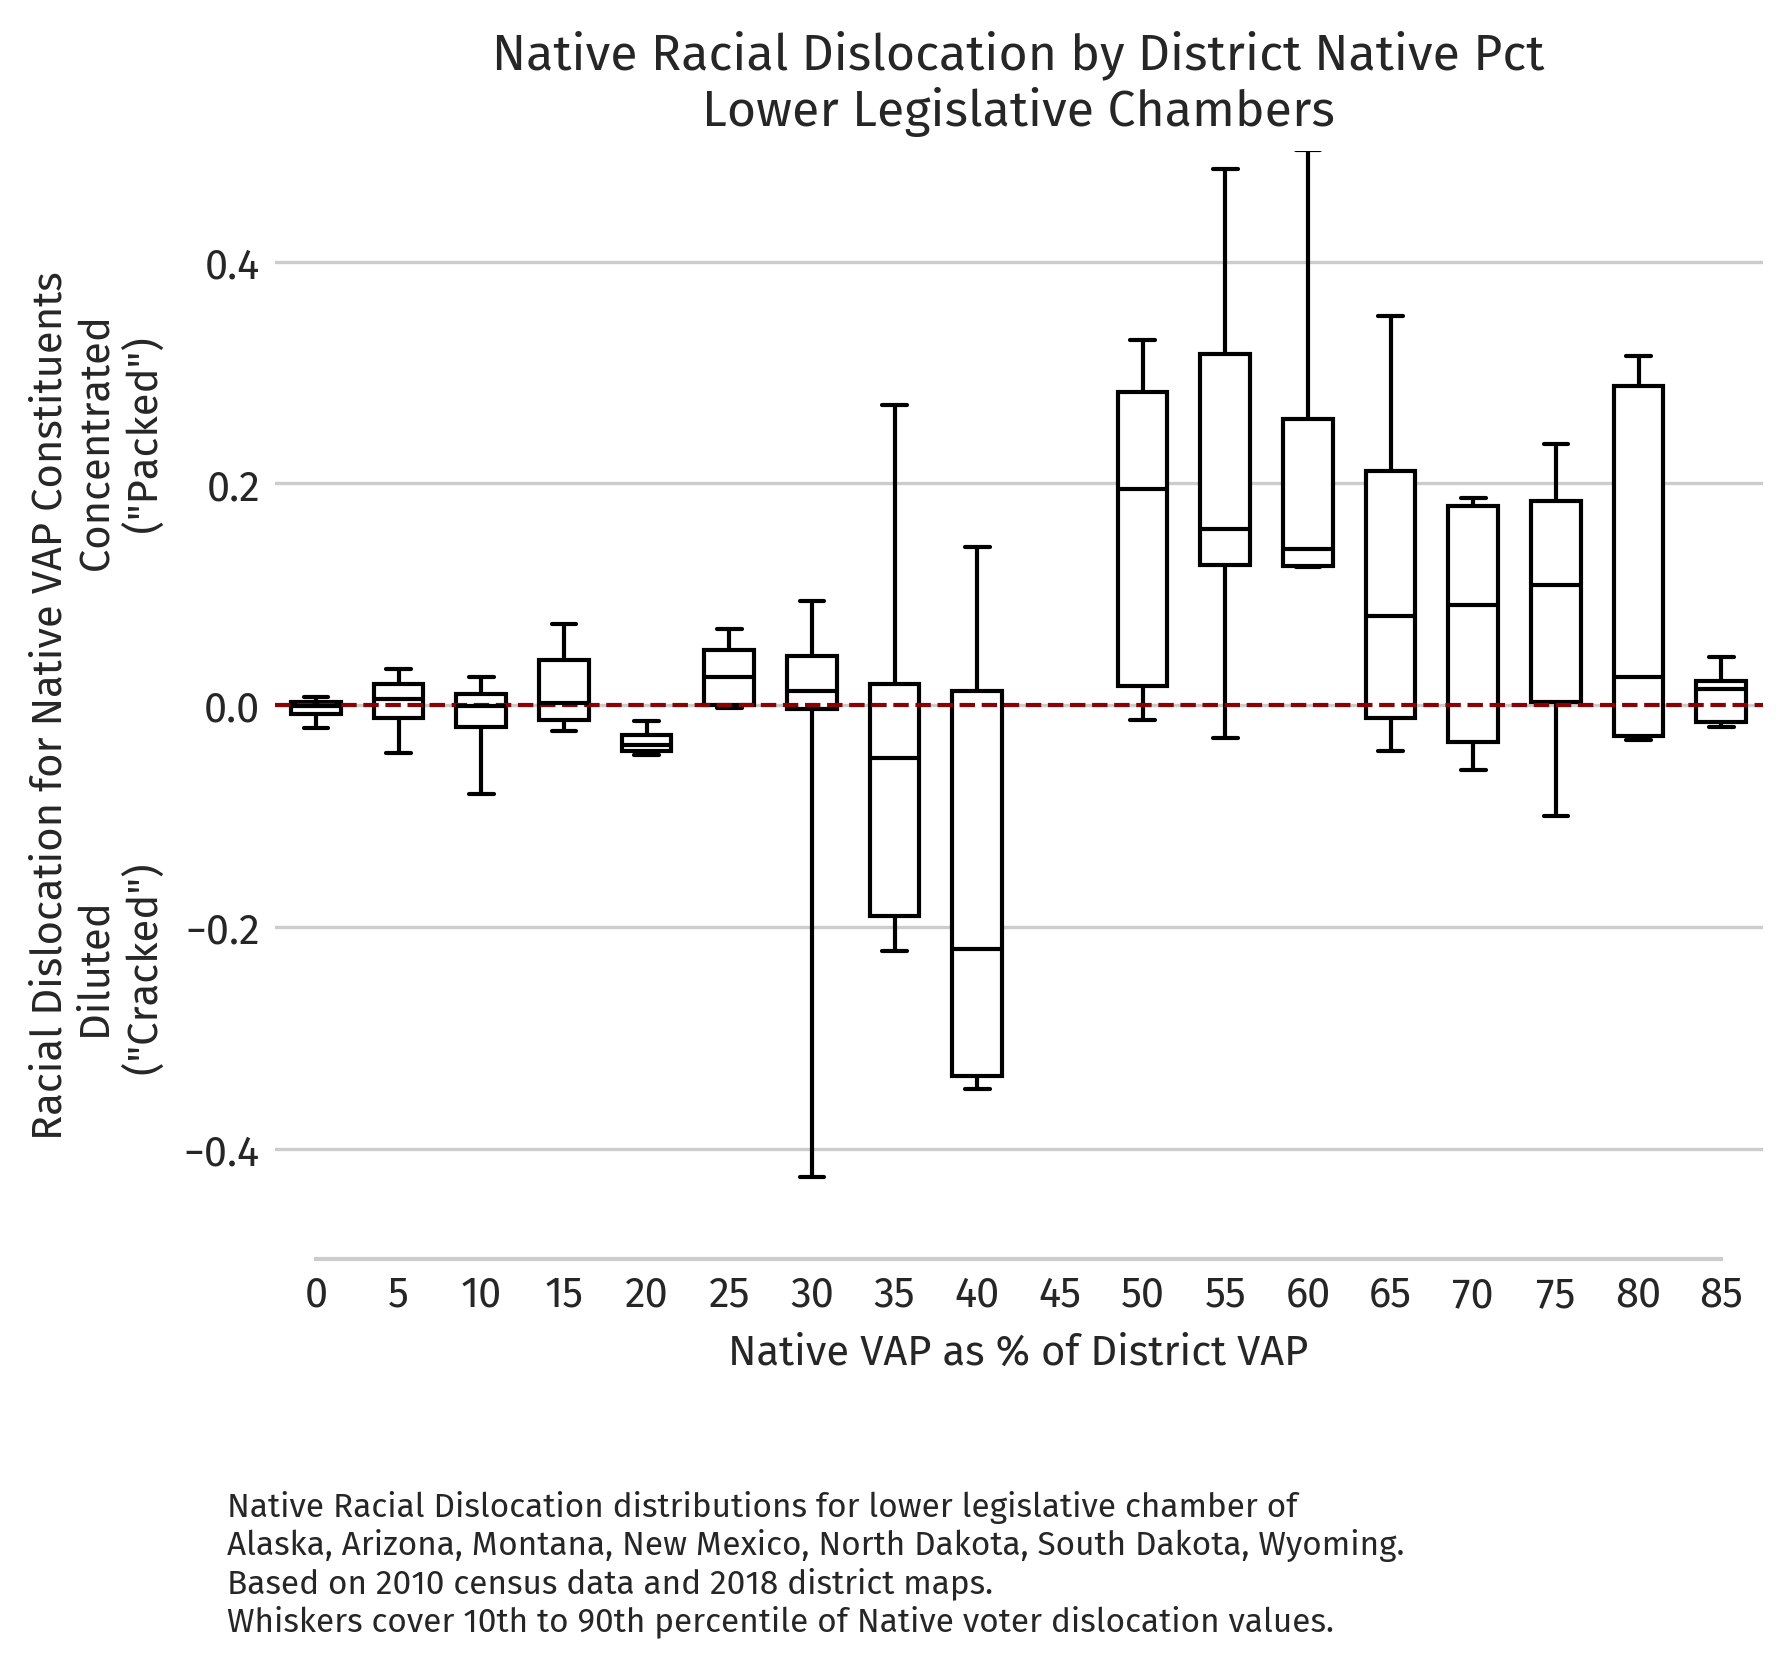
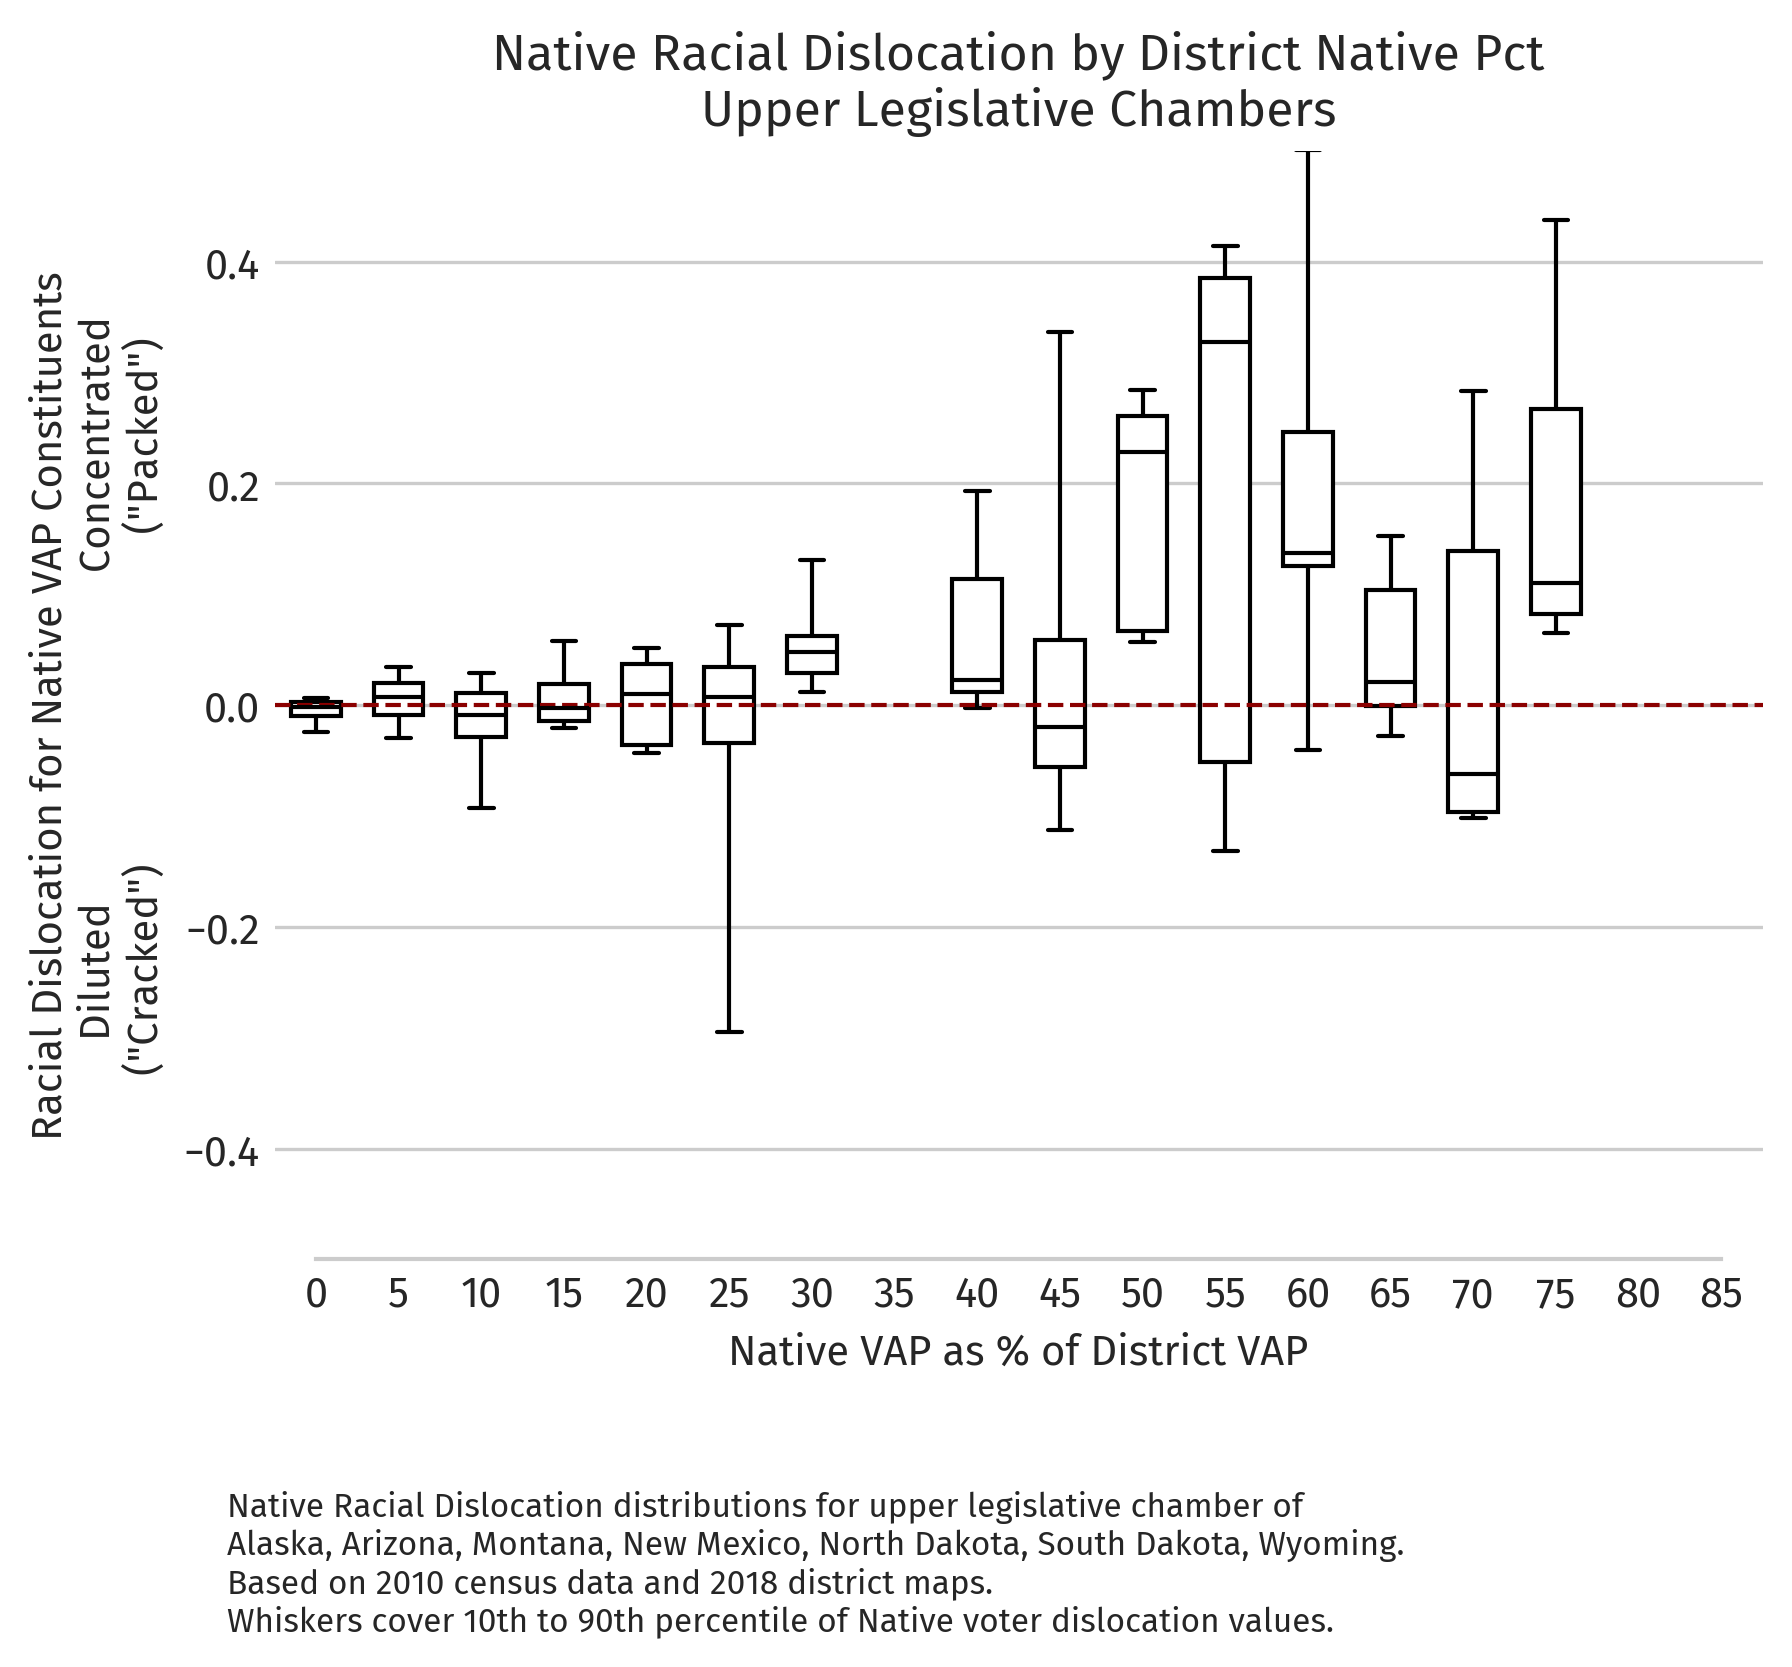
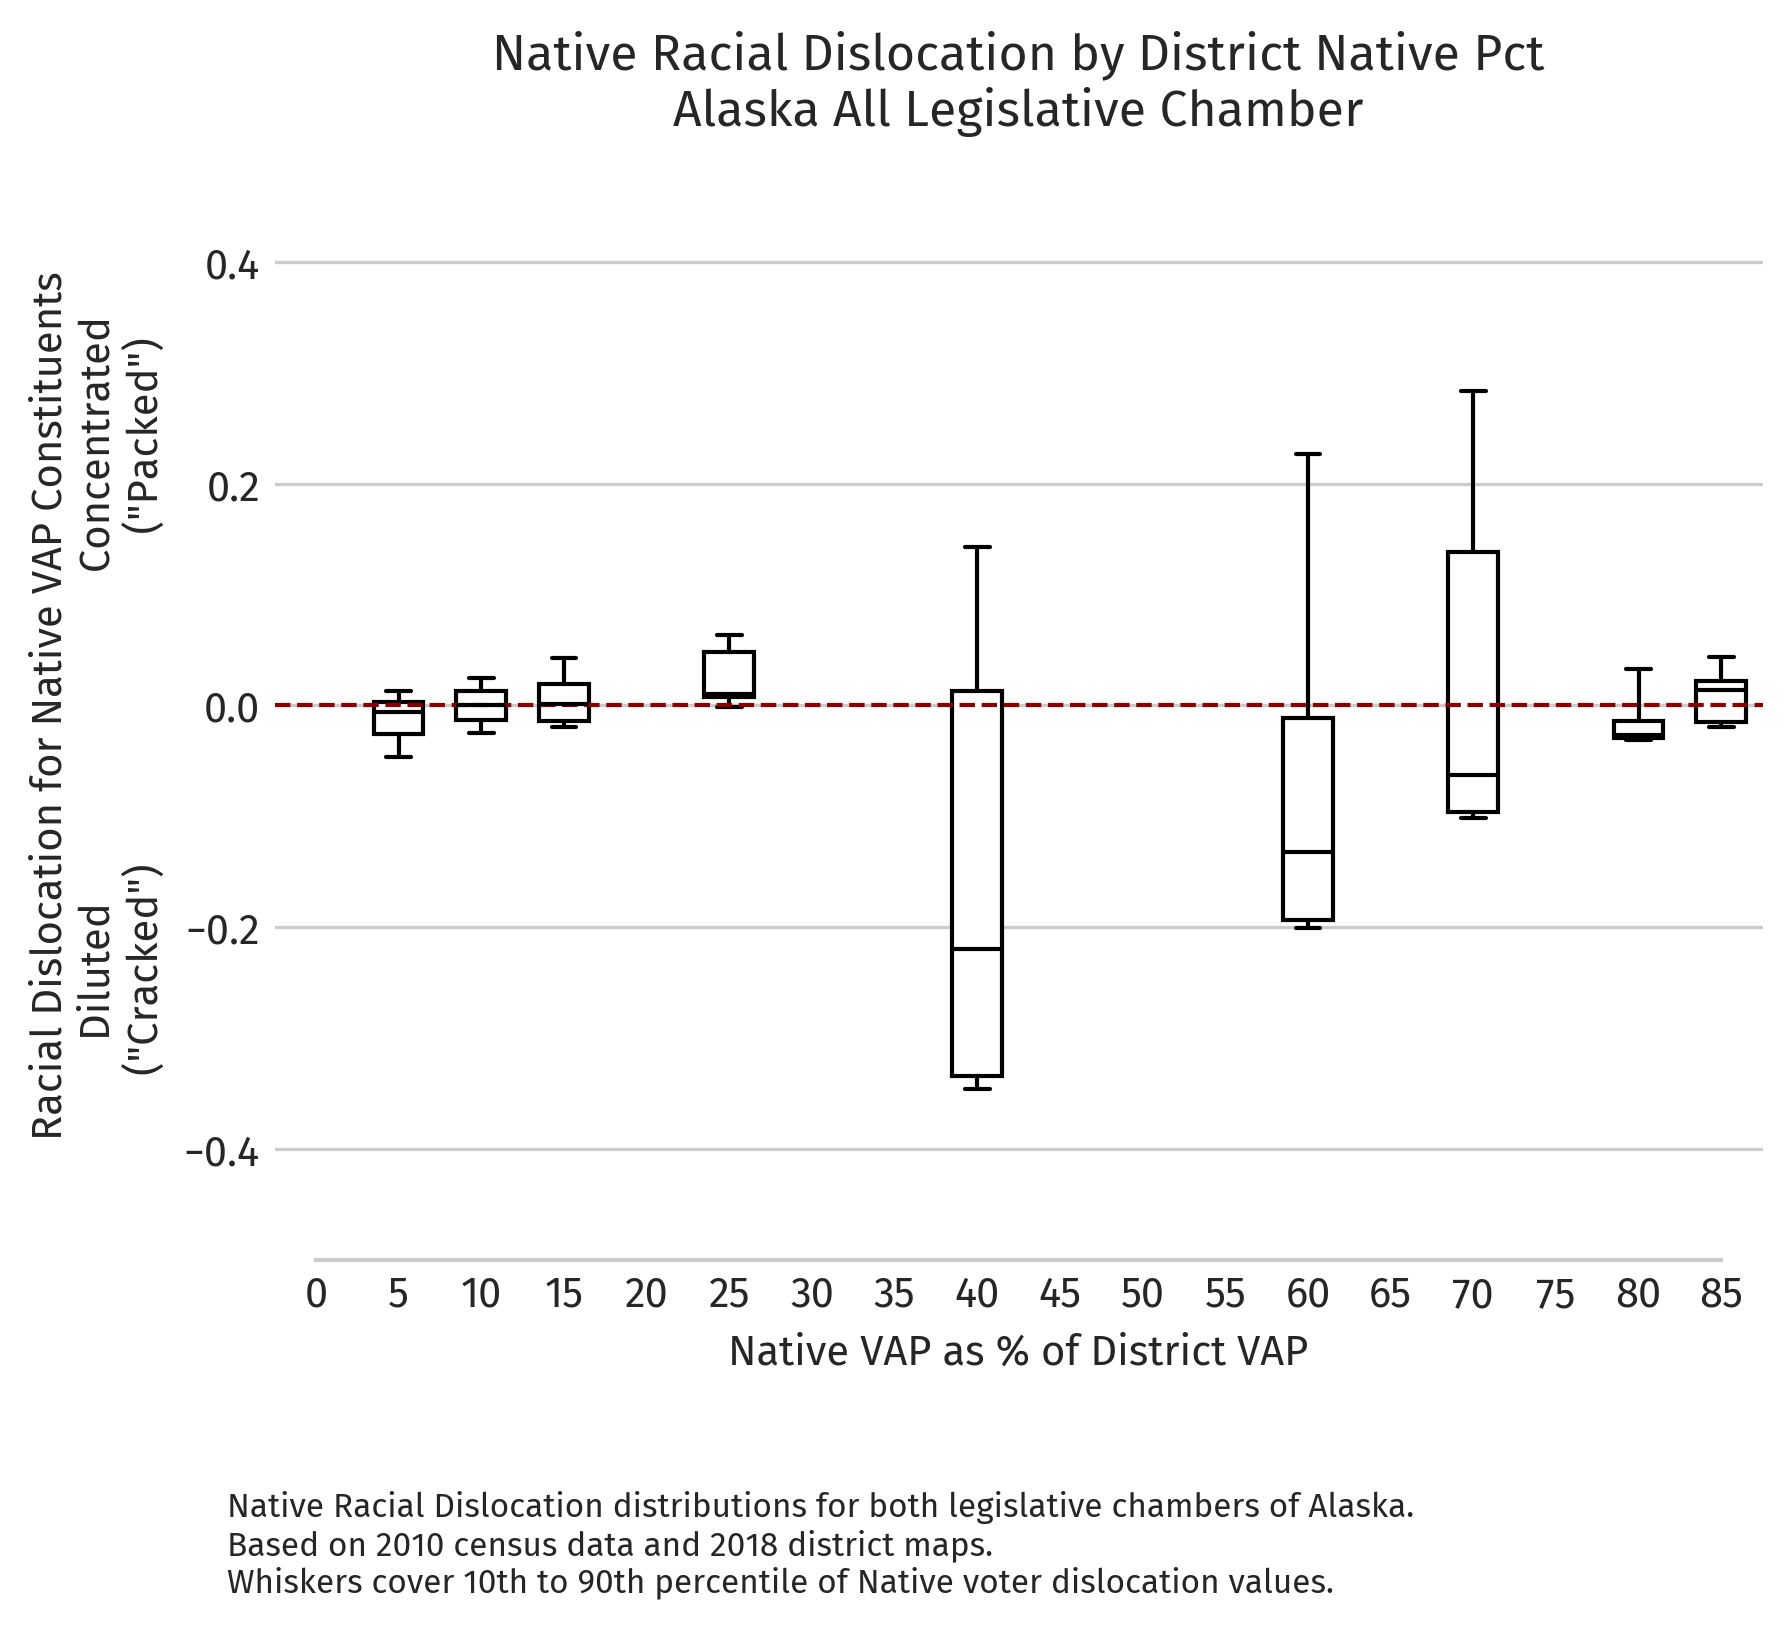
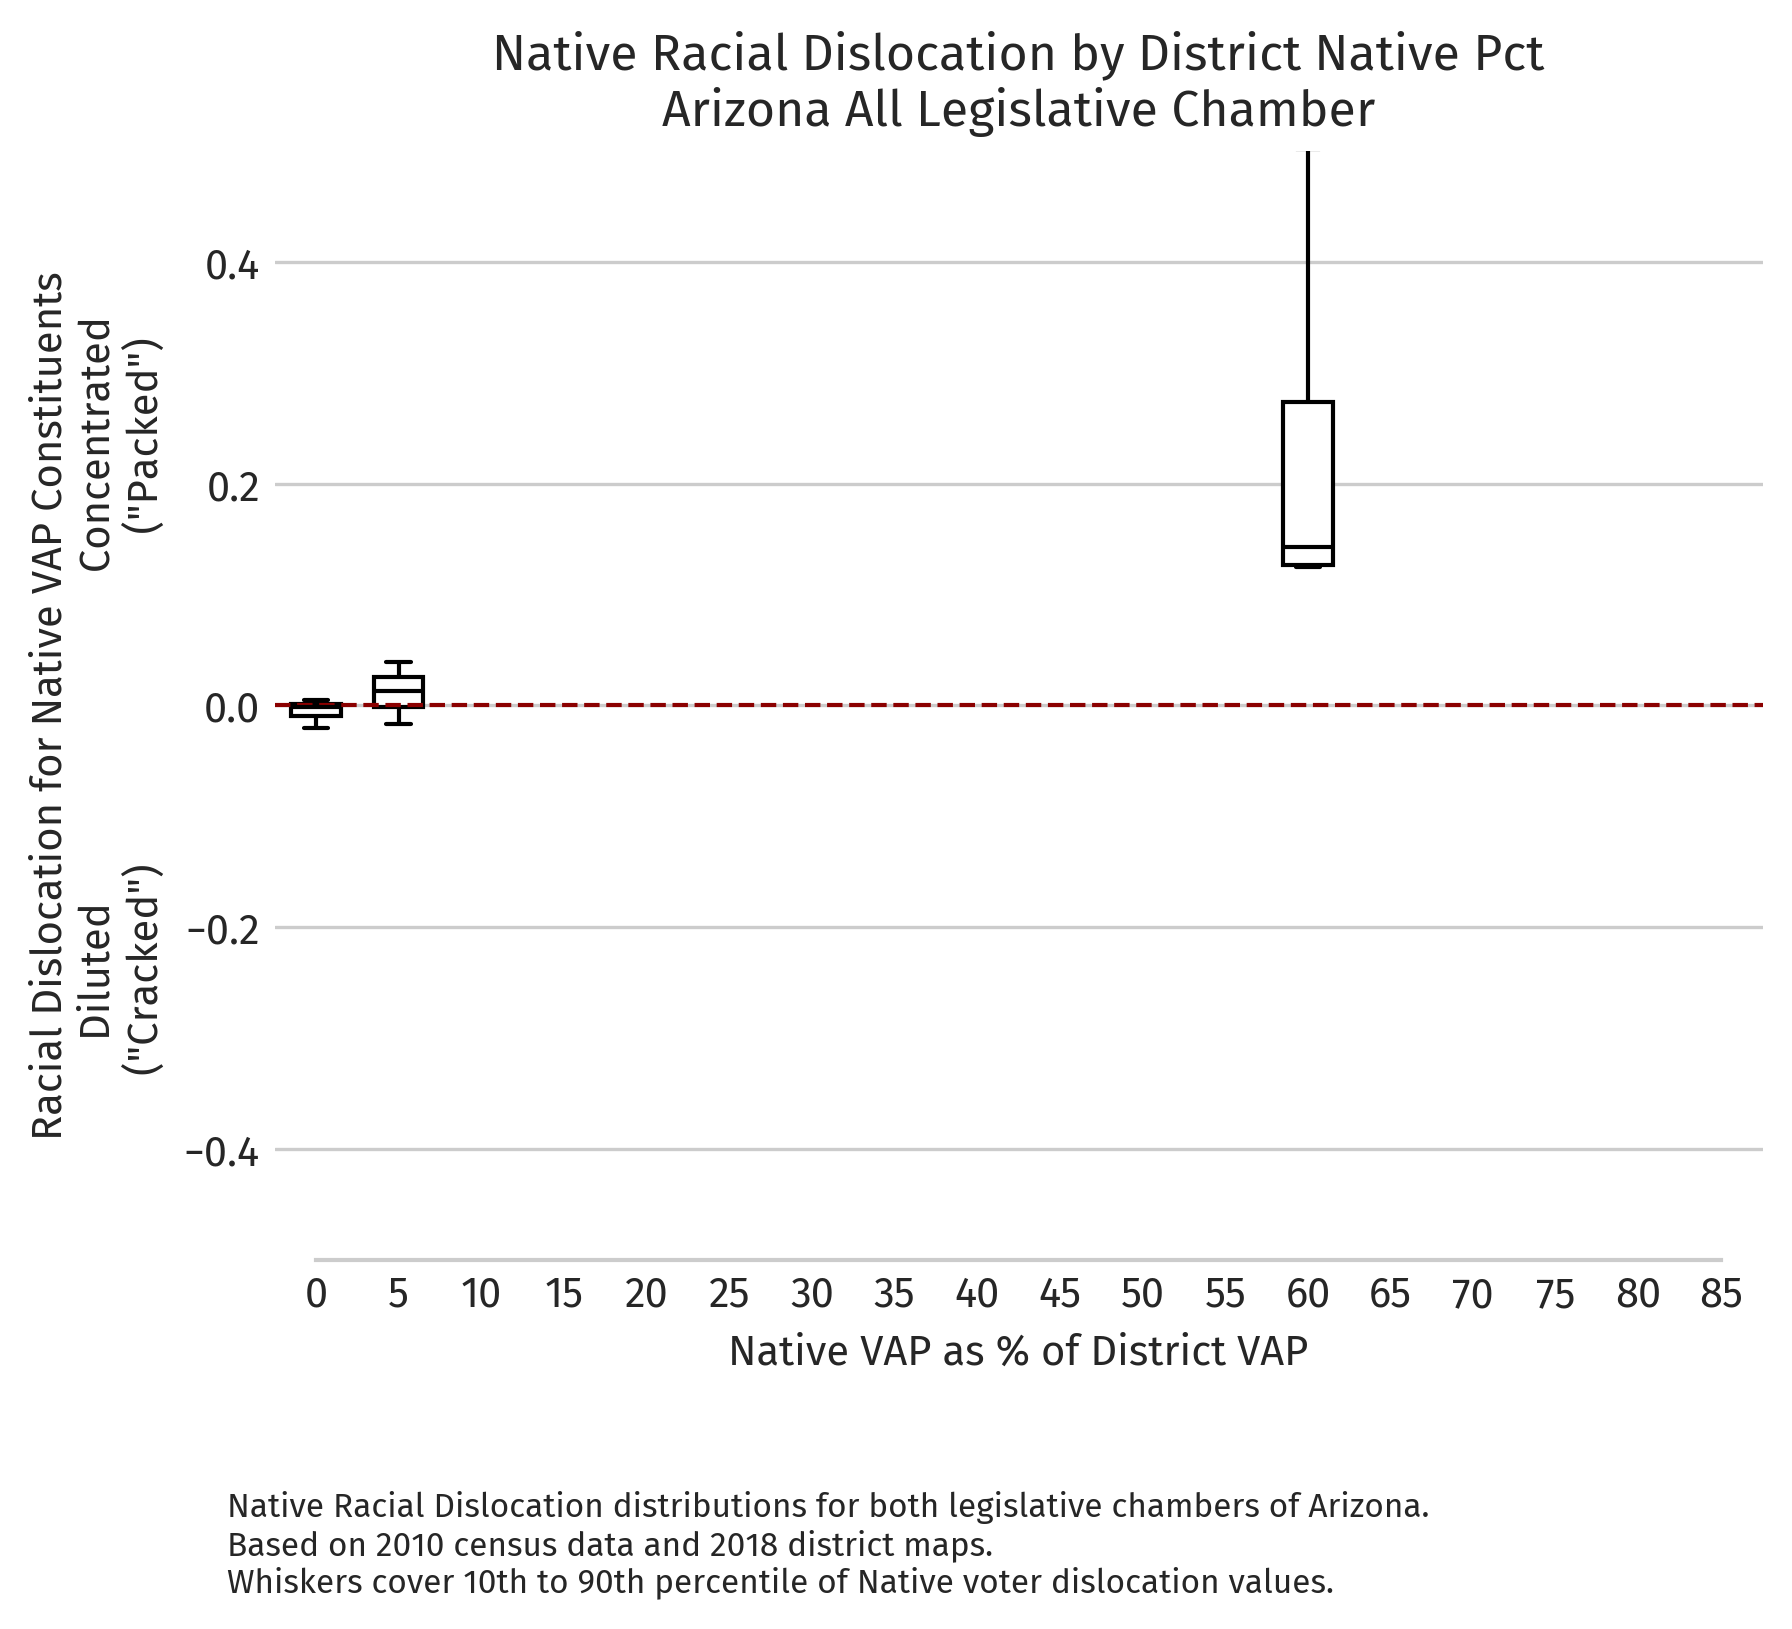
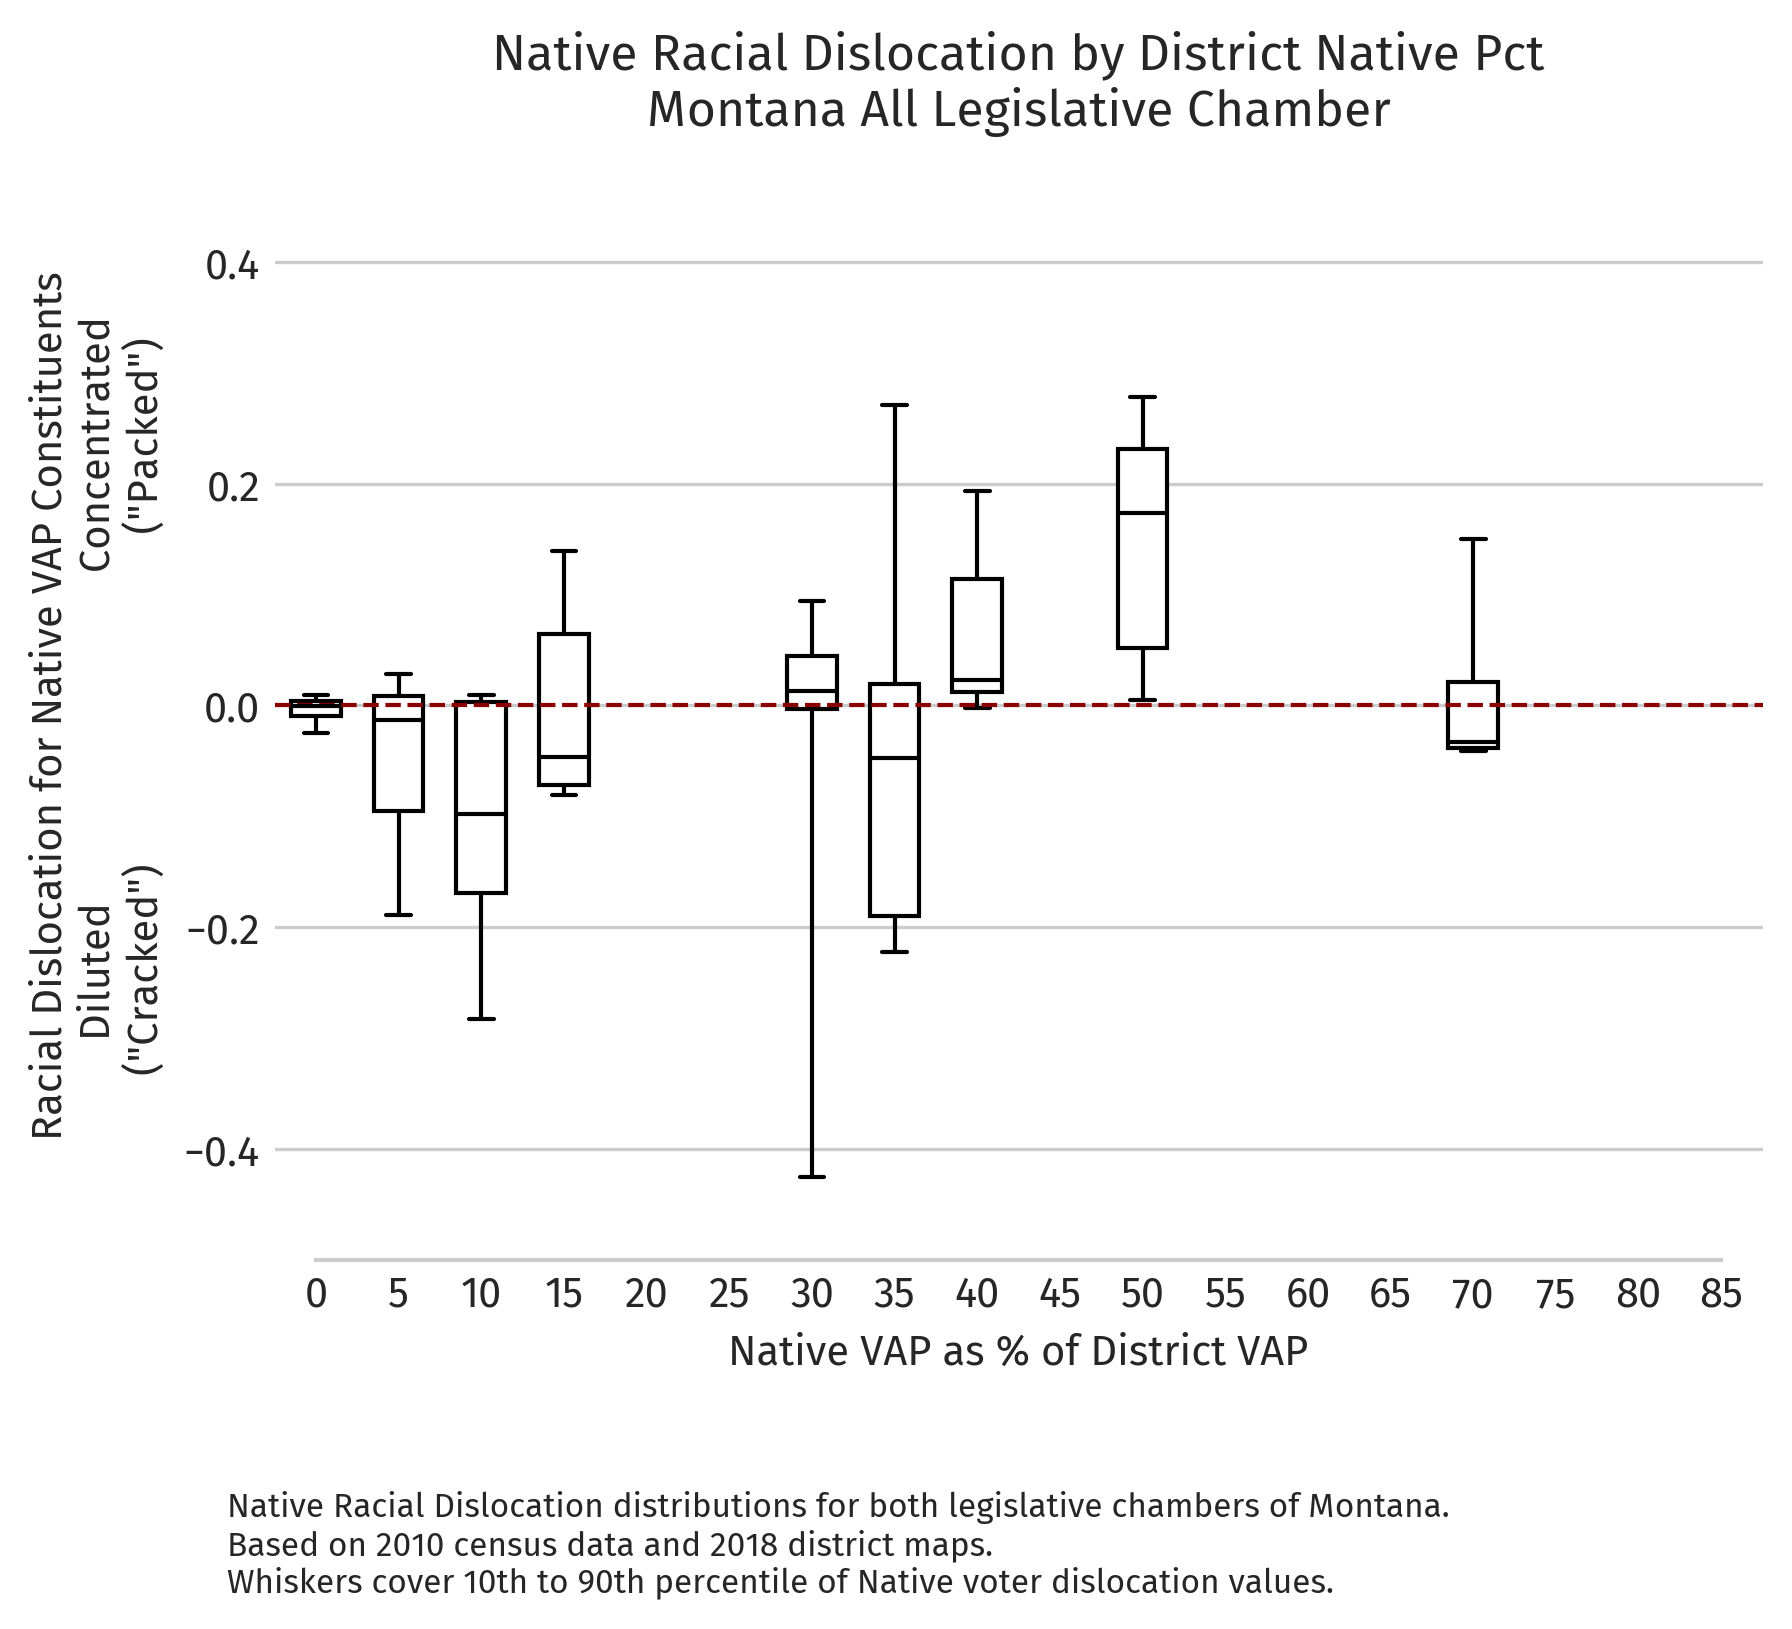
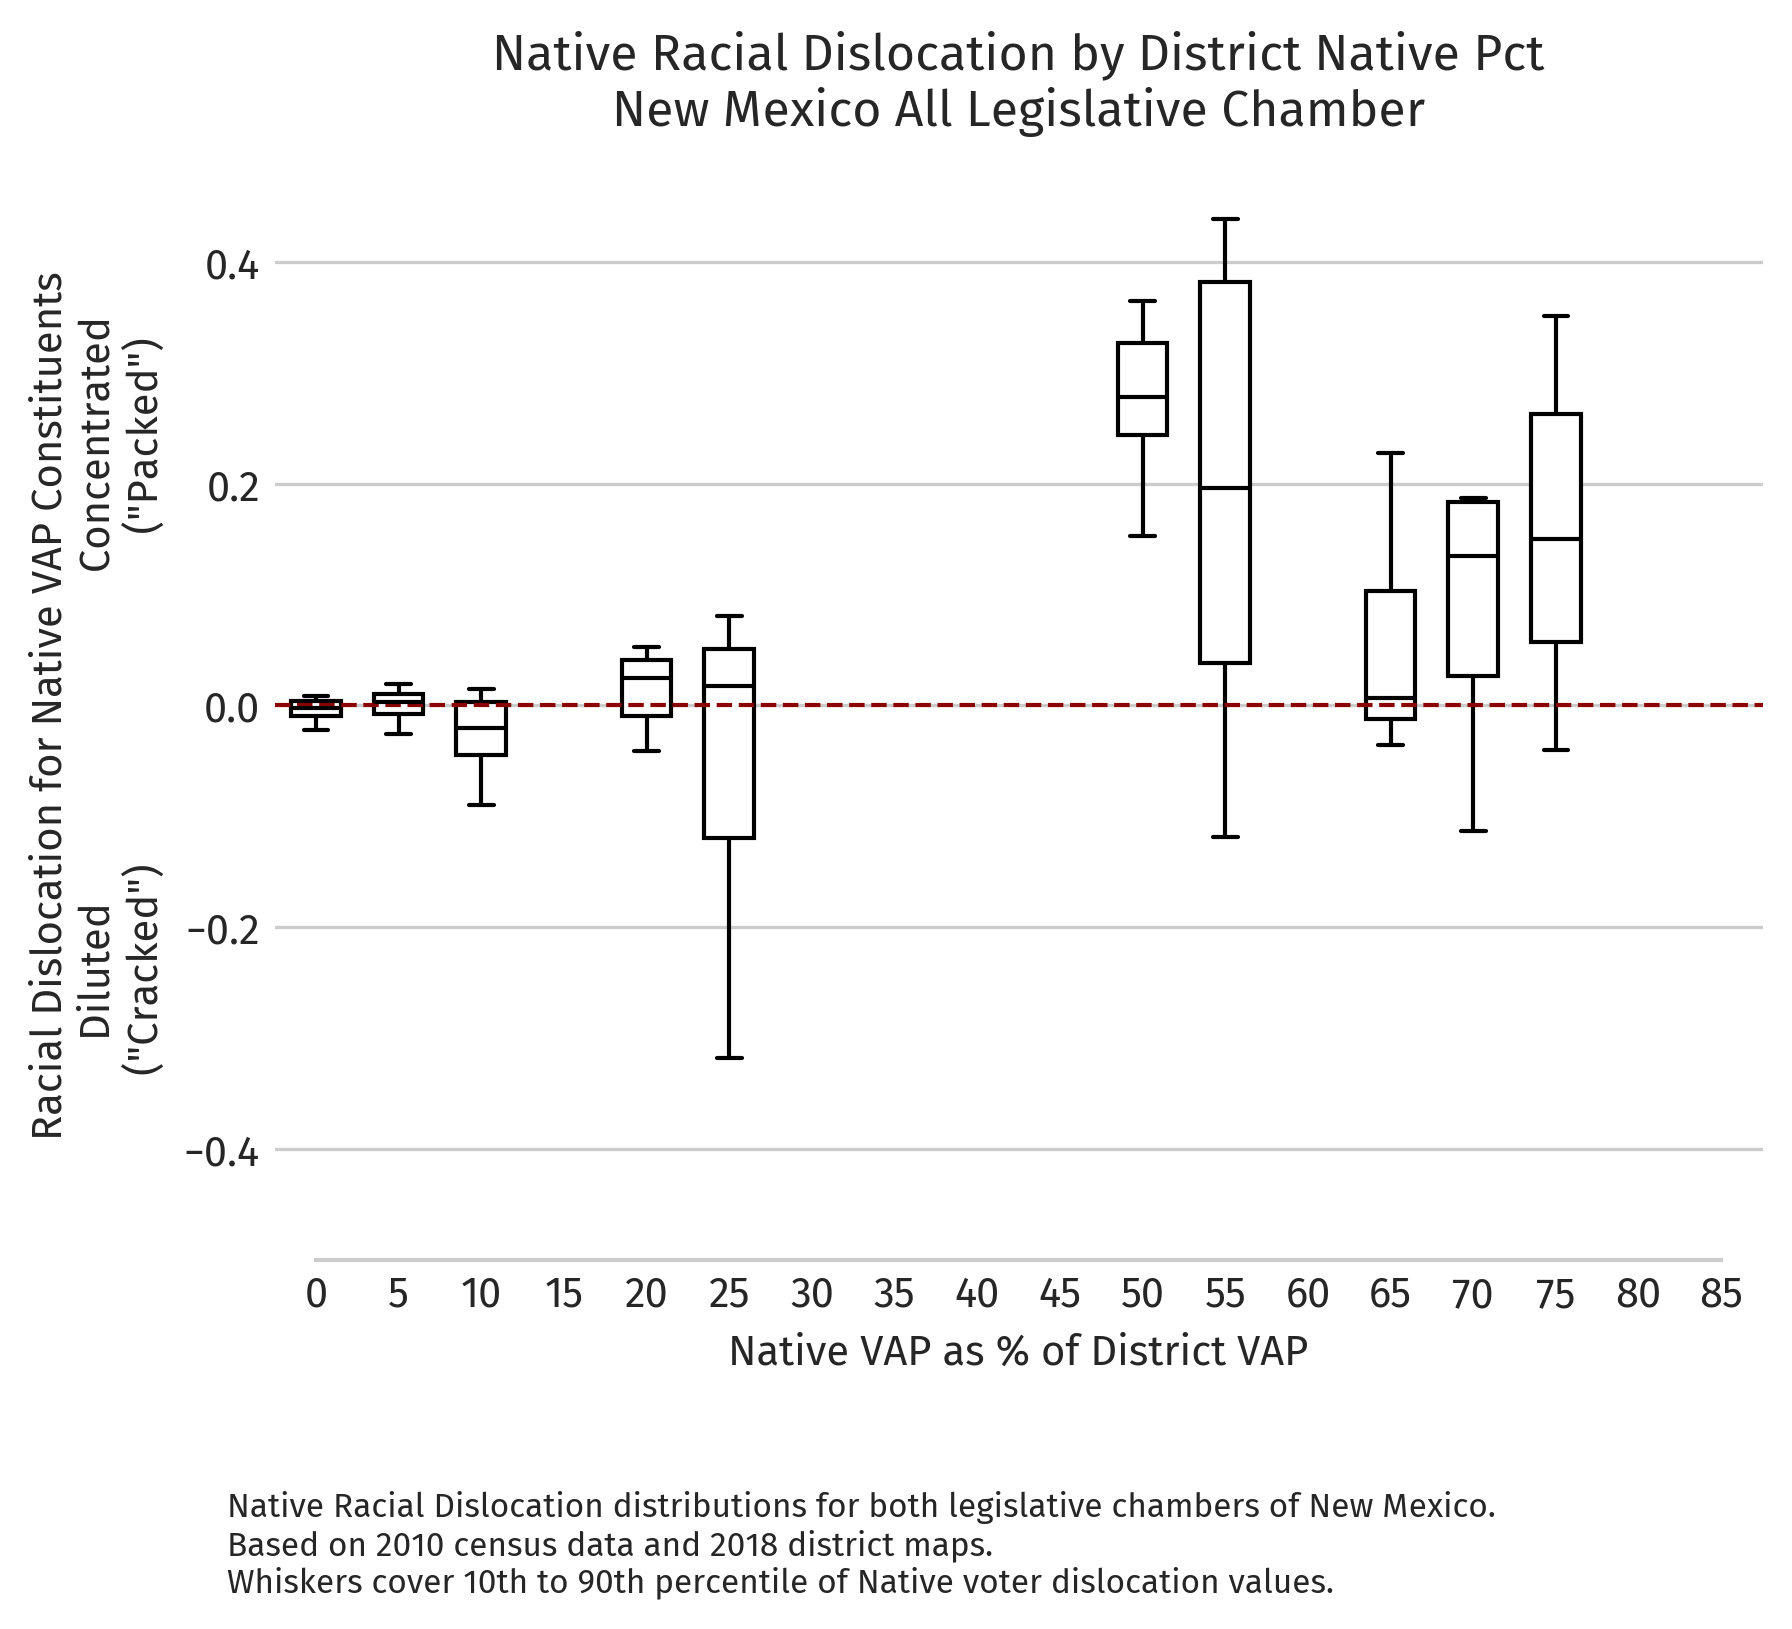
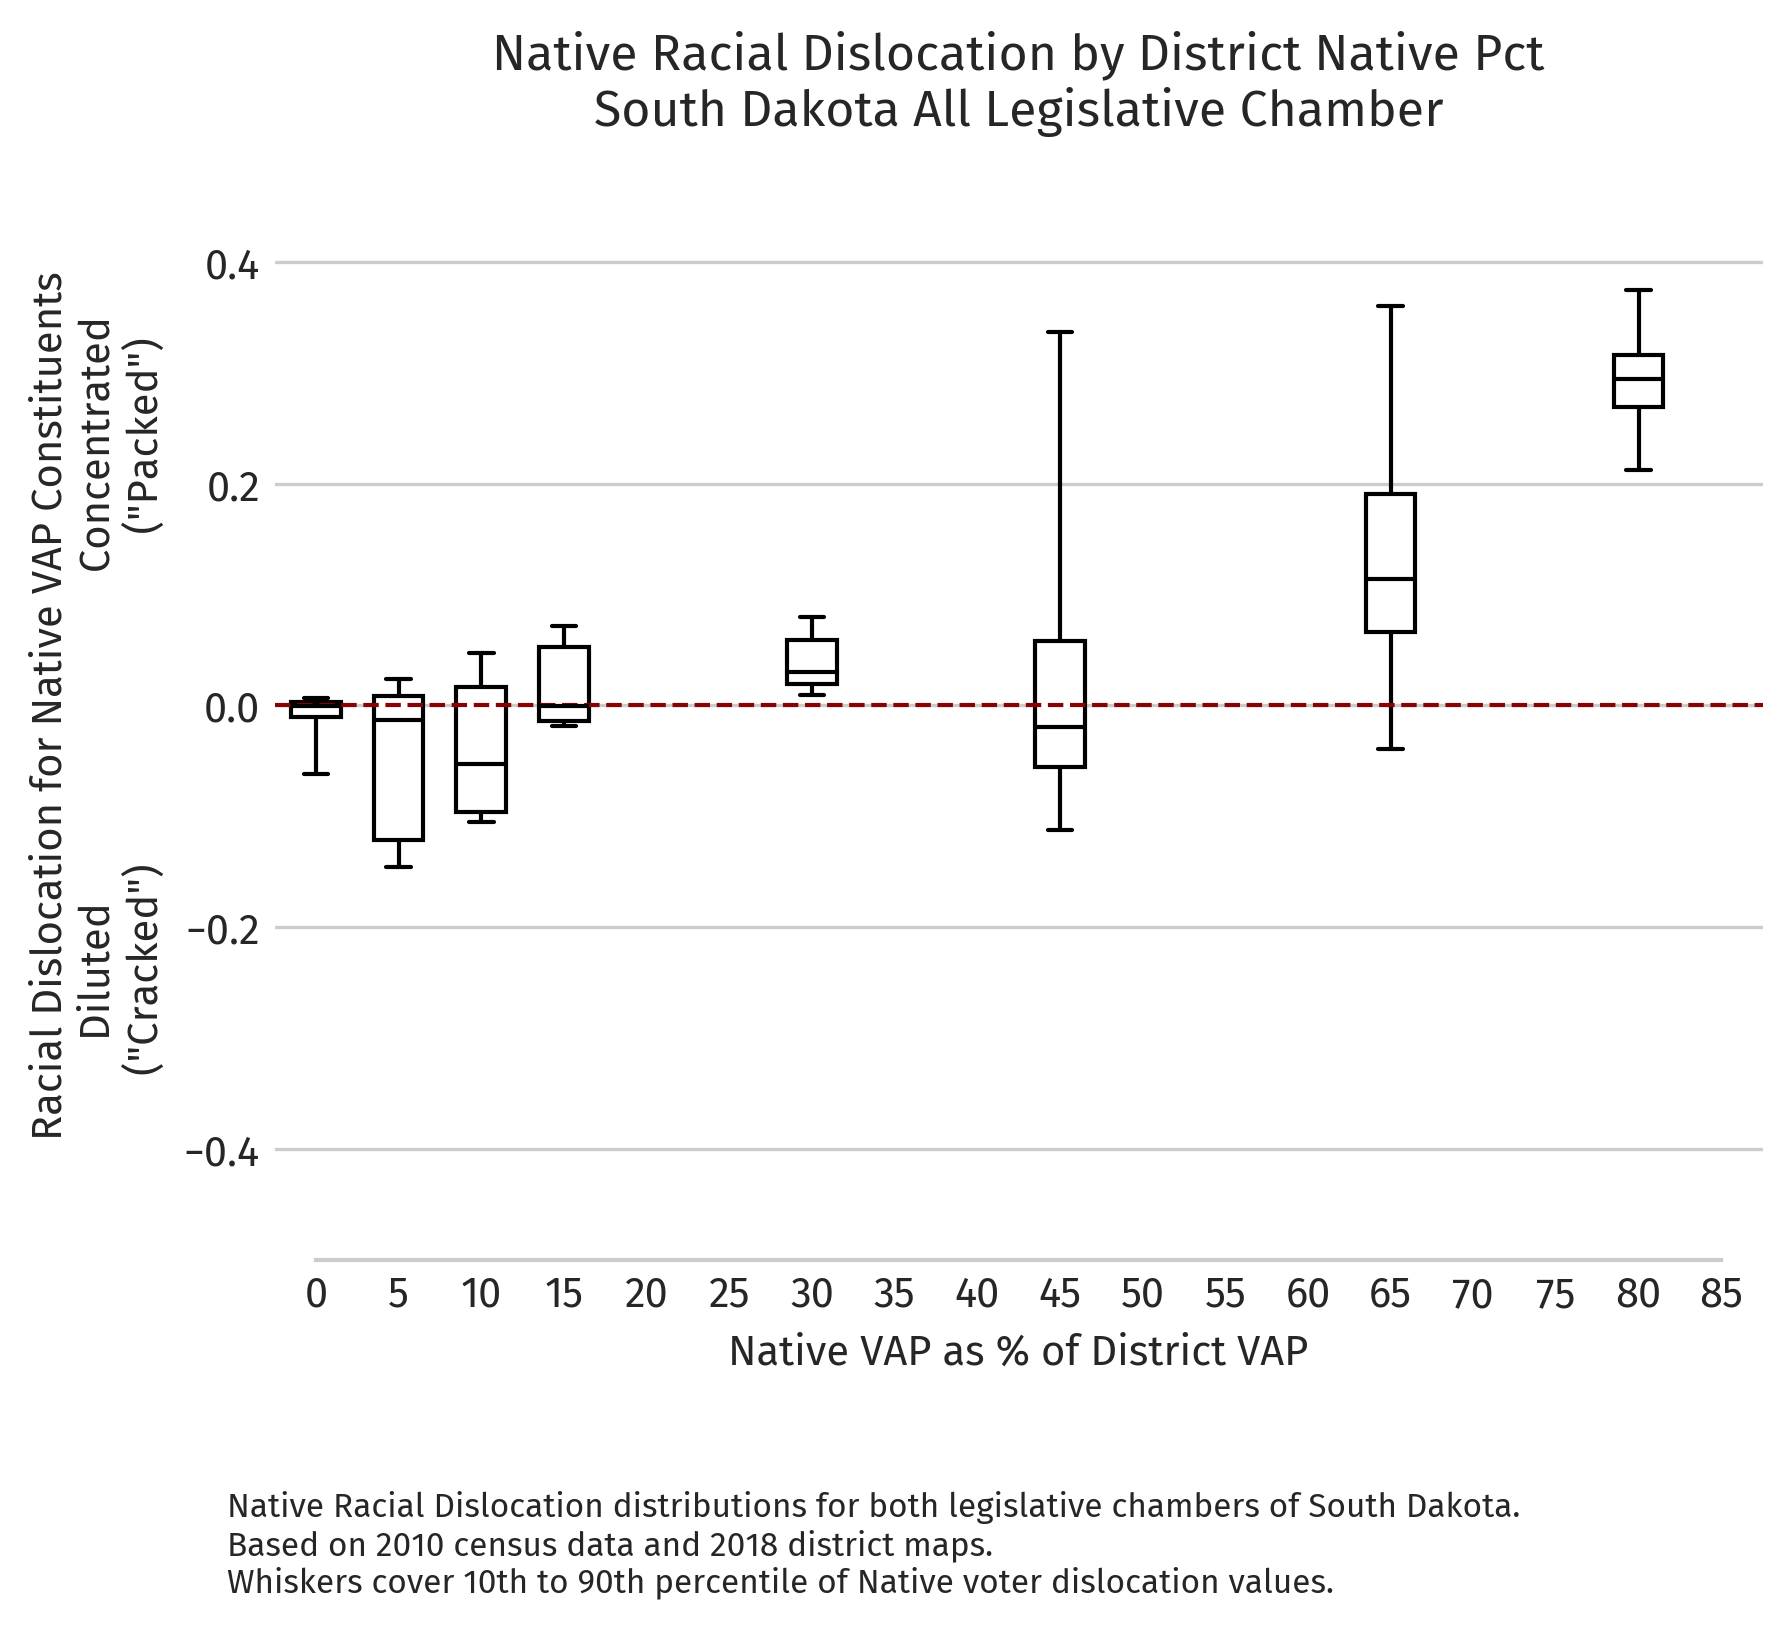
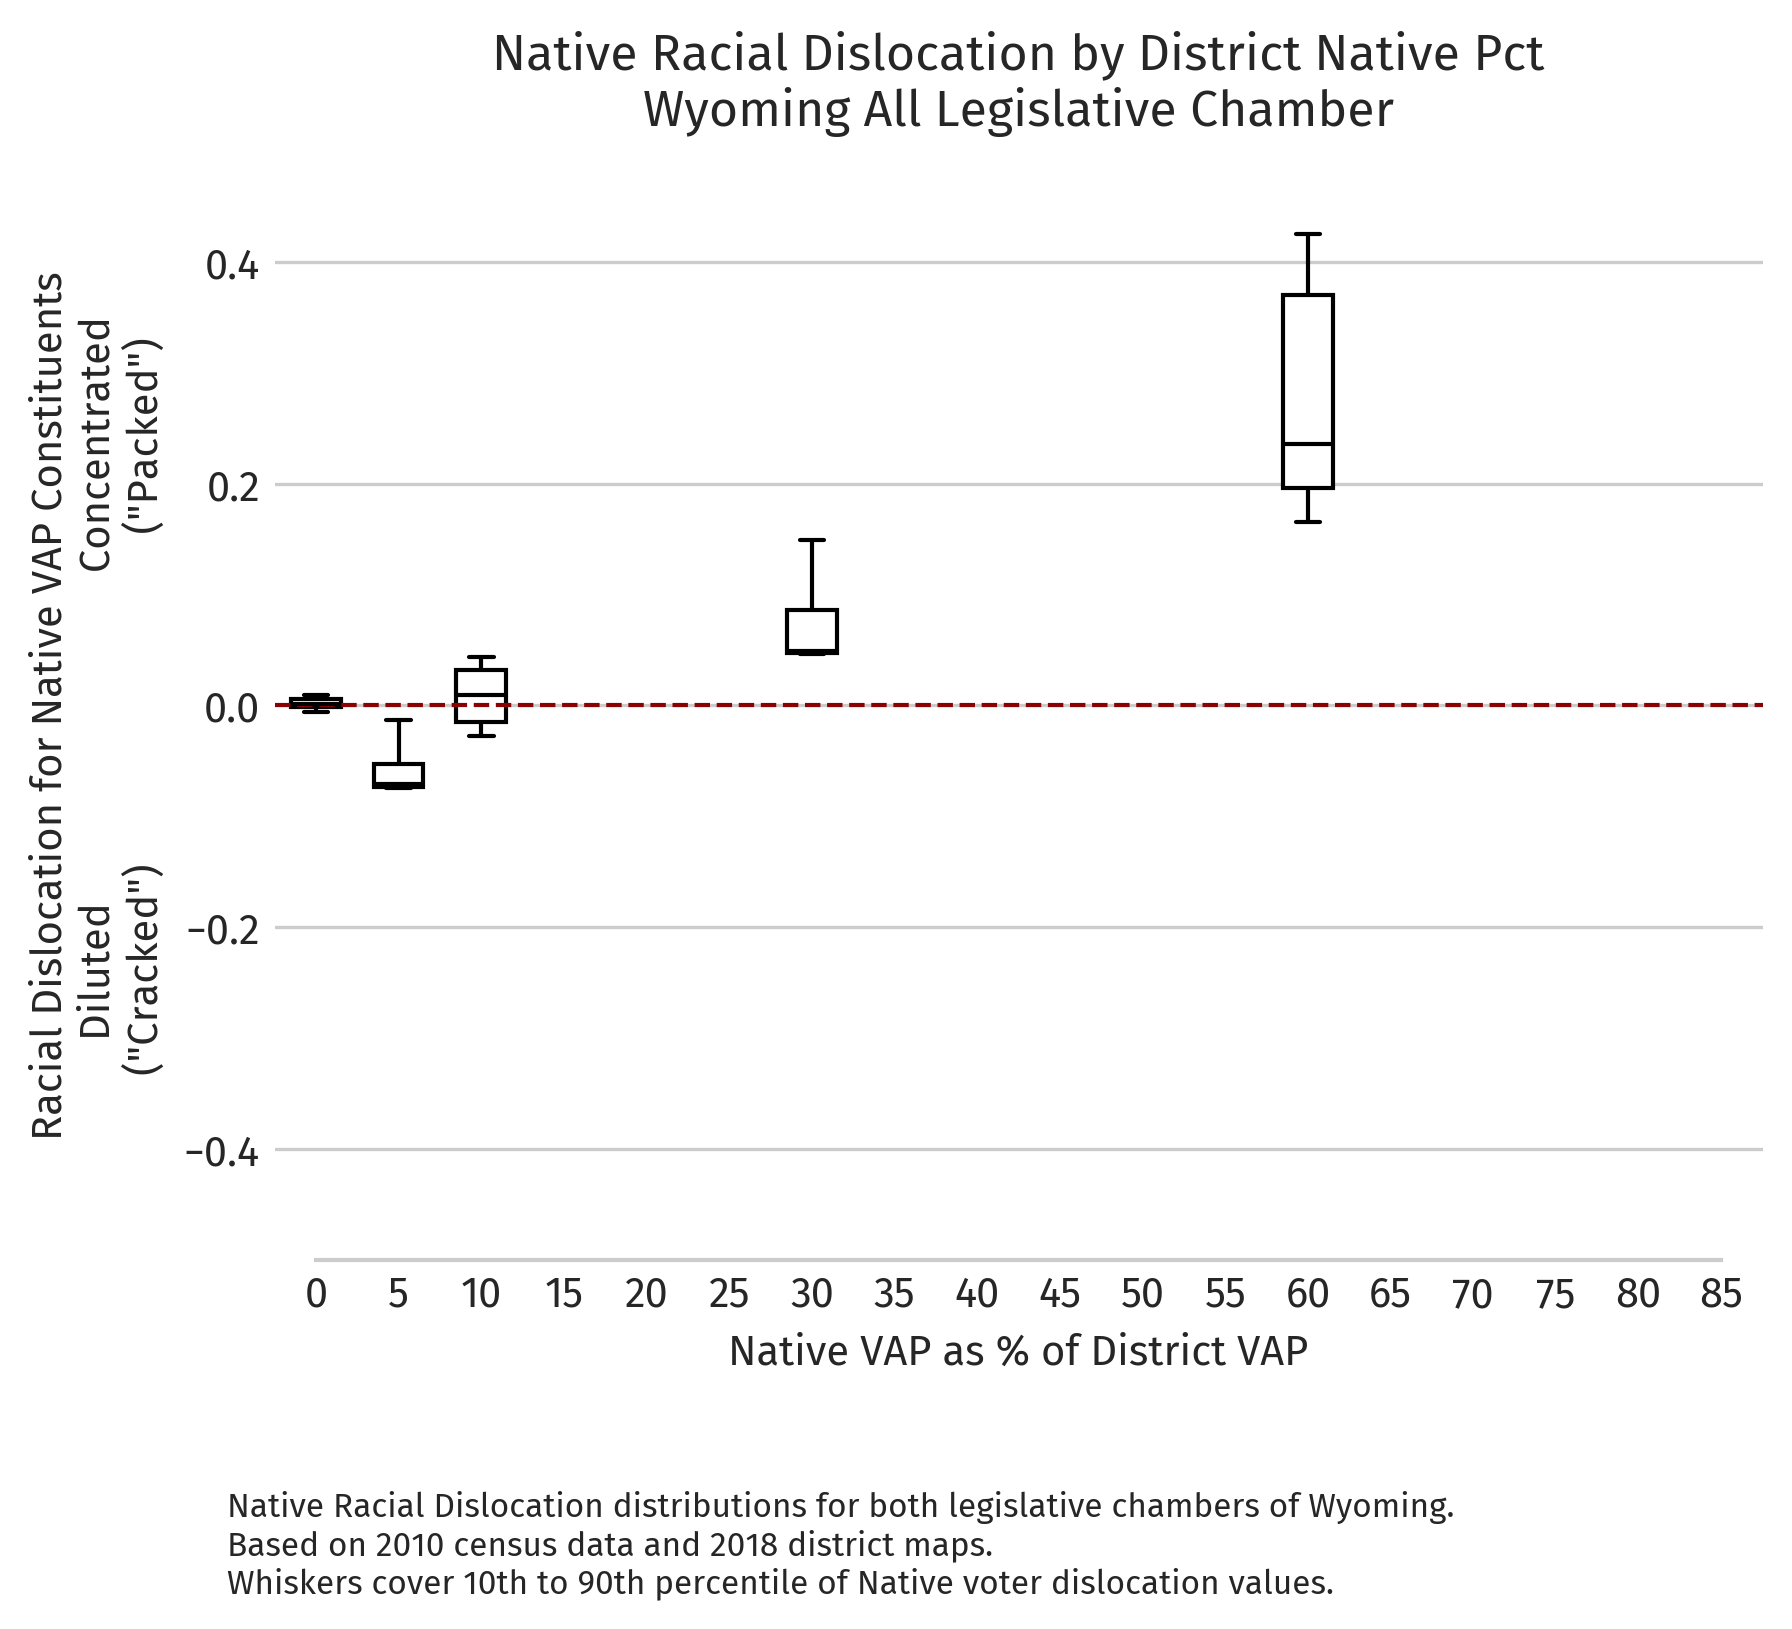
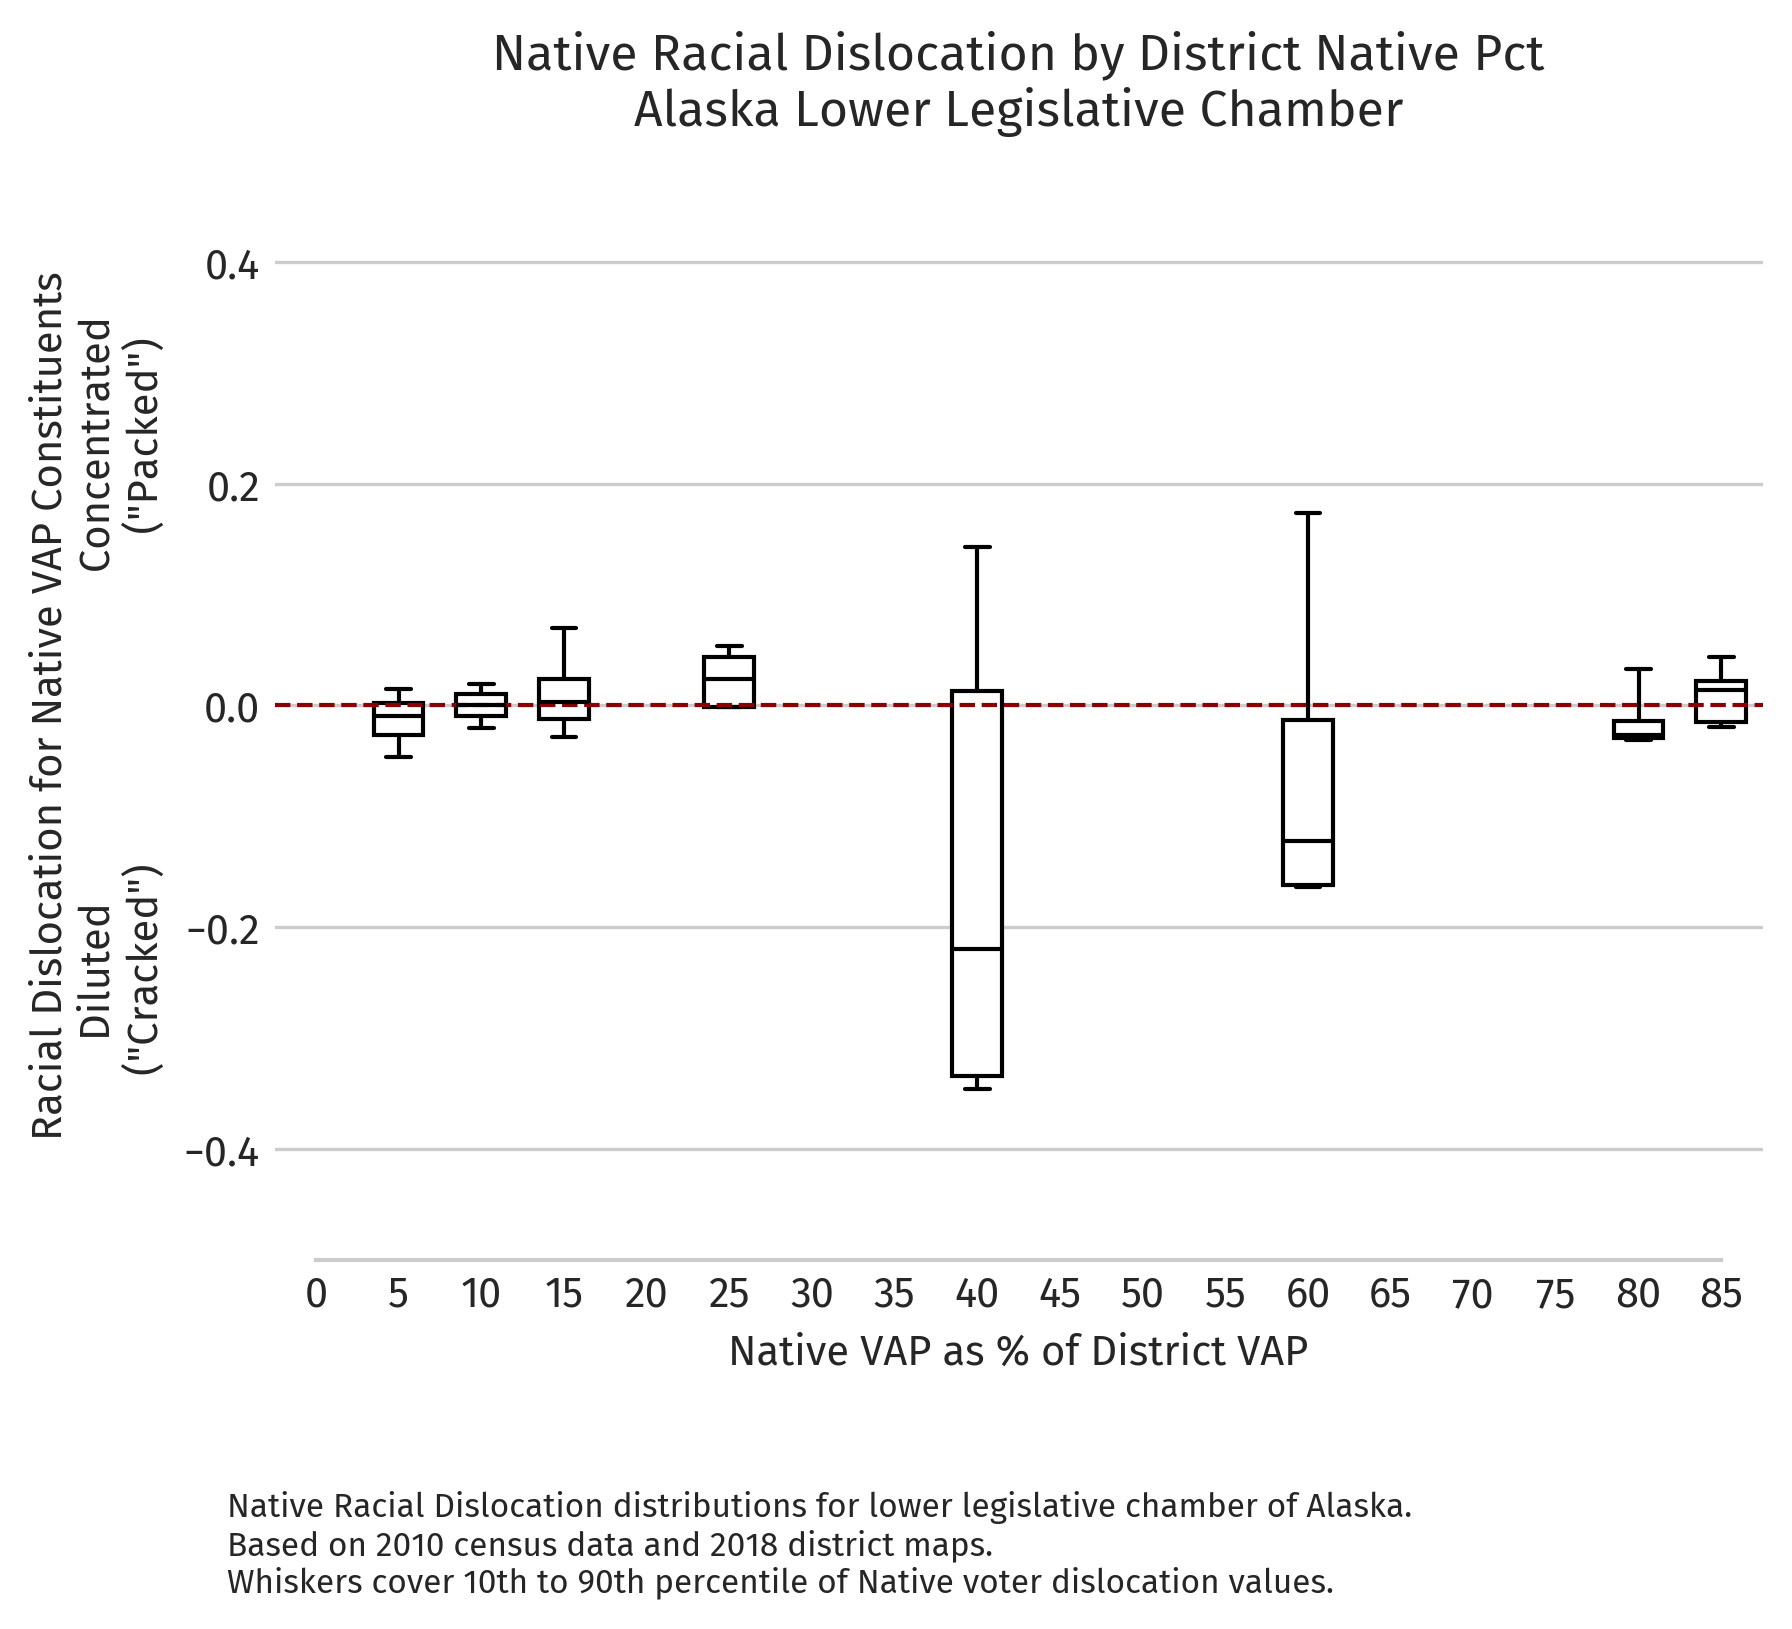
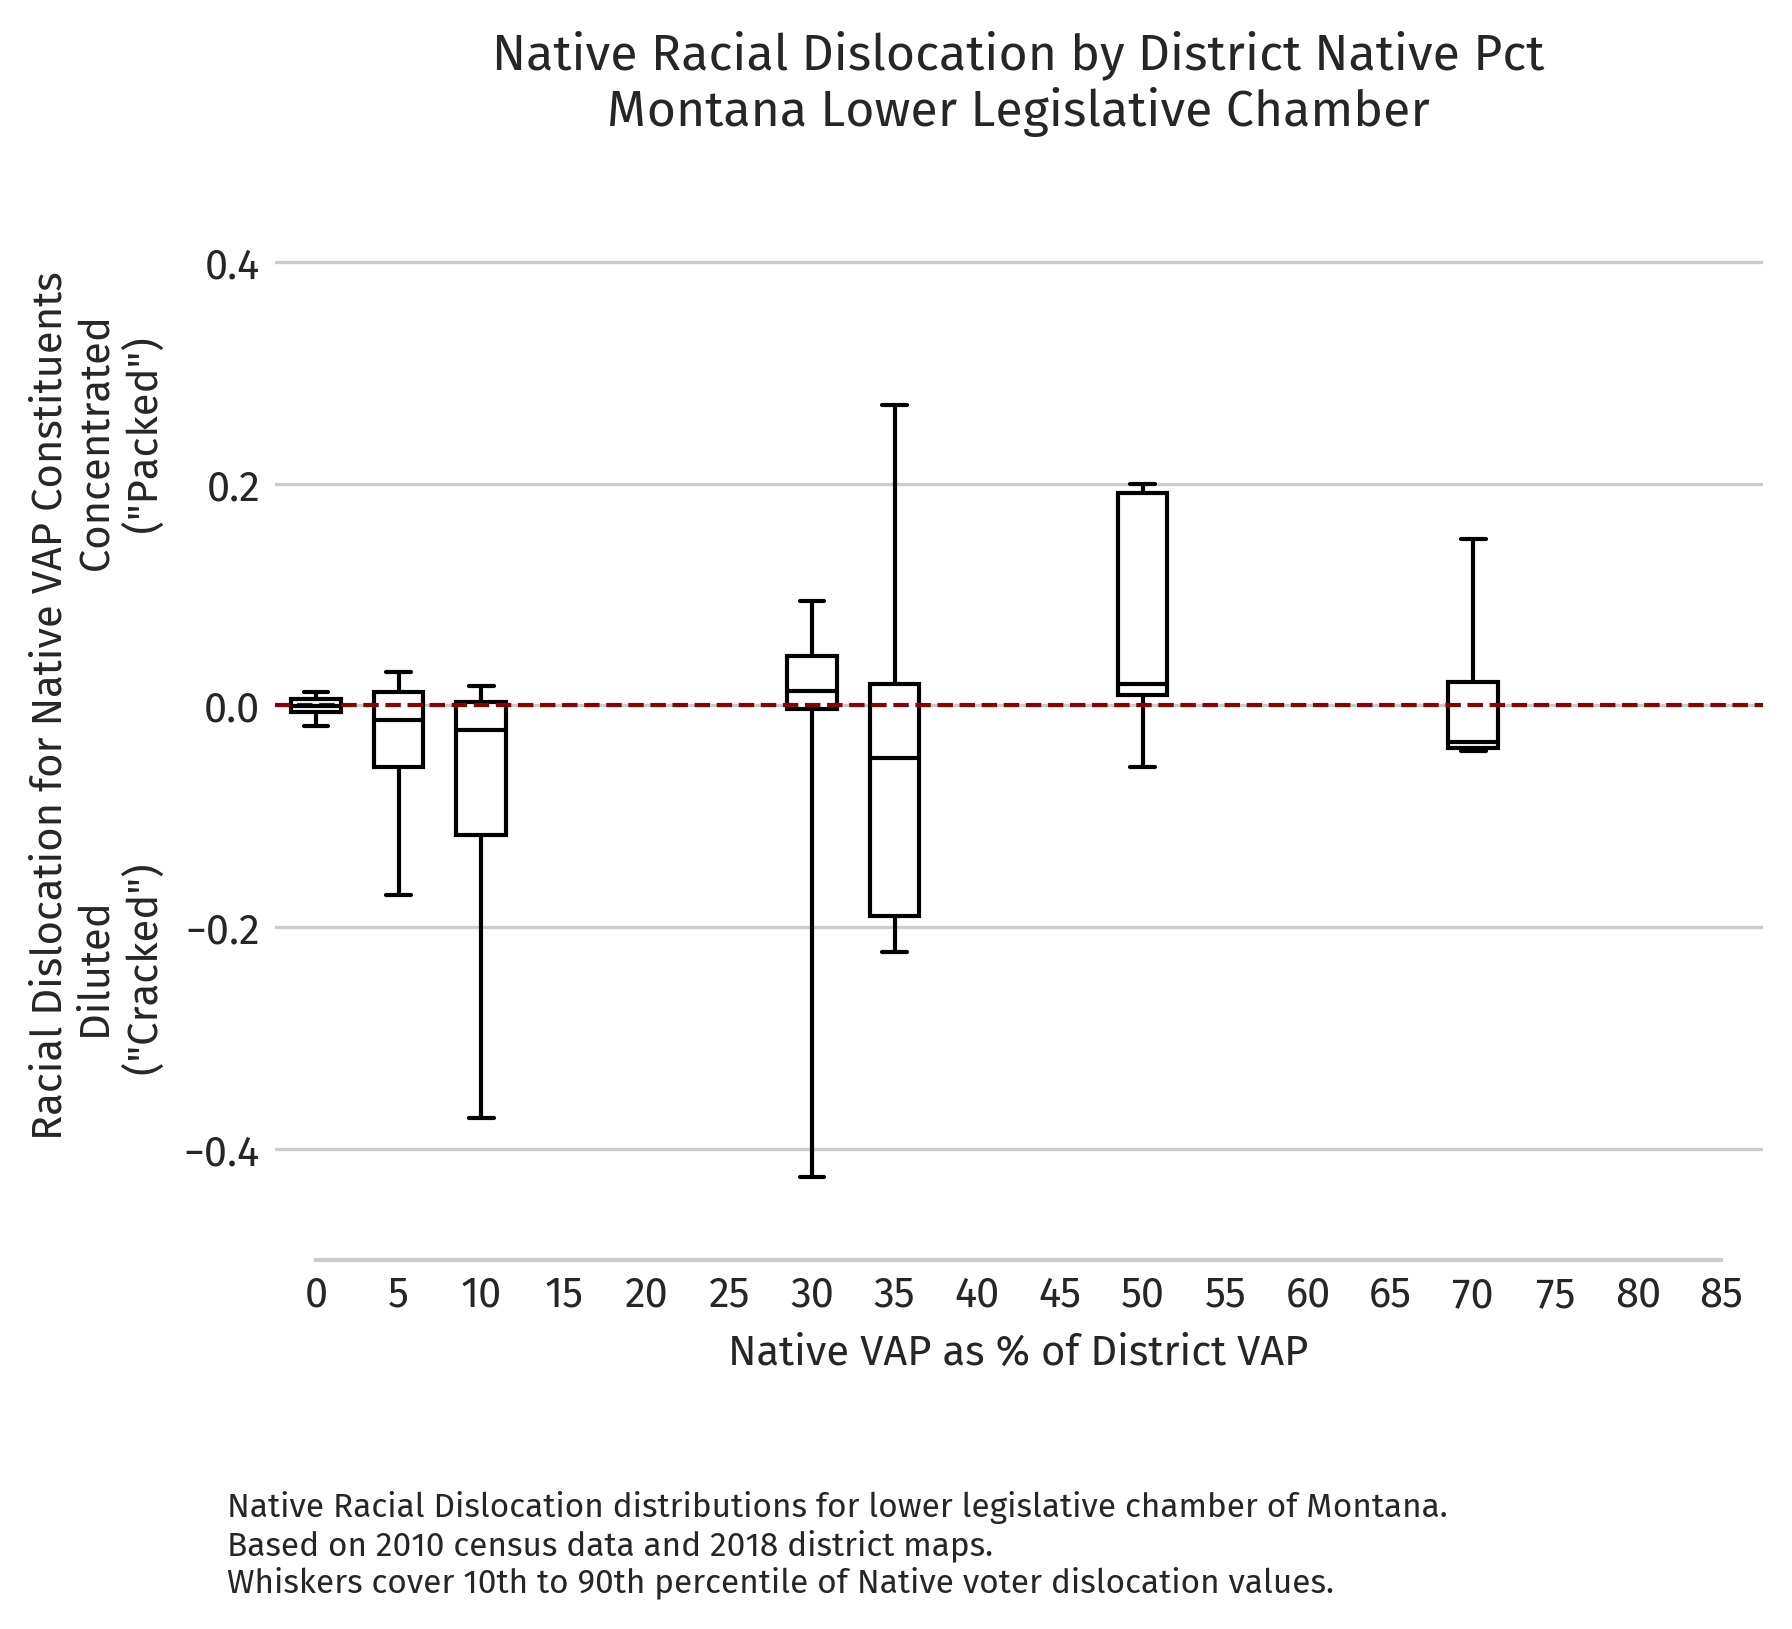
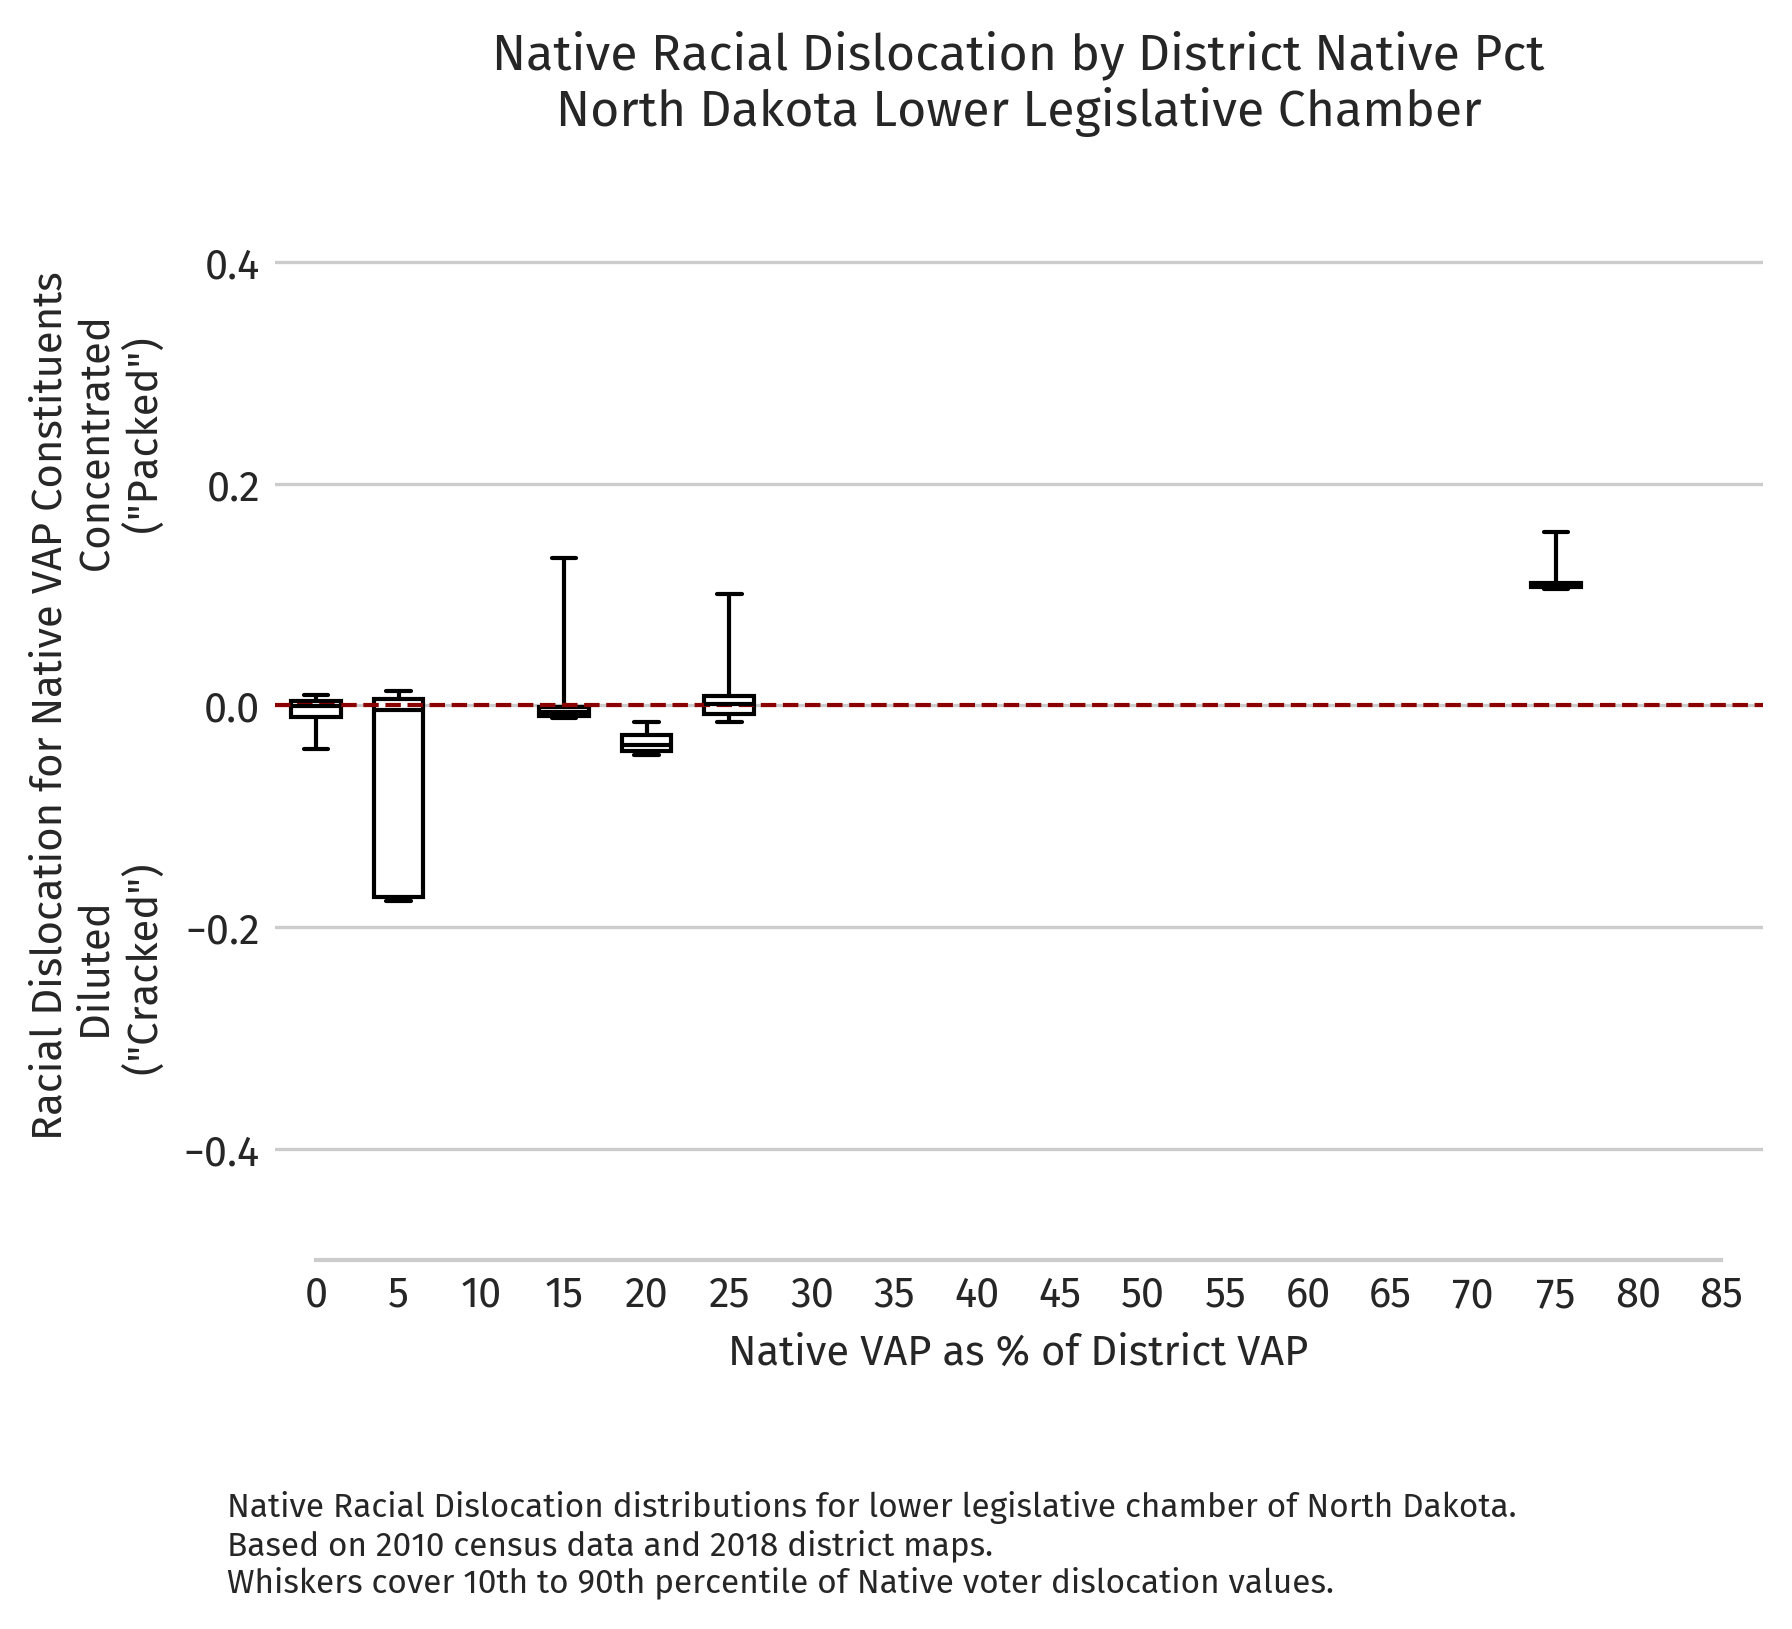
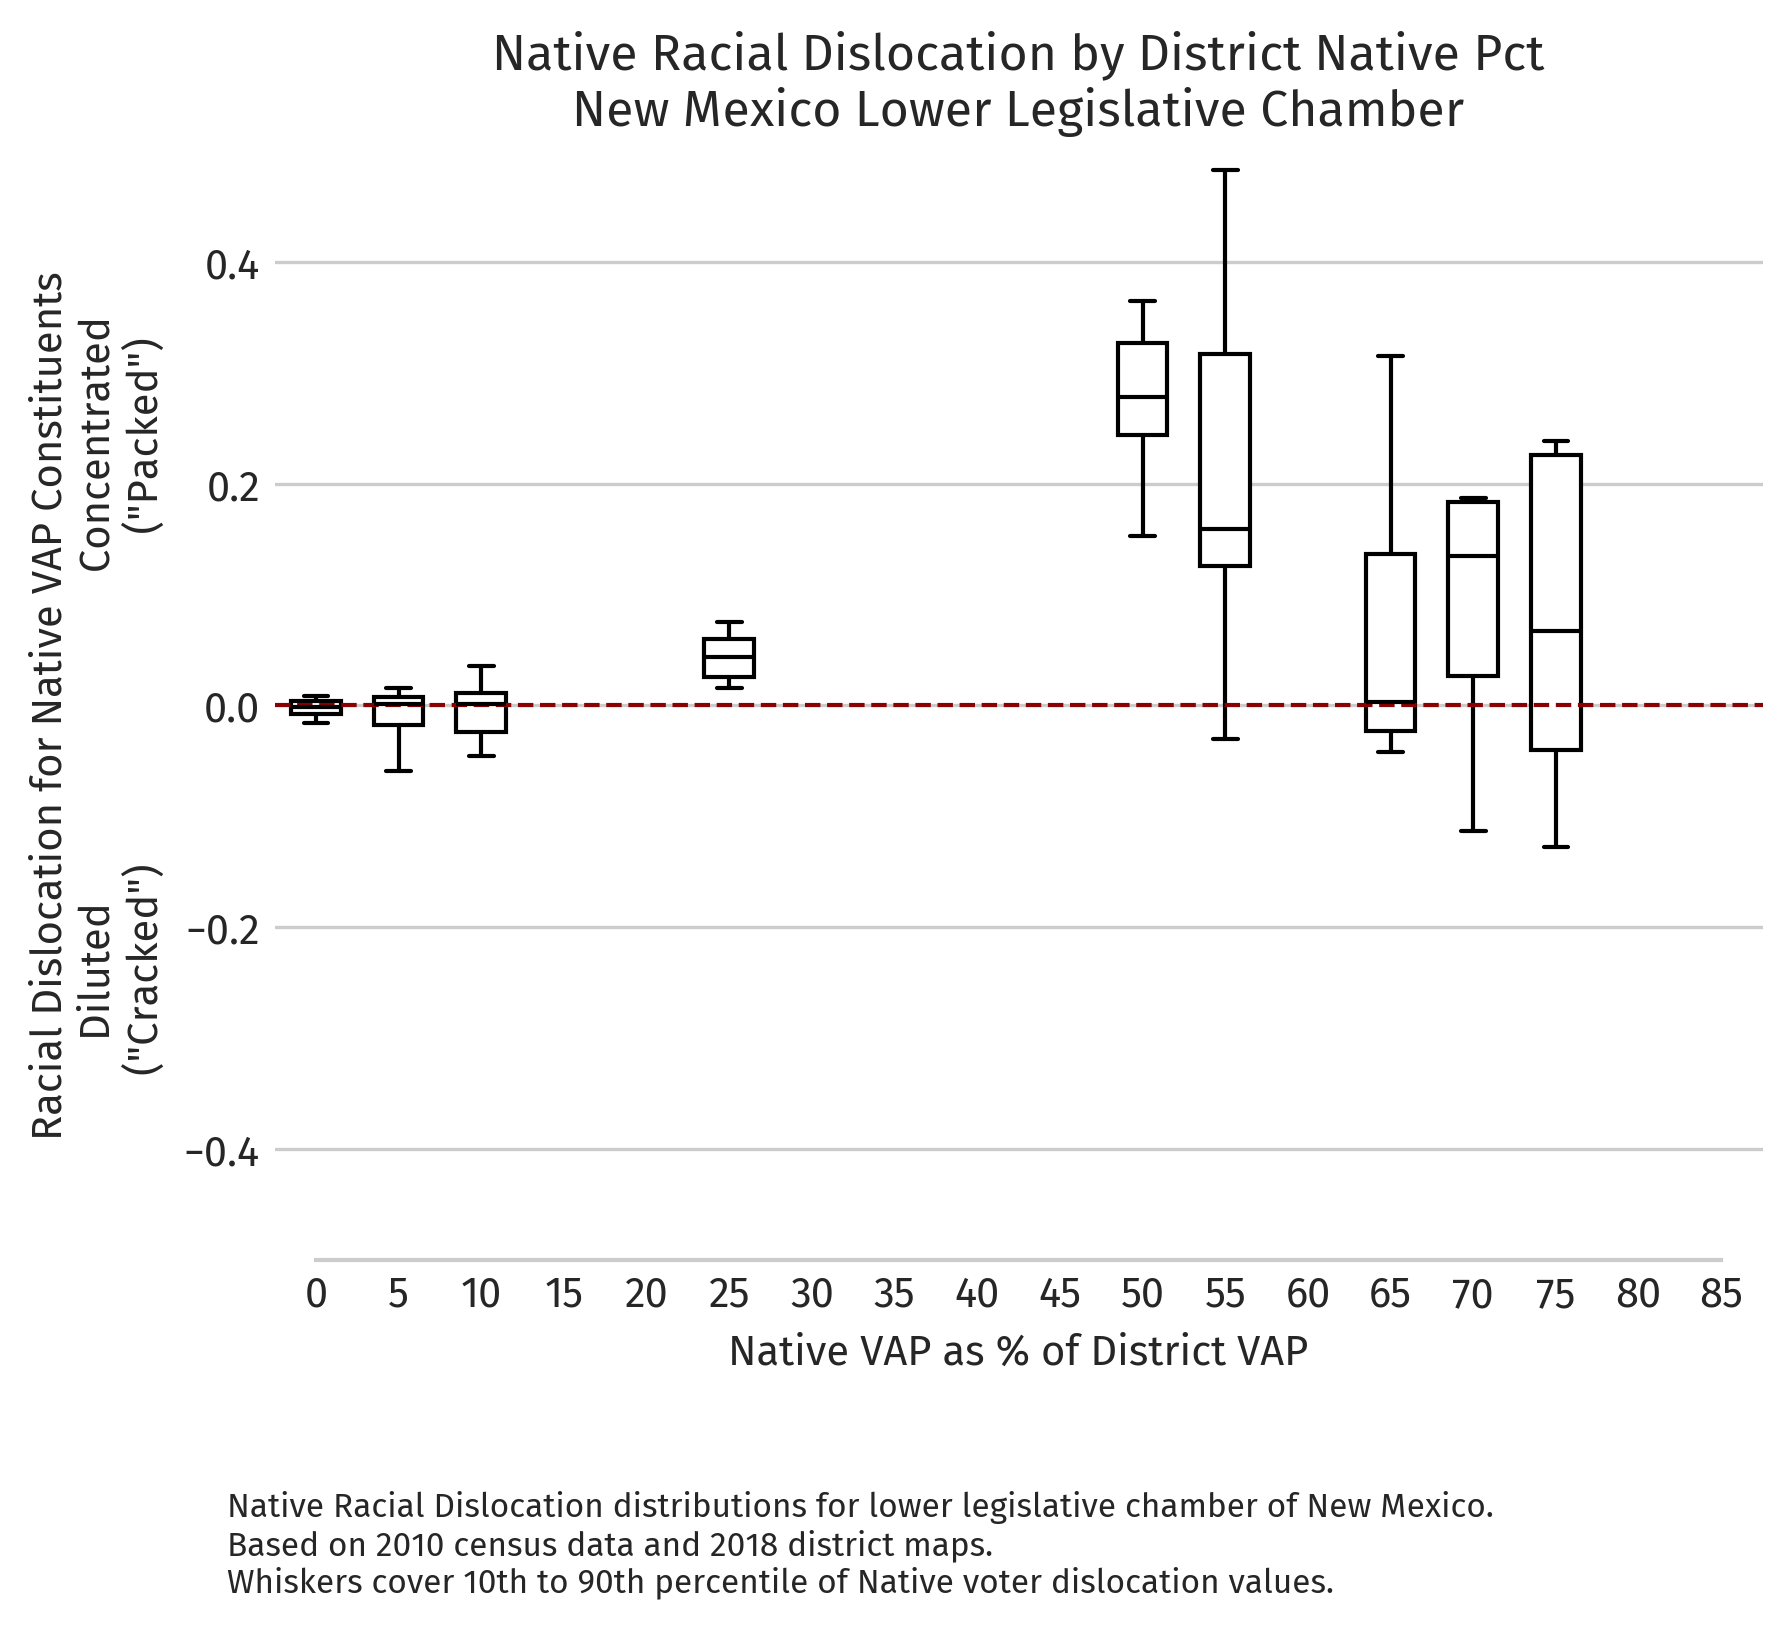
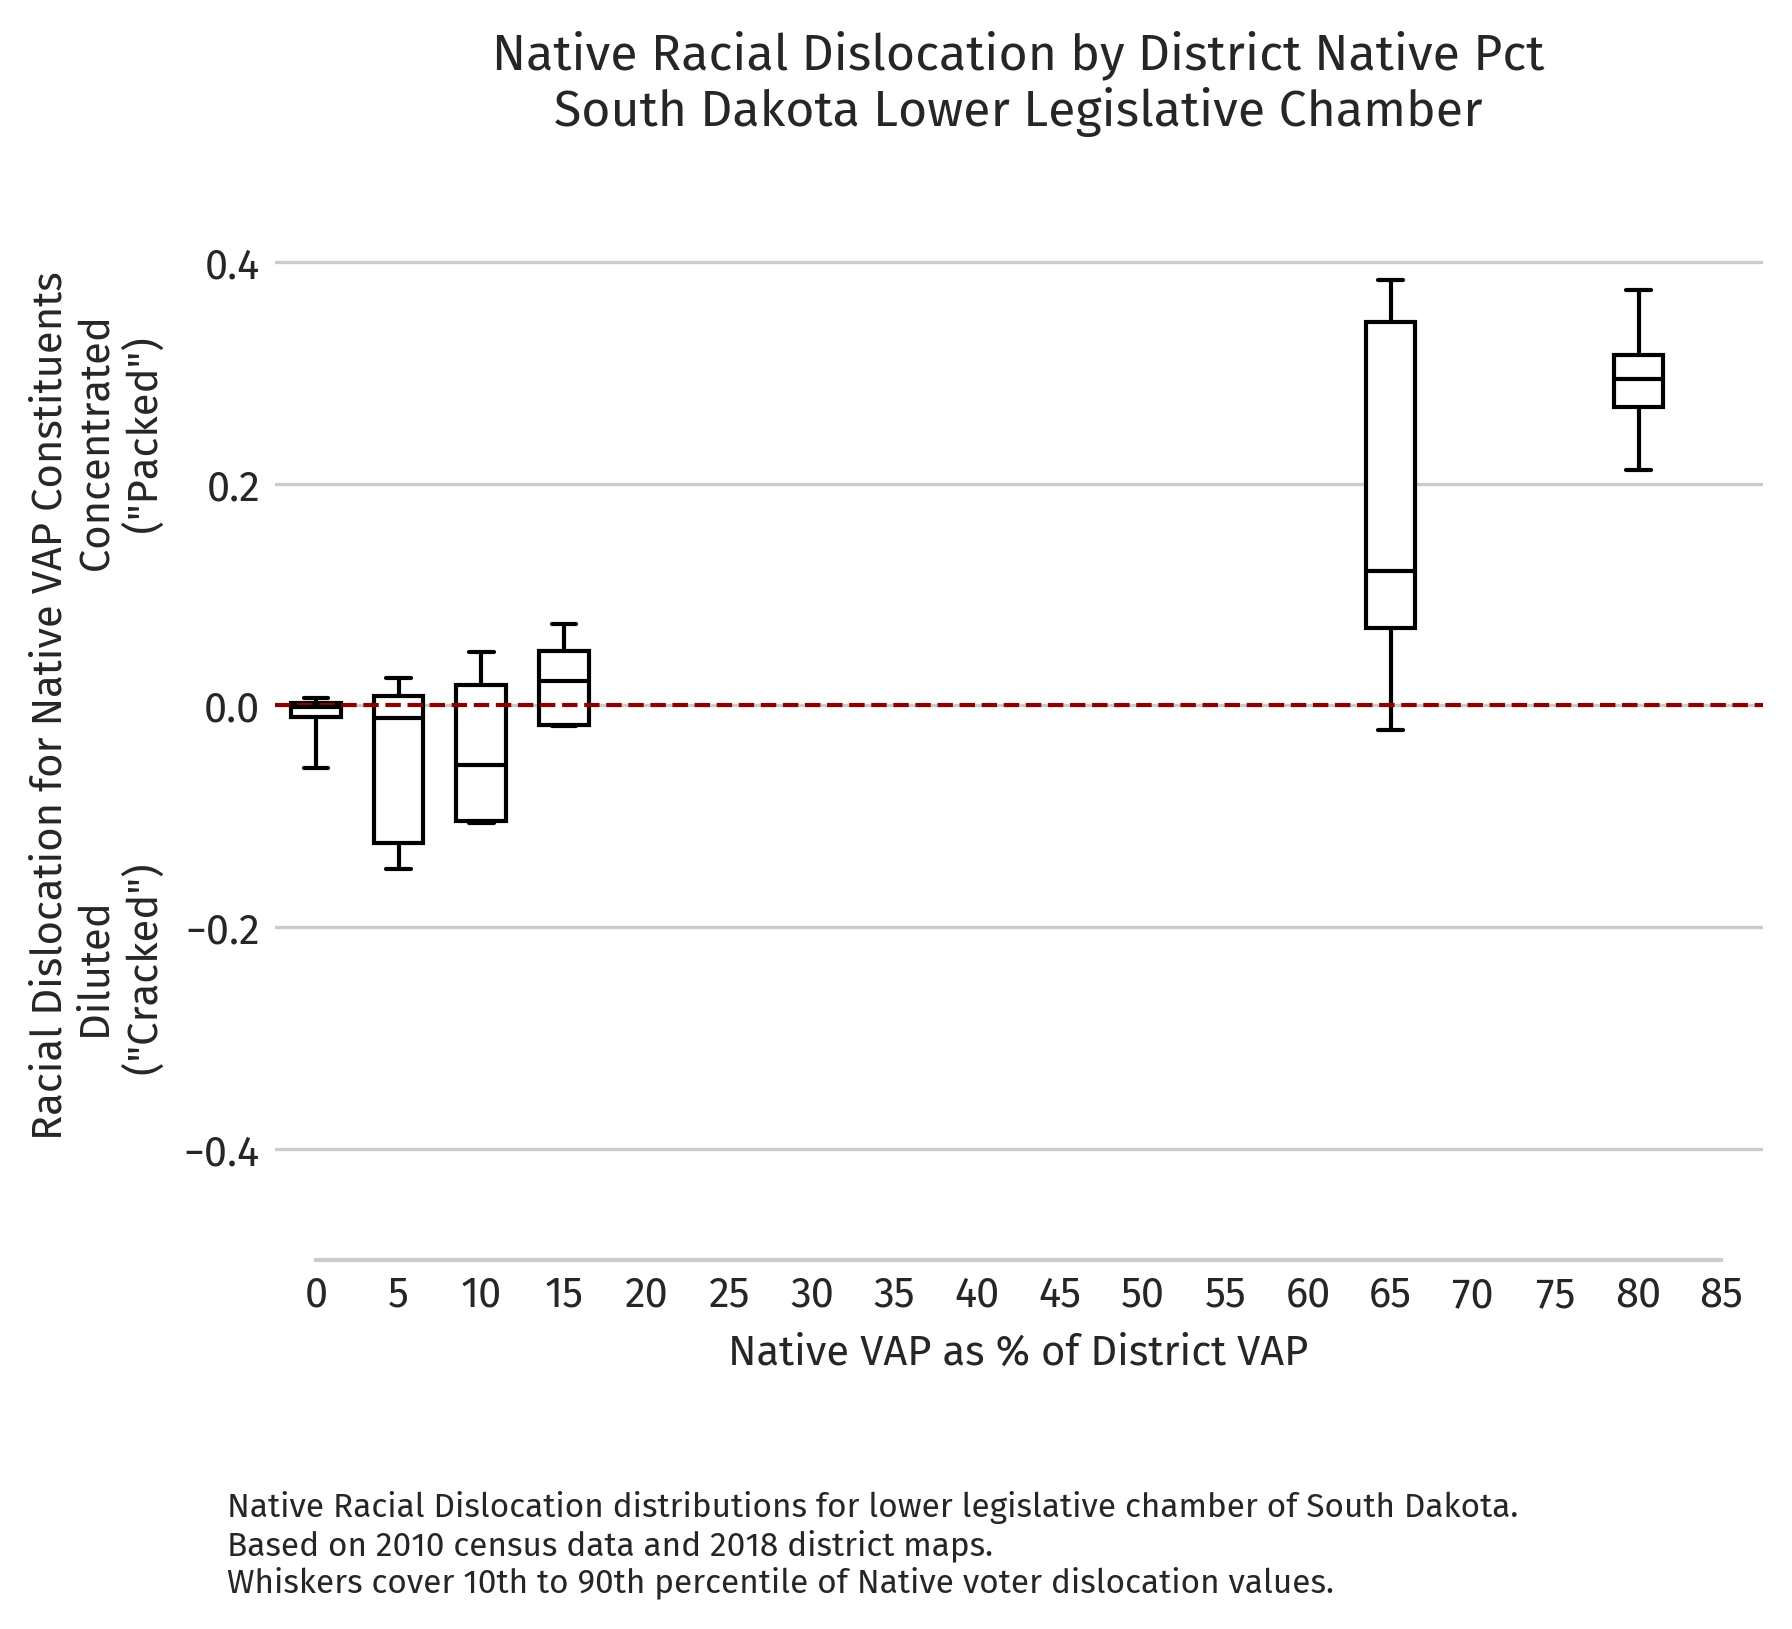
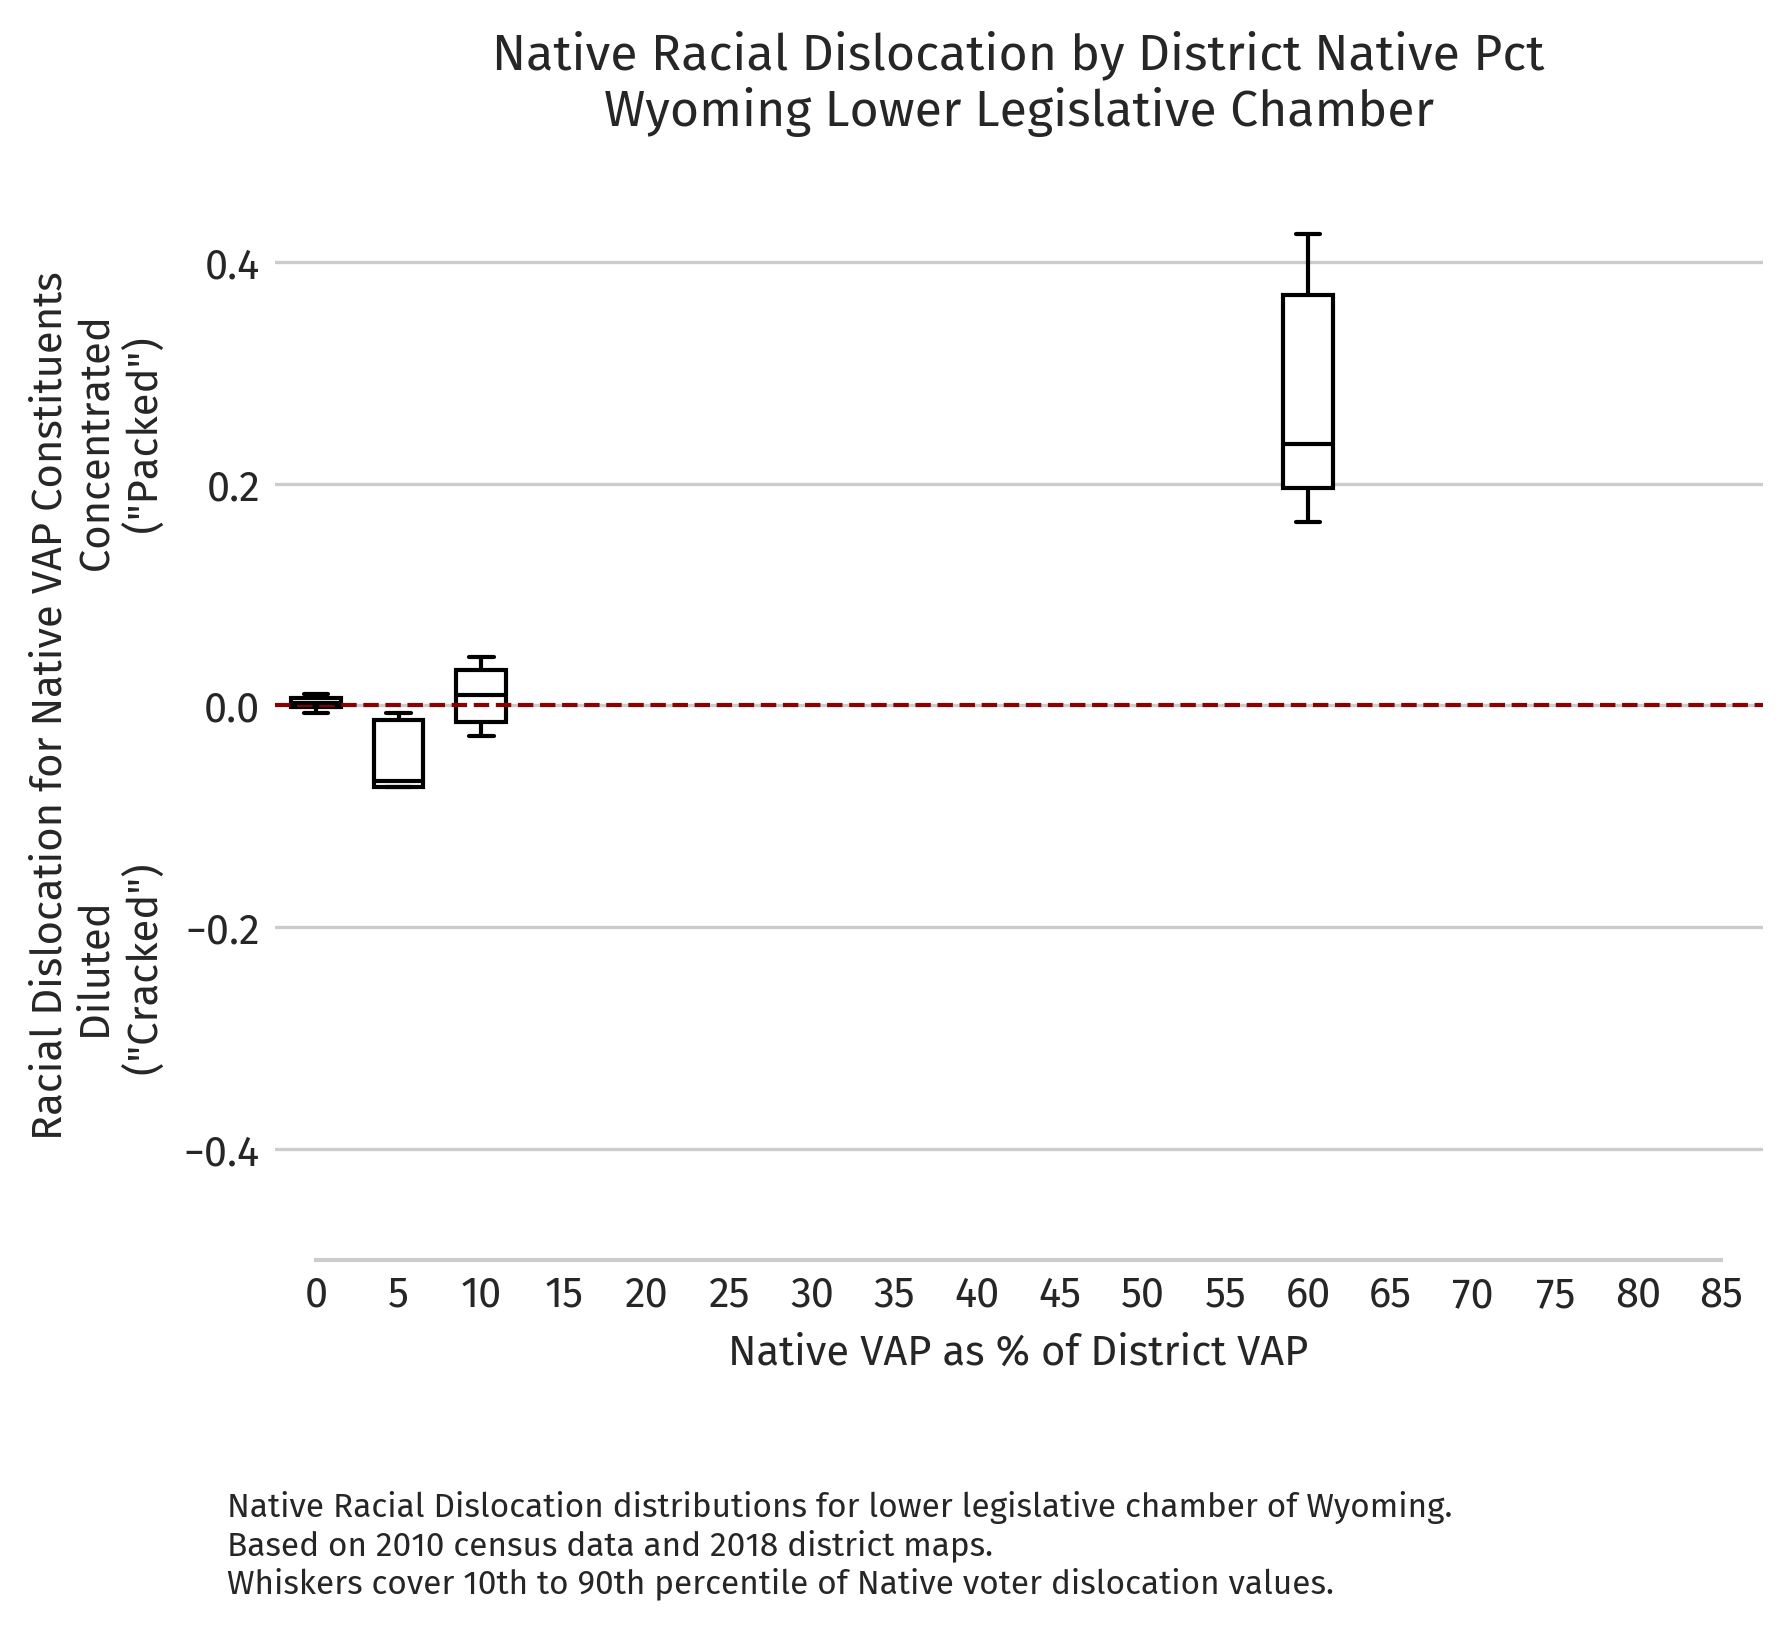
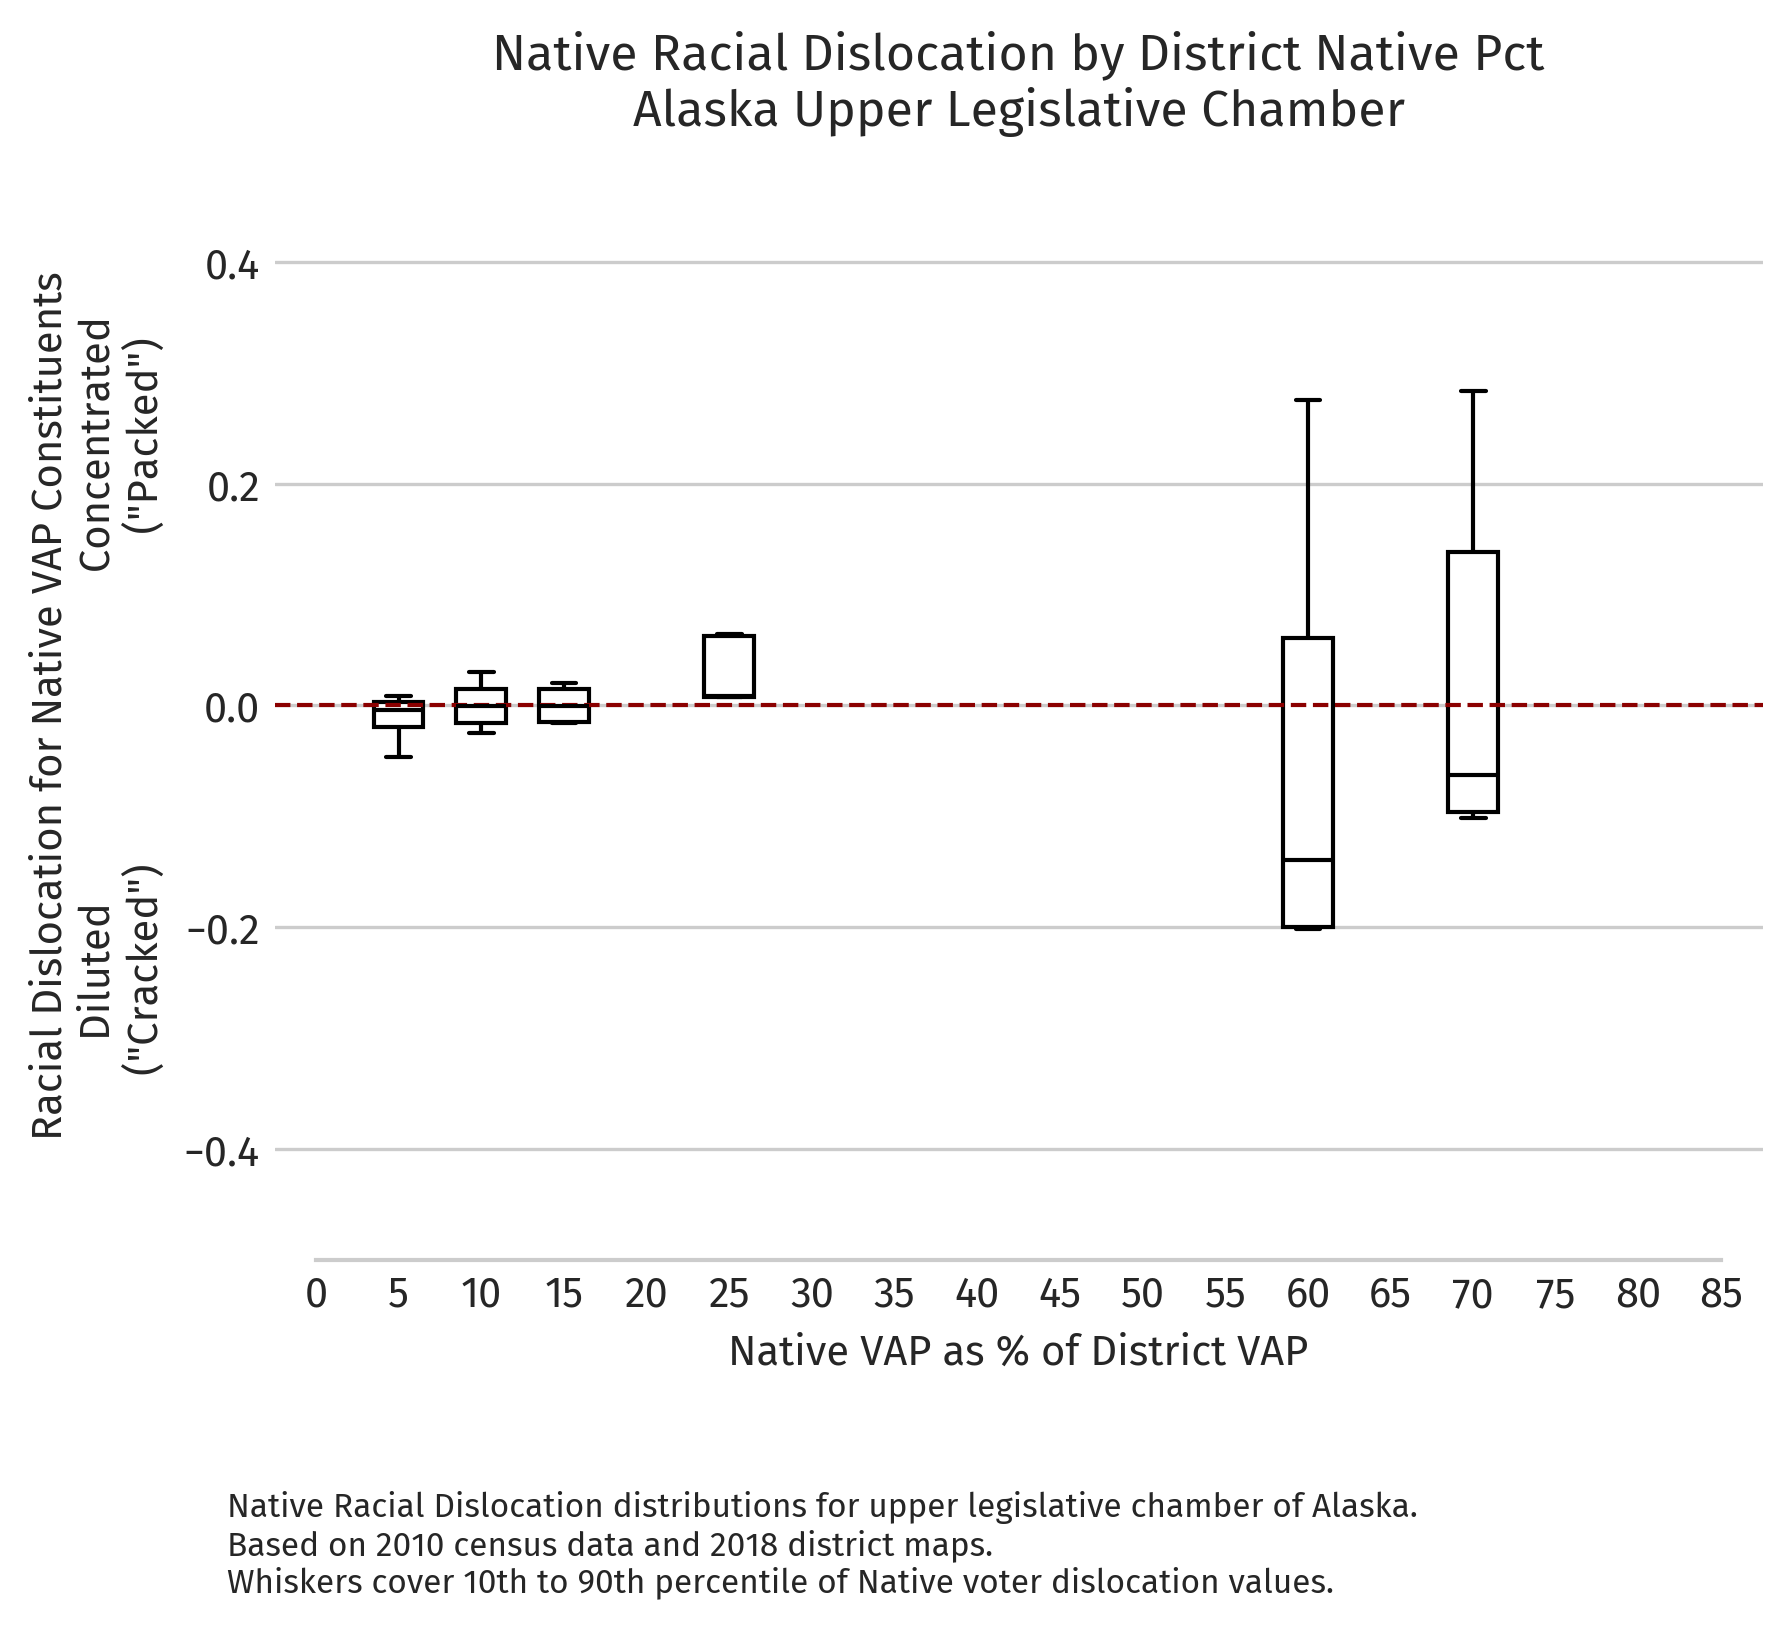
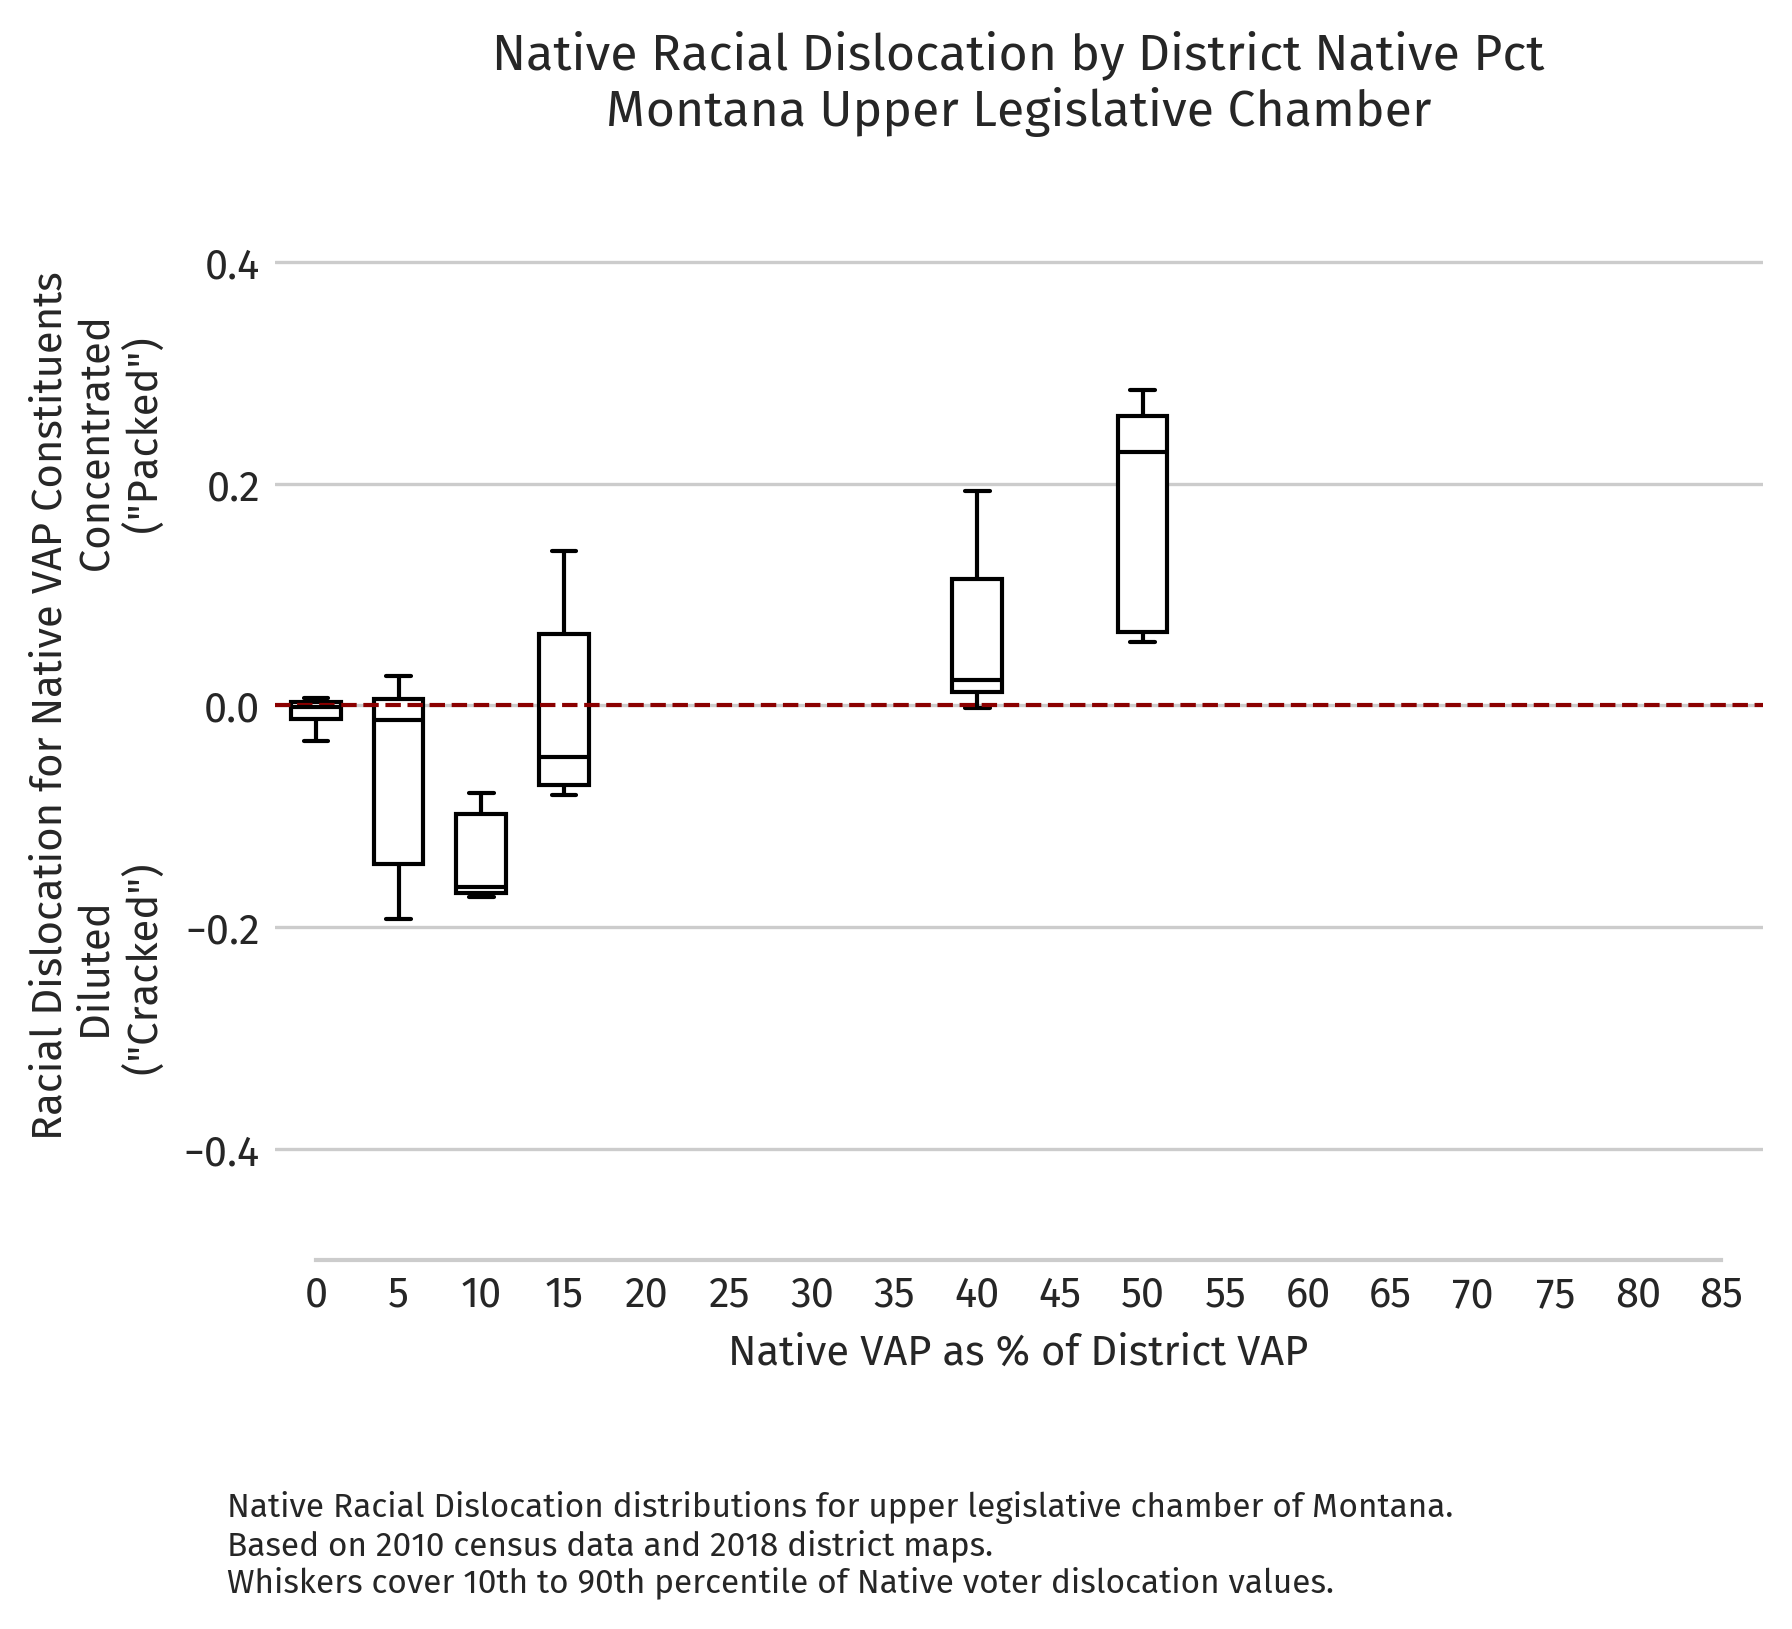
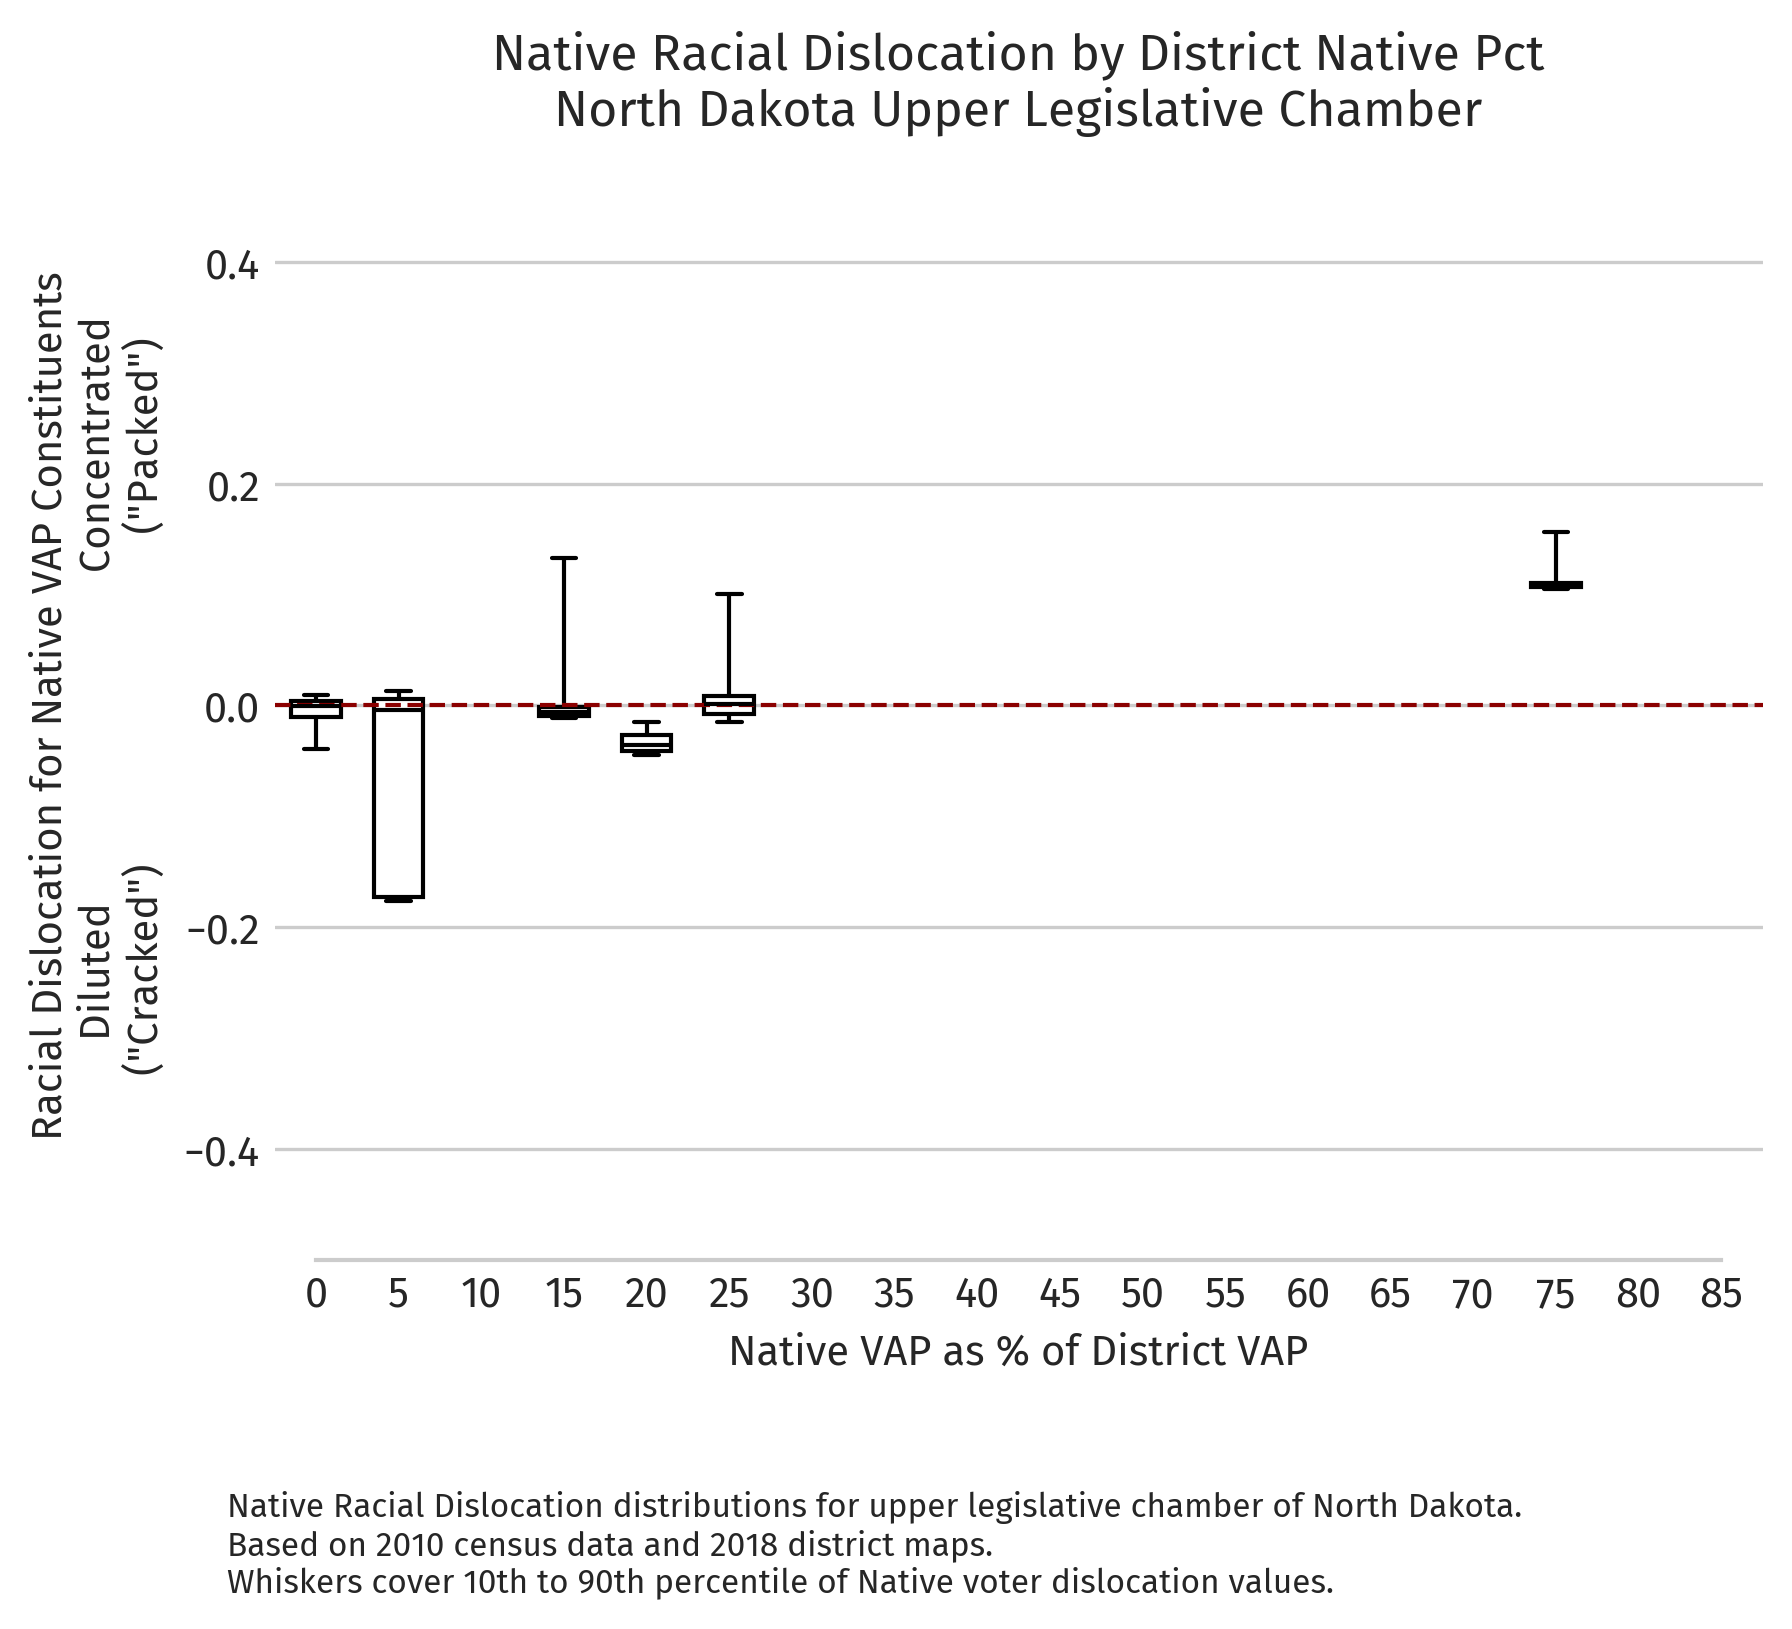
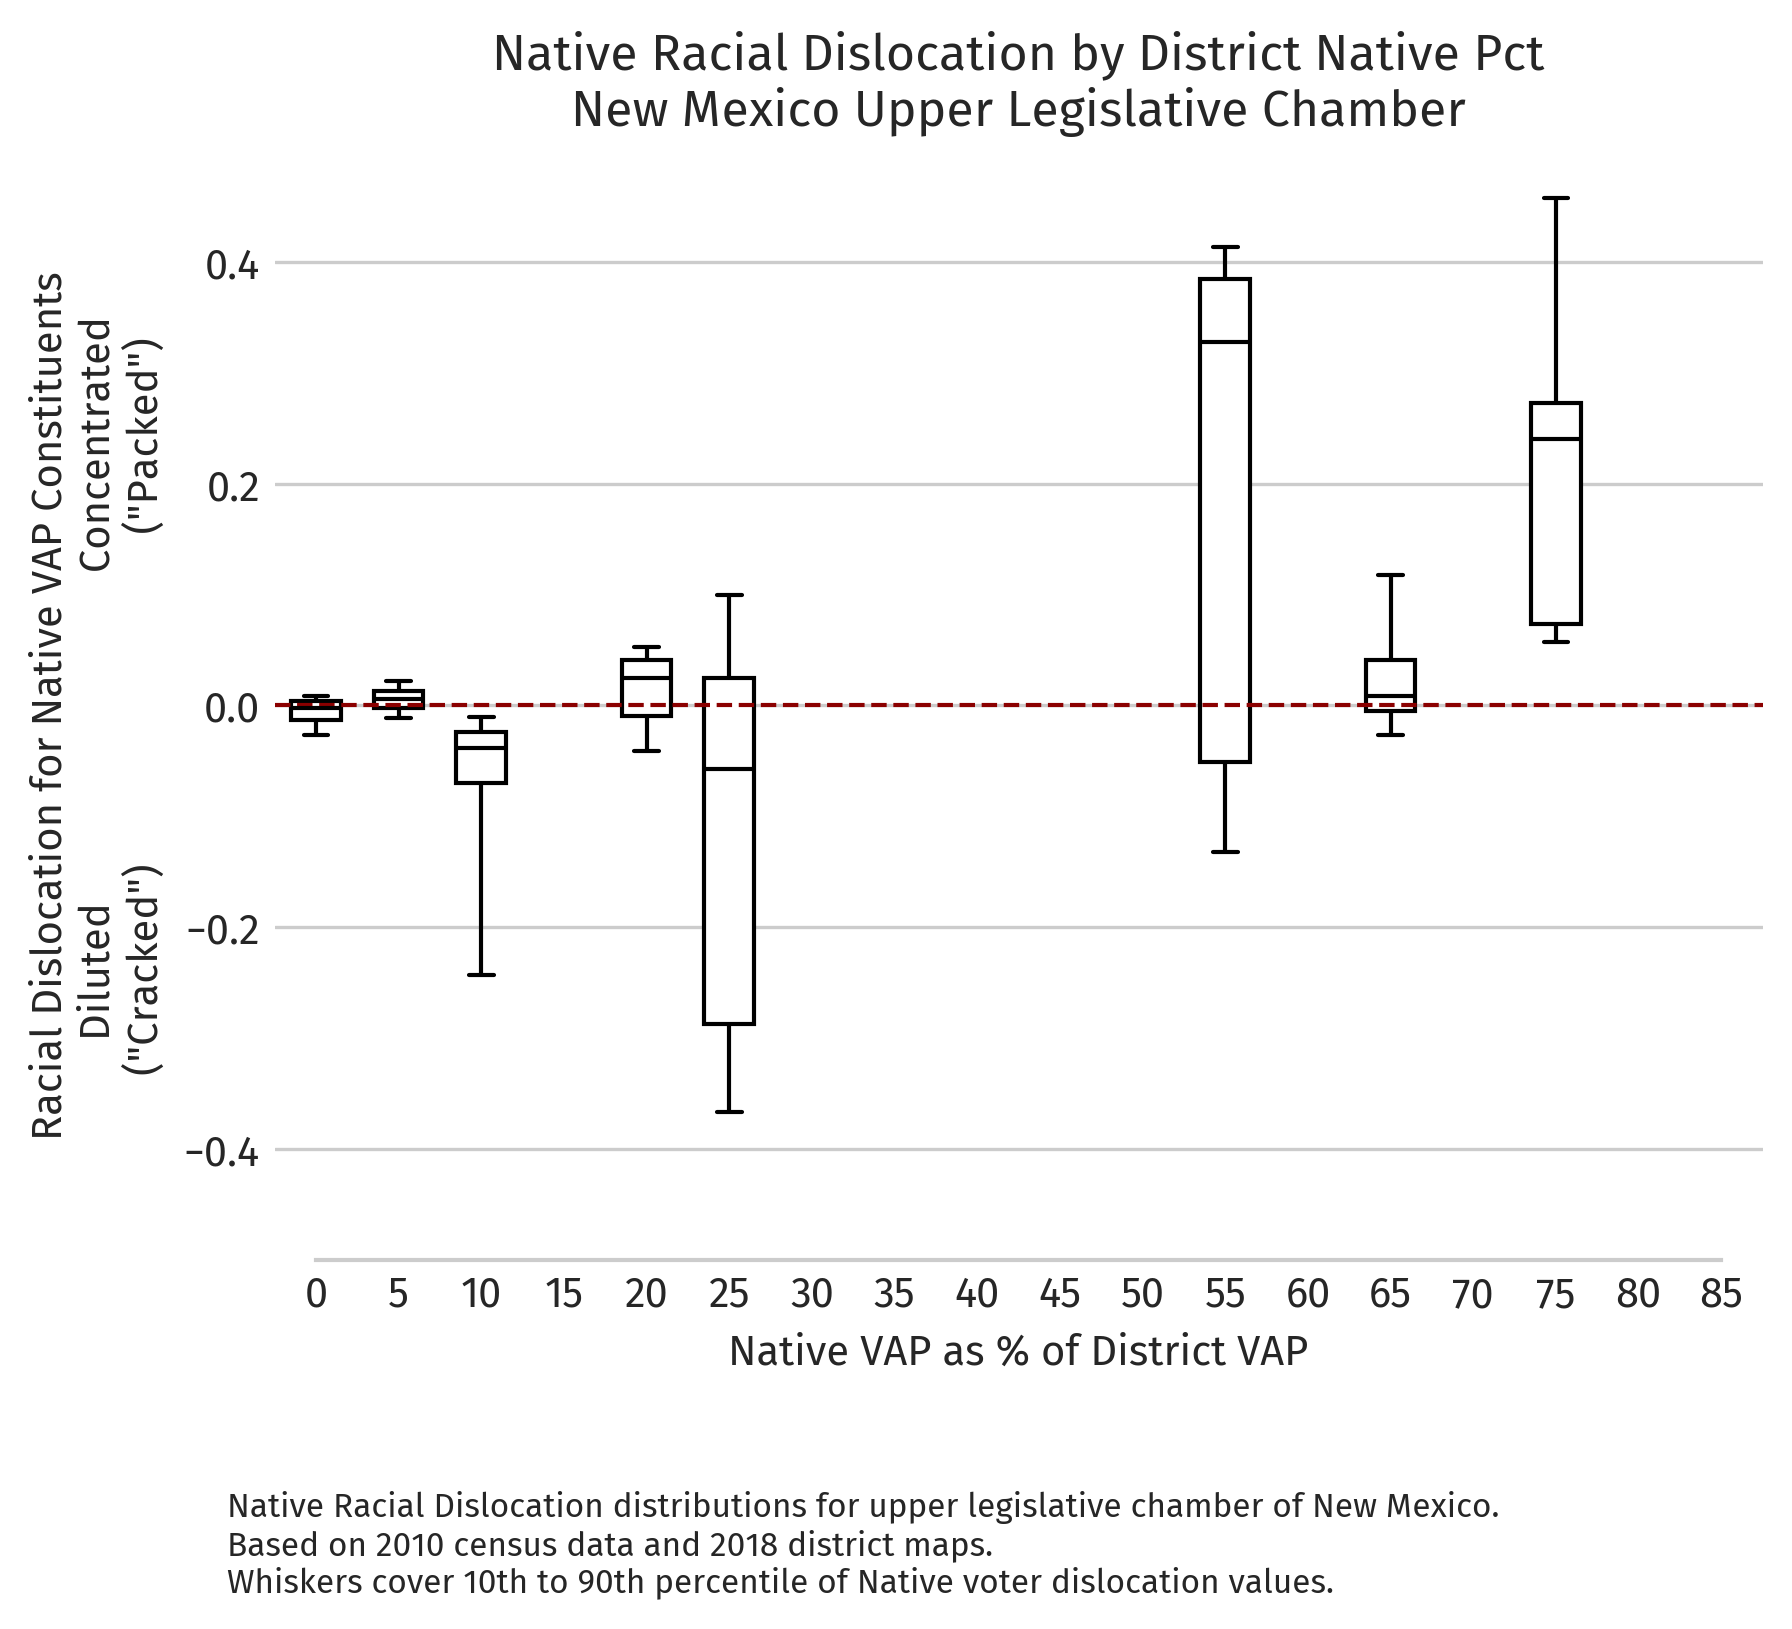
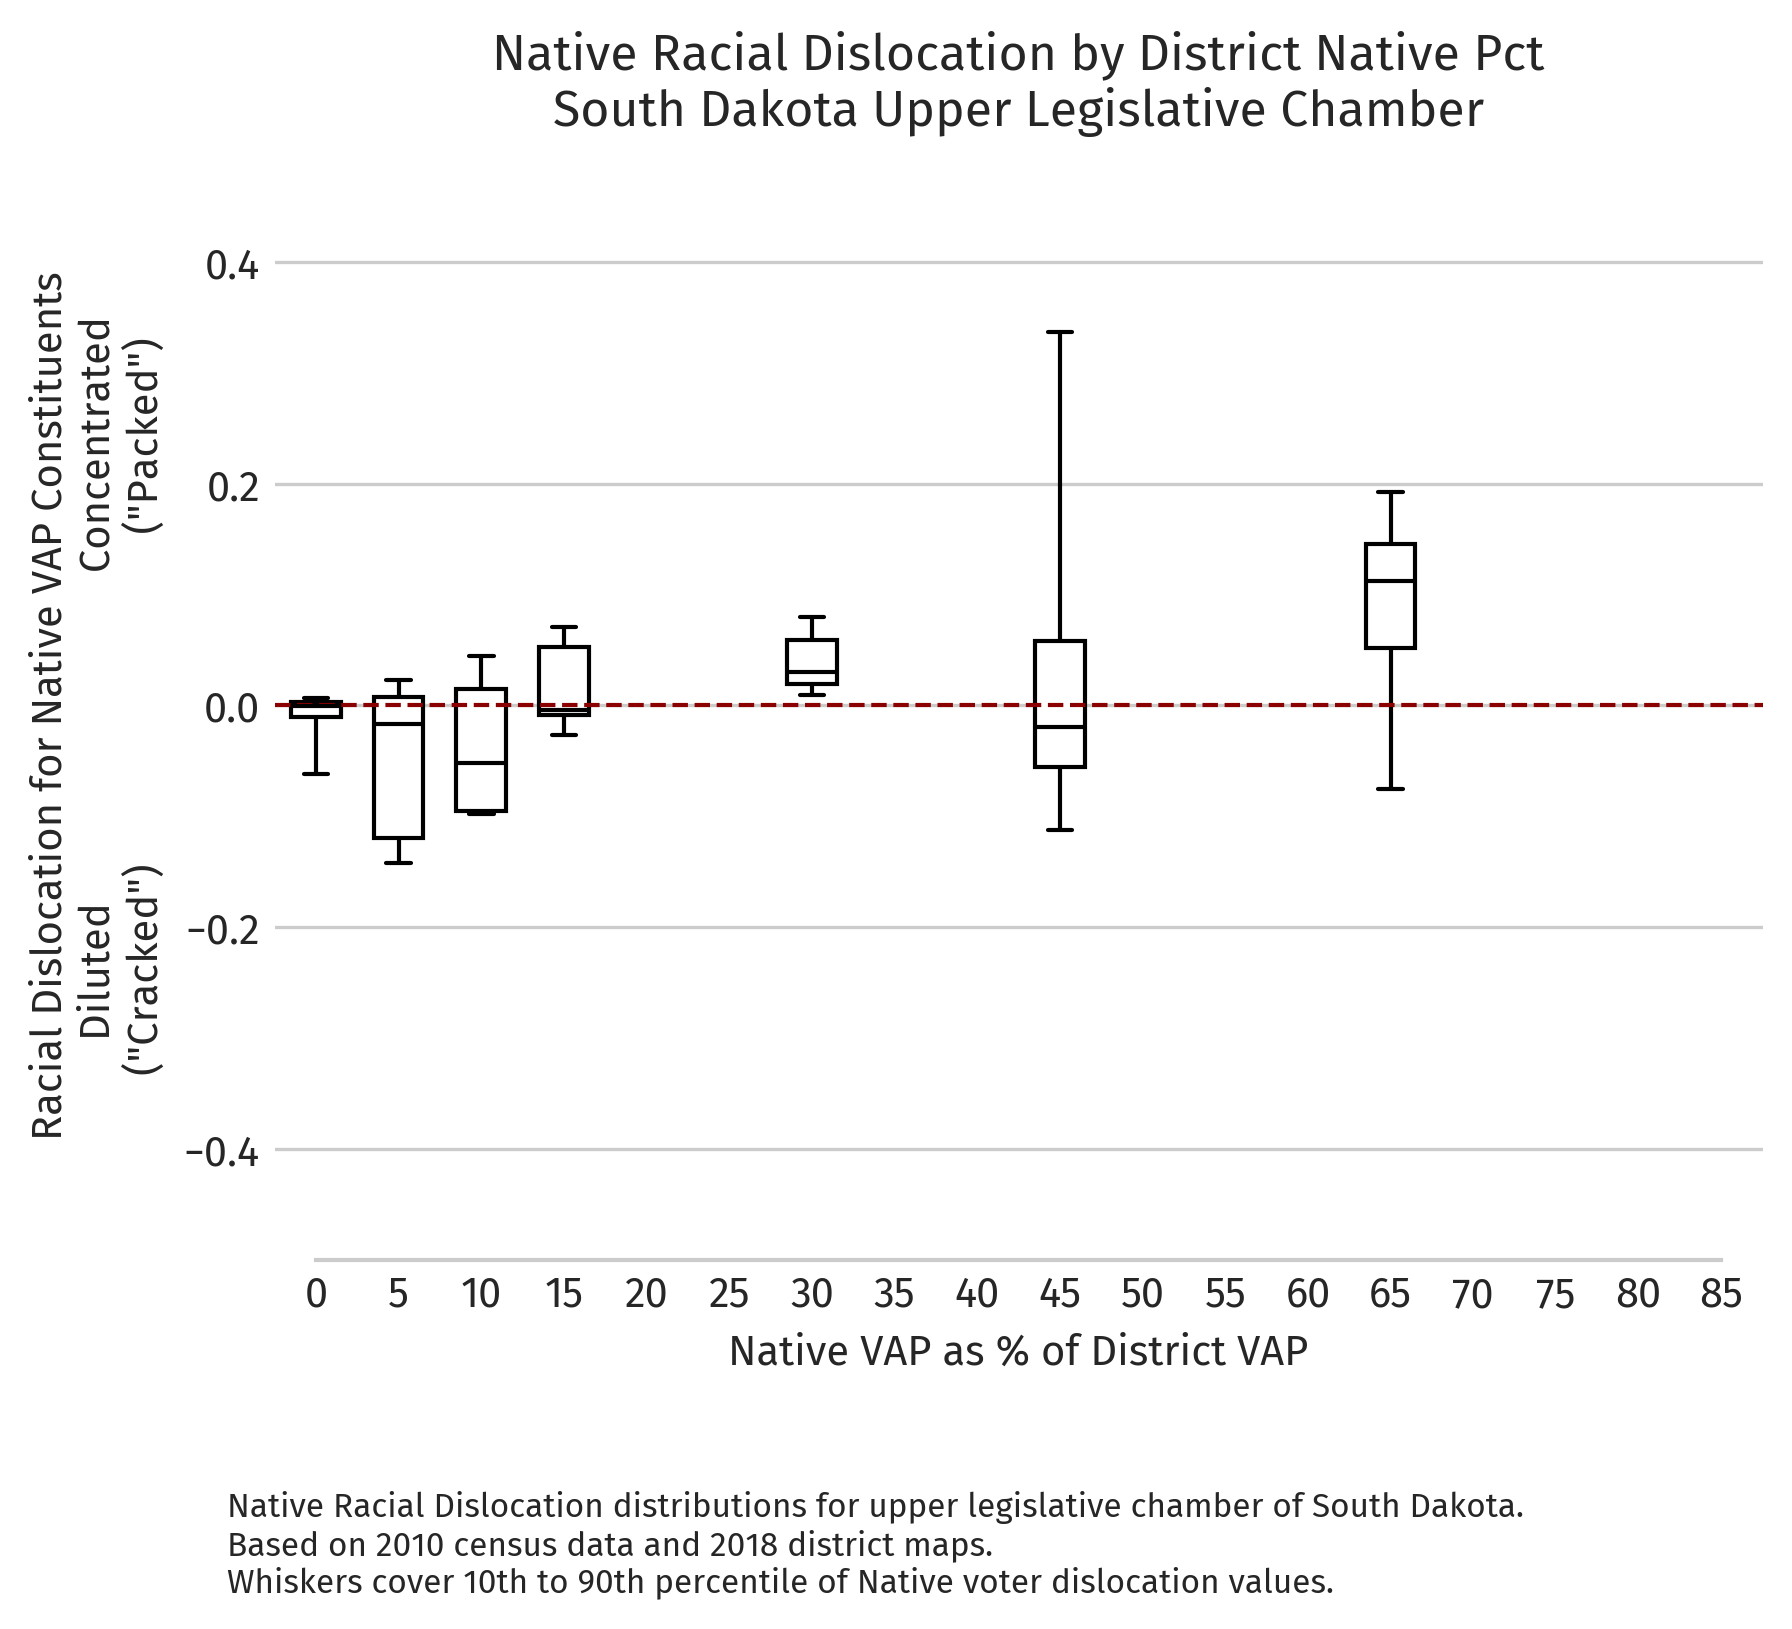
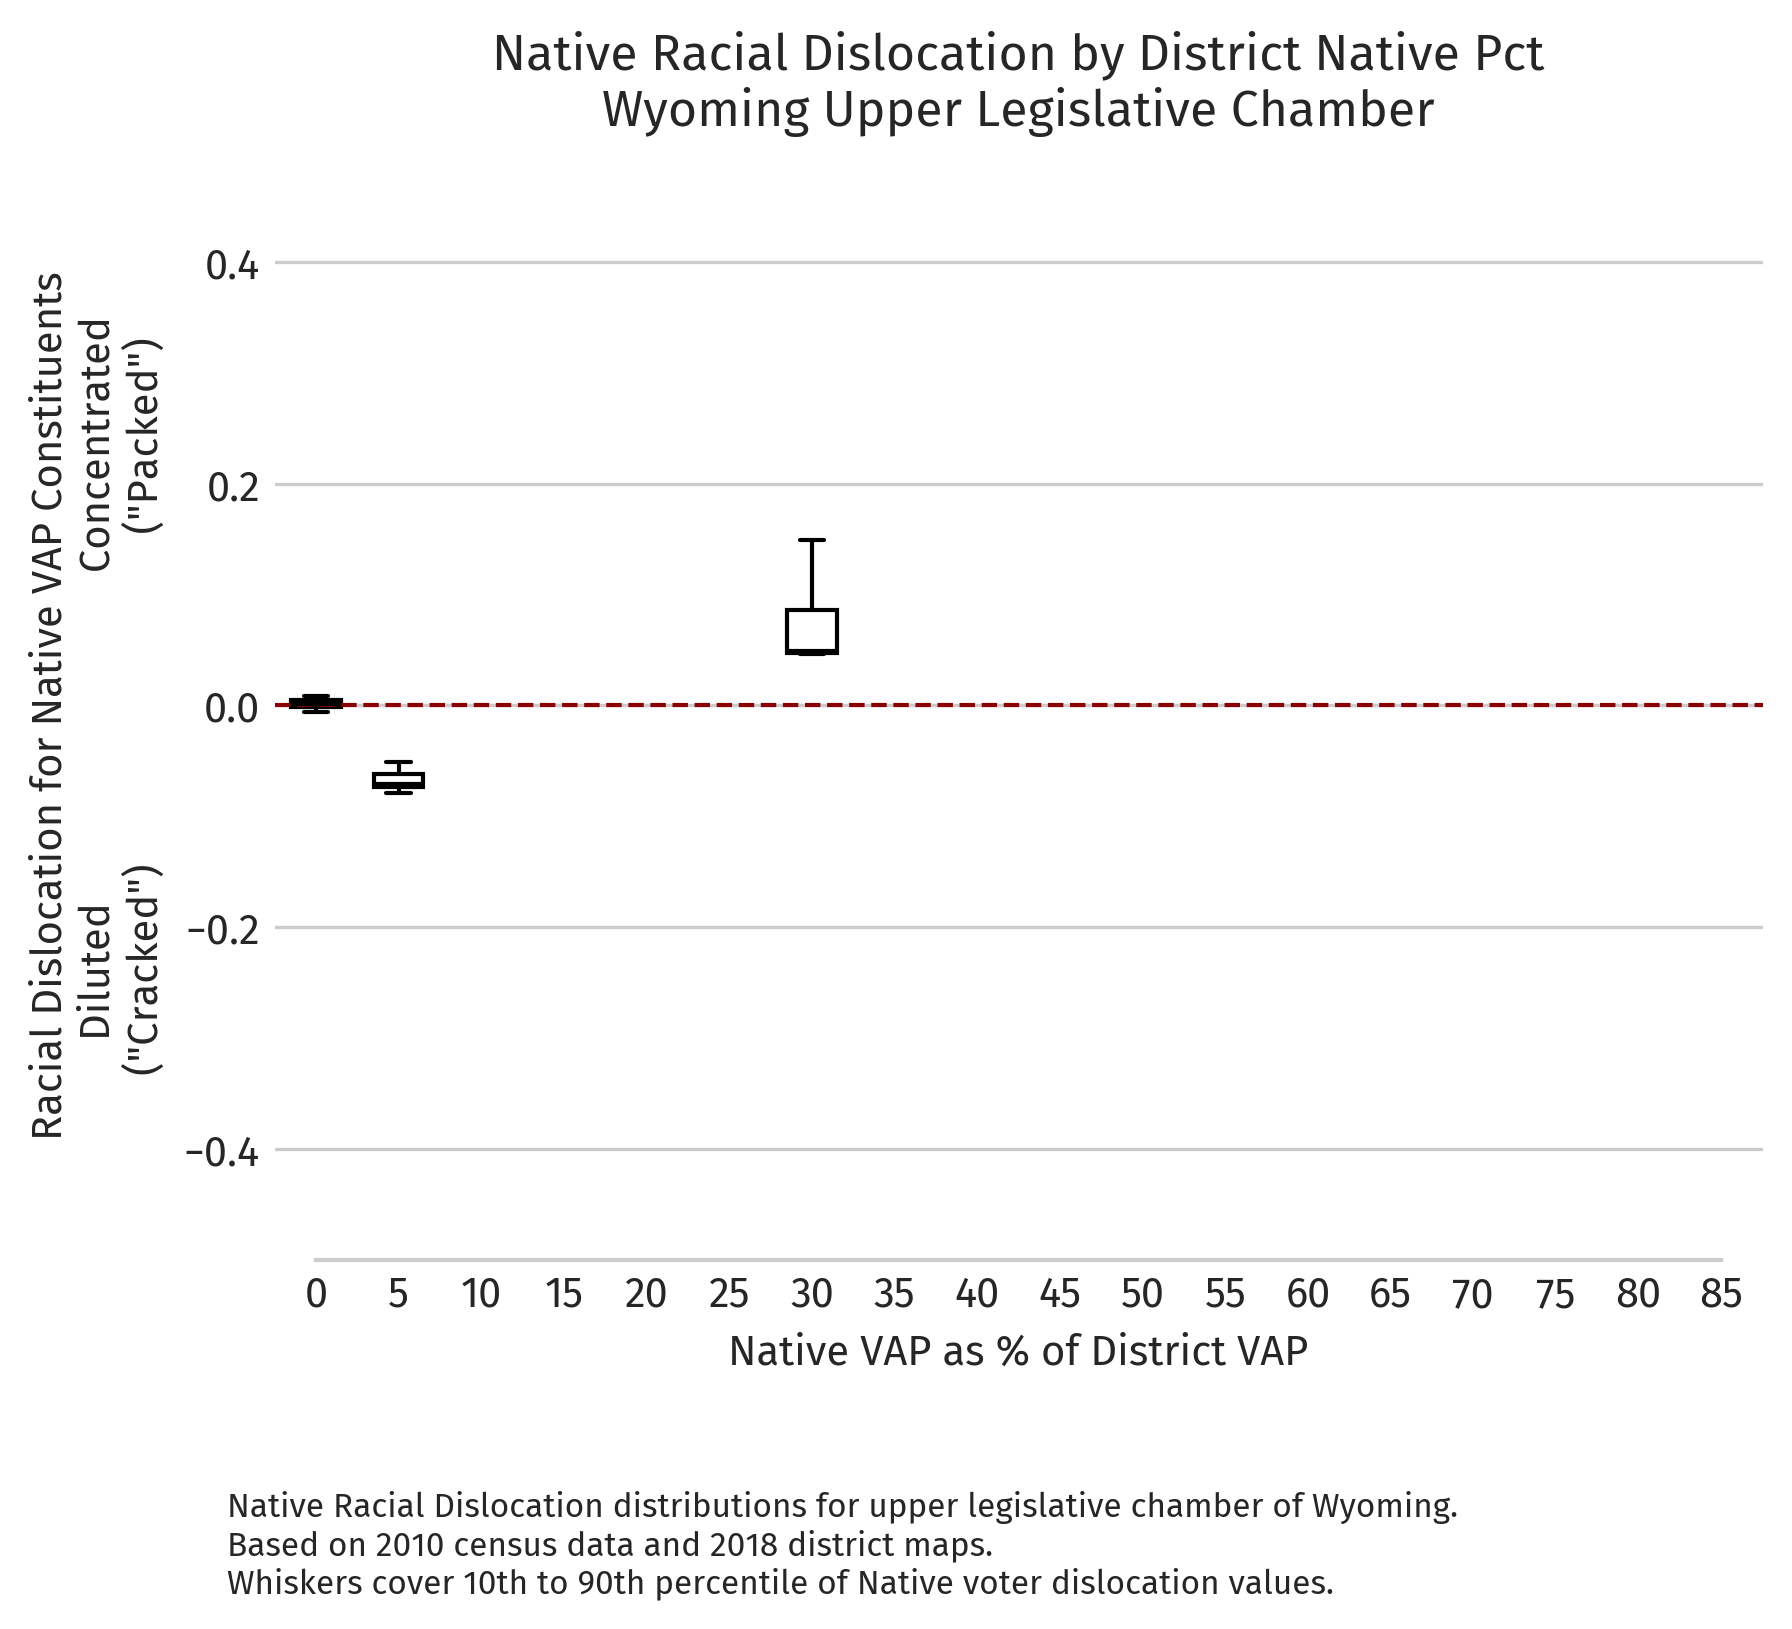
These figures show absolute dislocation values for each district — a measure of how much a district’s Native population share deviates from what would be expected given the local racial geography. Positive values indicate districts where Native voters are more concentrated than their geography alone would predict (packing); negative values indicate districts where they are more dispersed (cracking).
National overview figures appear first, followed by state-specific breakdowns for the seven states with the largest Native populations: Alaska, Arizona, Montana, North Dakota, New Mexico, South Dakota, and Wyoming.
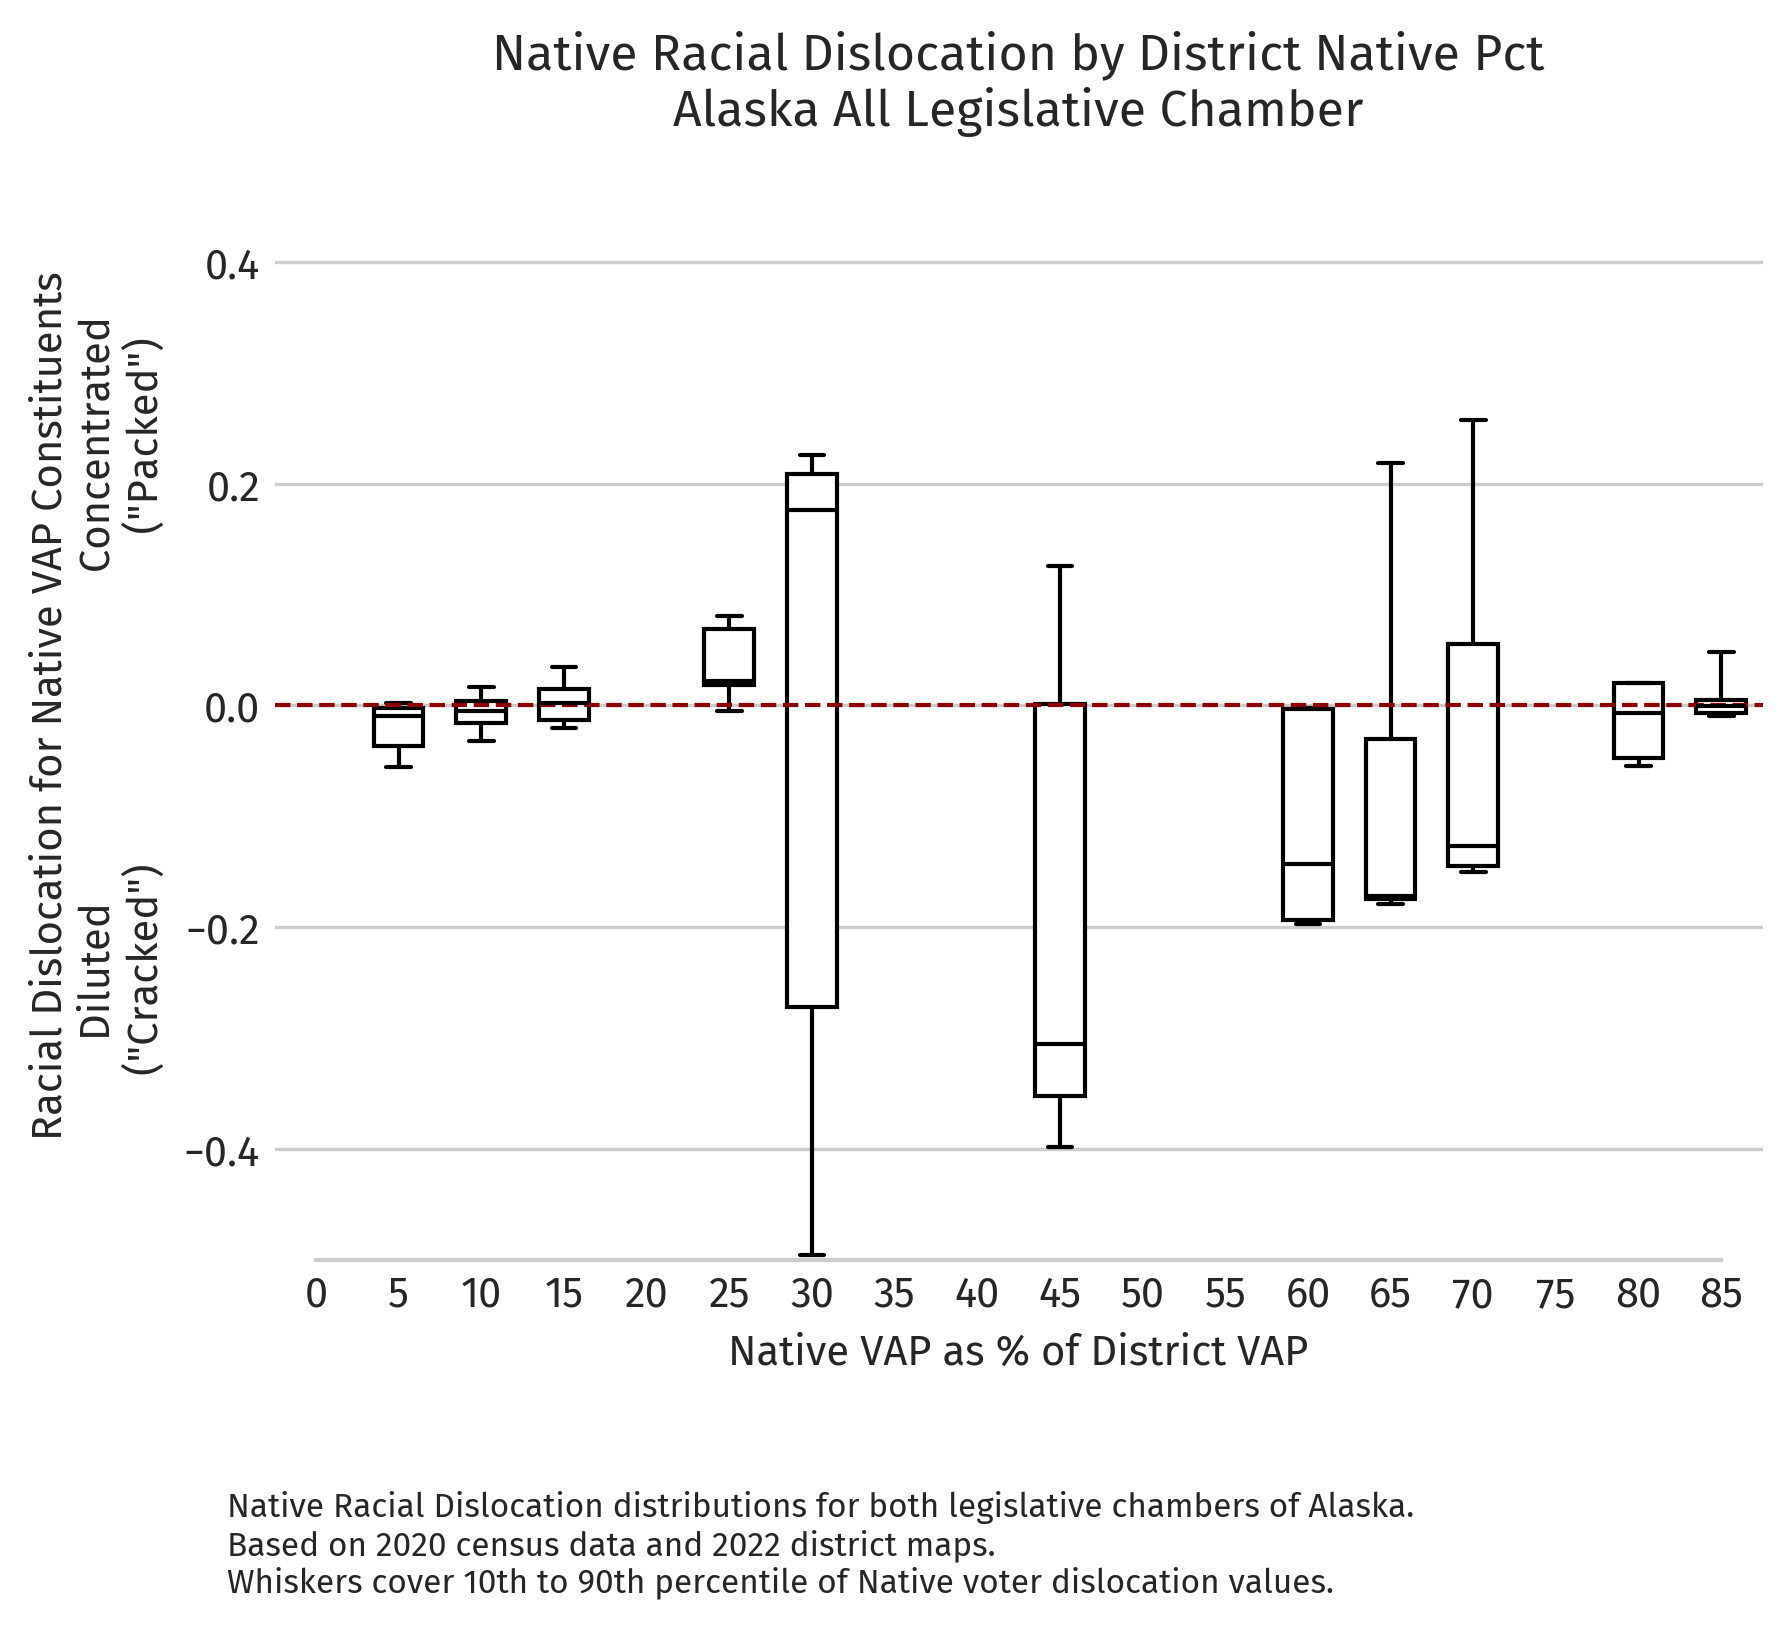
Alaska — Absolute dislocation by district NVAP (2020 redistricting cycle)Arizona — Absolute dislocation by district NVAP (2020 redistricting cycle)Montana — Absolute dislocation by district NVAP (2020 redistricting cycle)North Dakota — Absolute dislocation by district NVAP (2020 redistricting cycle)New Mexico — Absolute dislocation by district NVAP (2020 redistricting cycle)South Dakota — Absolute dislocation by district NVAP (2020 redistricting cycle)Wyoming — Absolute dislocation by district NVAP (2020 redistricting cycle)
Alaska — Absolute dislocation by district NVAP (2010 redistricting cycle)Arizona — Absolute dislocation by district NVAP (2010 redistricting cycle)Montana — Absolute dislocation by district NVAP (2010 redistricting cycle)North Dakota — Absolute dislocation by district NVAP (2010 redistricting cycle)New Mexico — Absolute dislocation by district NVAP (2010 redistricting cycle)South Dakota — Absolute dislocation by district NVAP (2010 redistricting cycle)Wyoming — Absolute dislocation by district NVAP (2010 redistricting cycle)