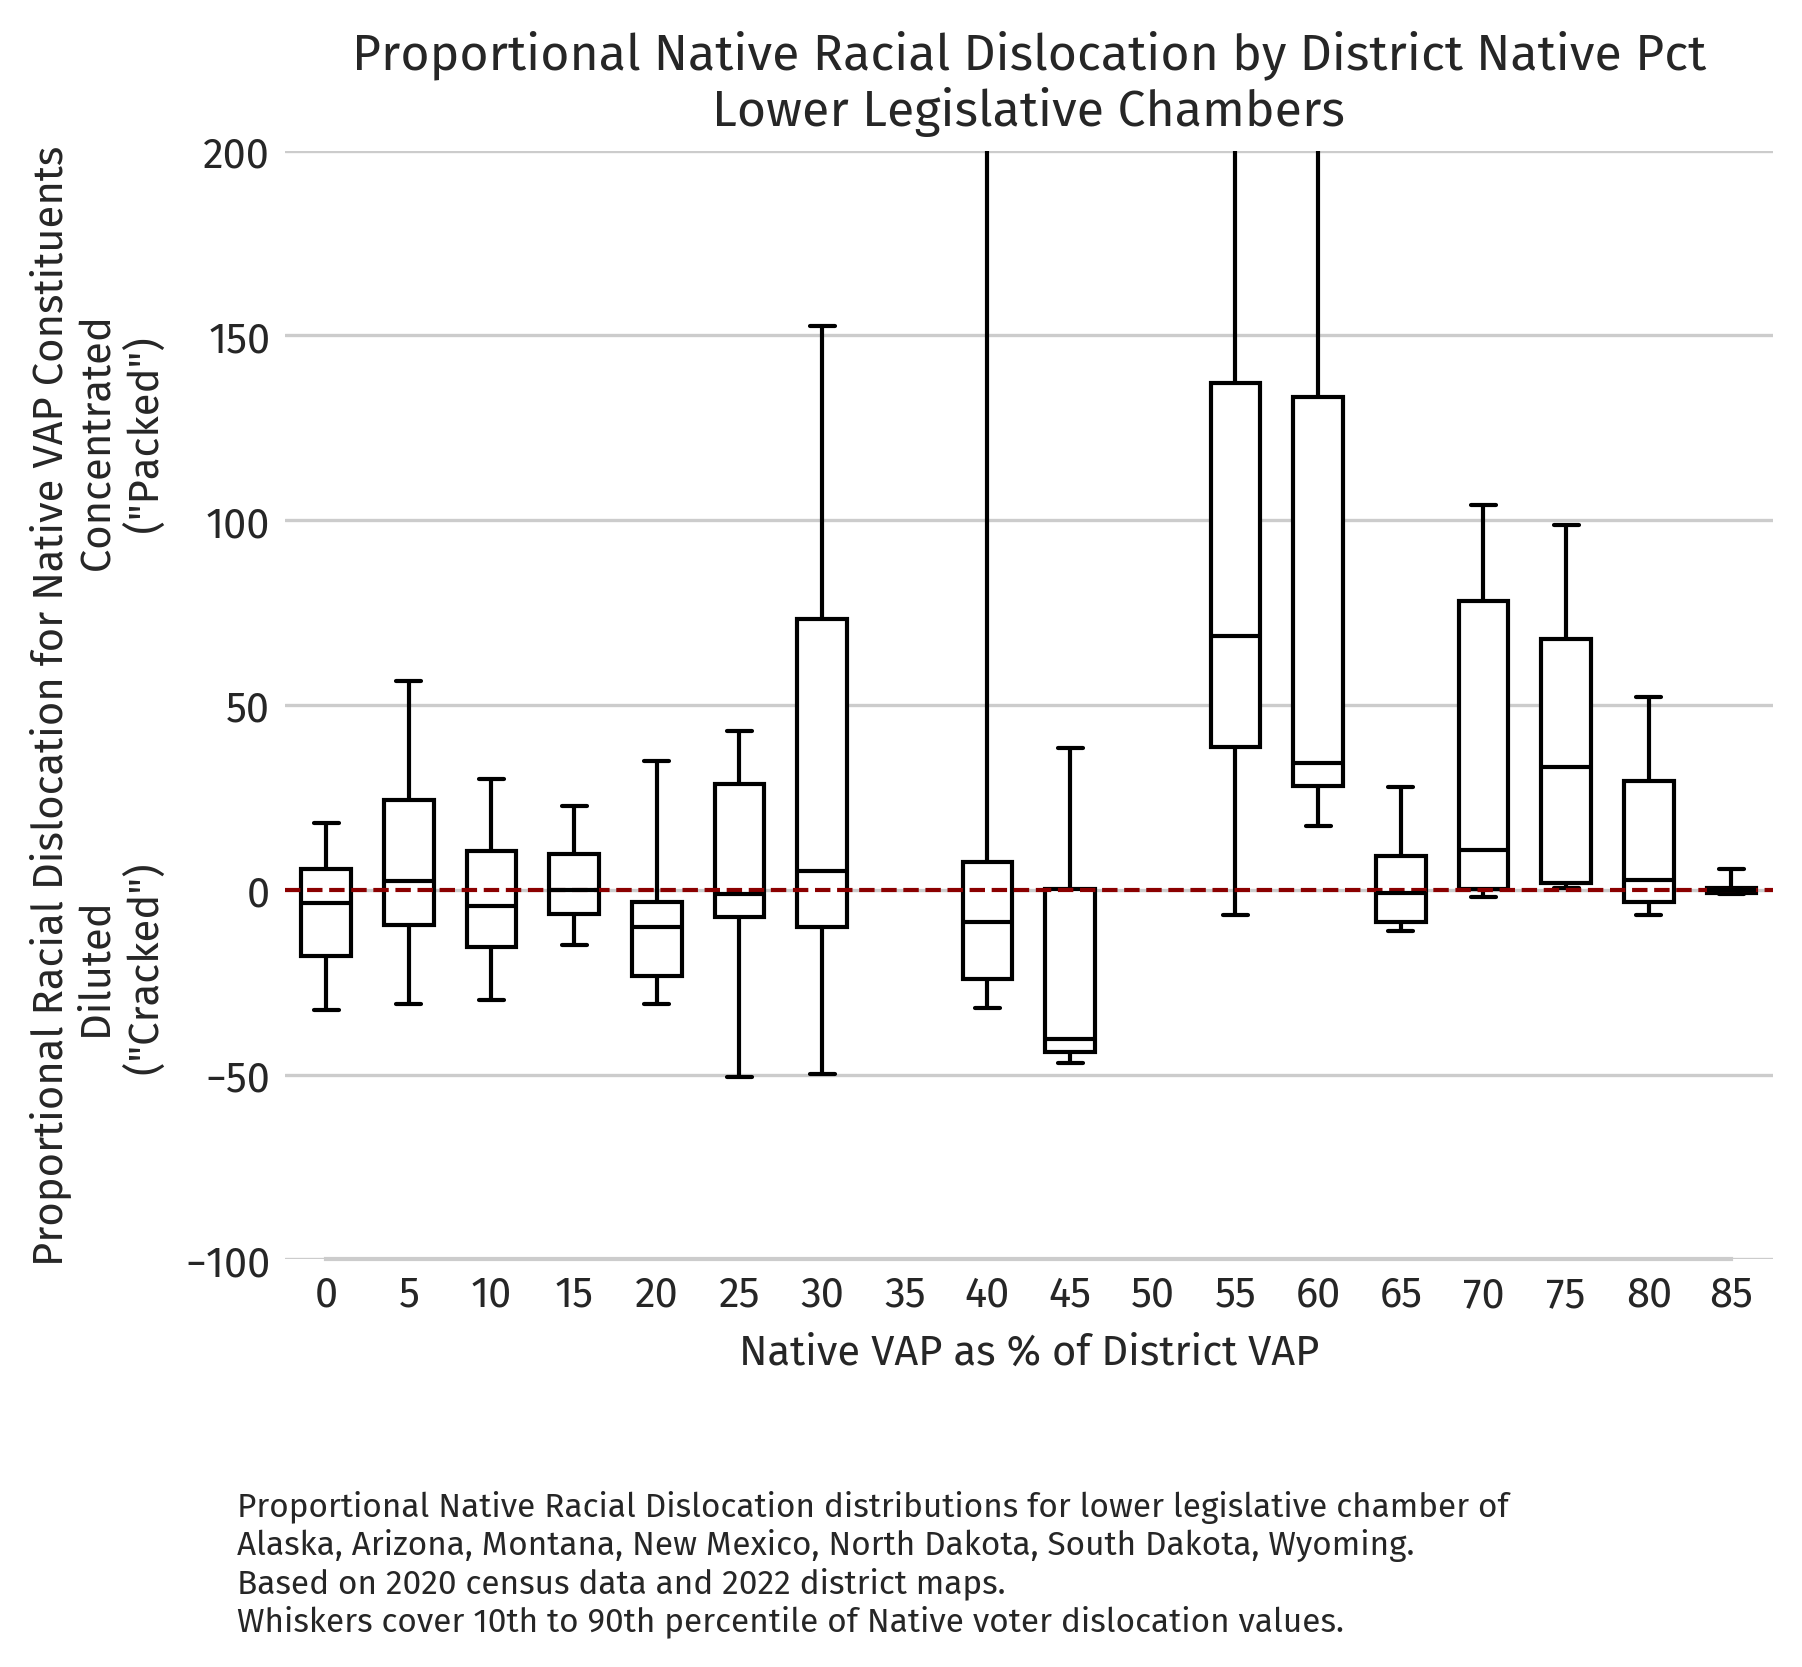
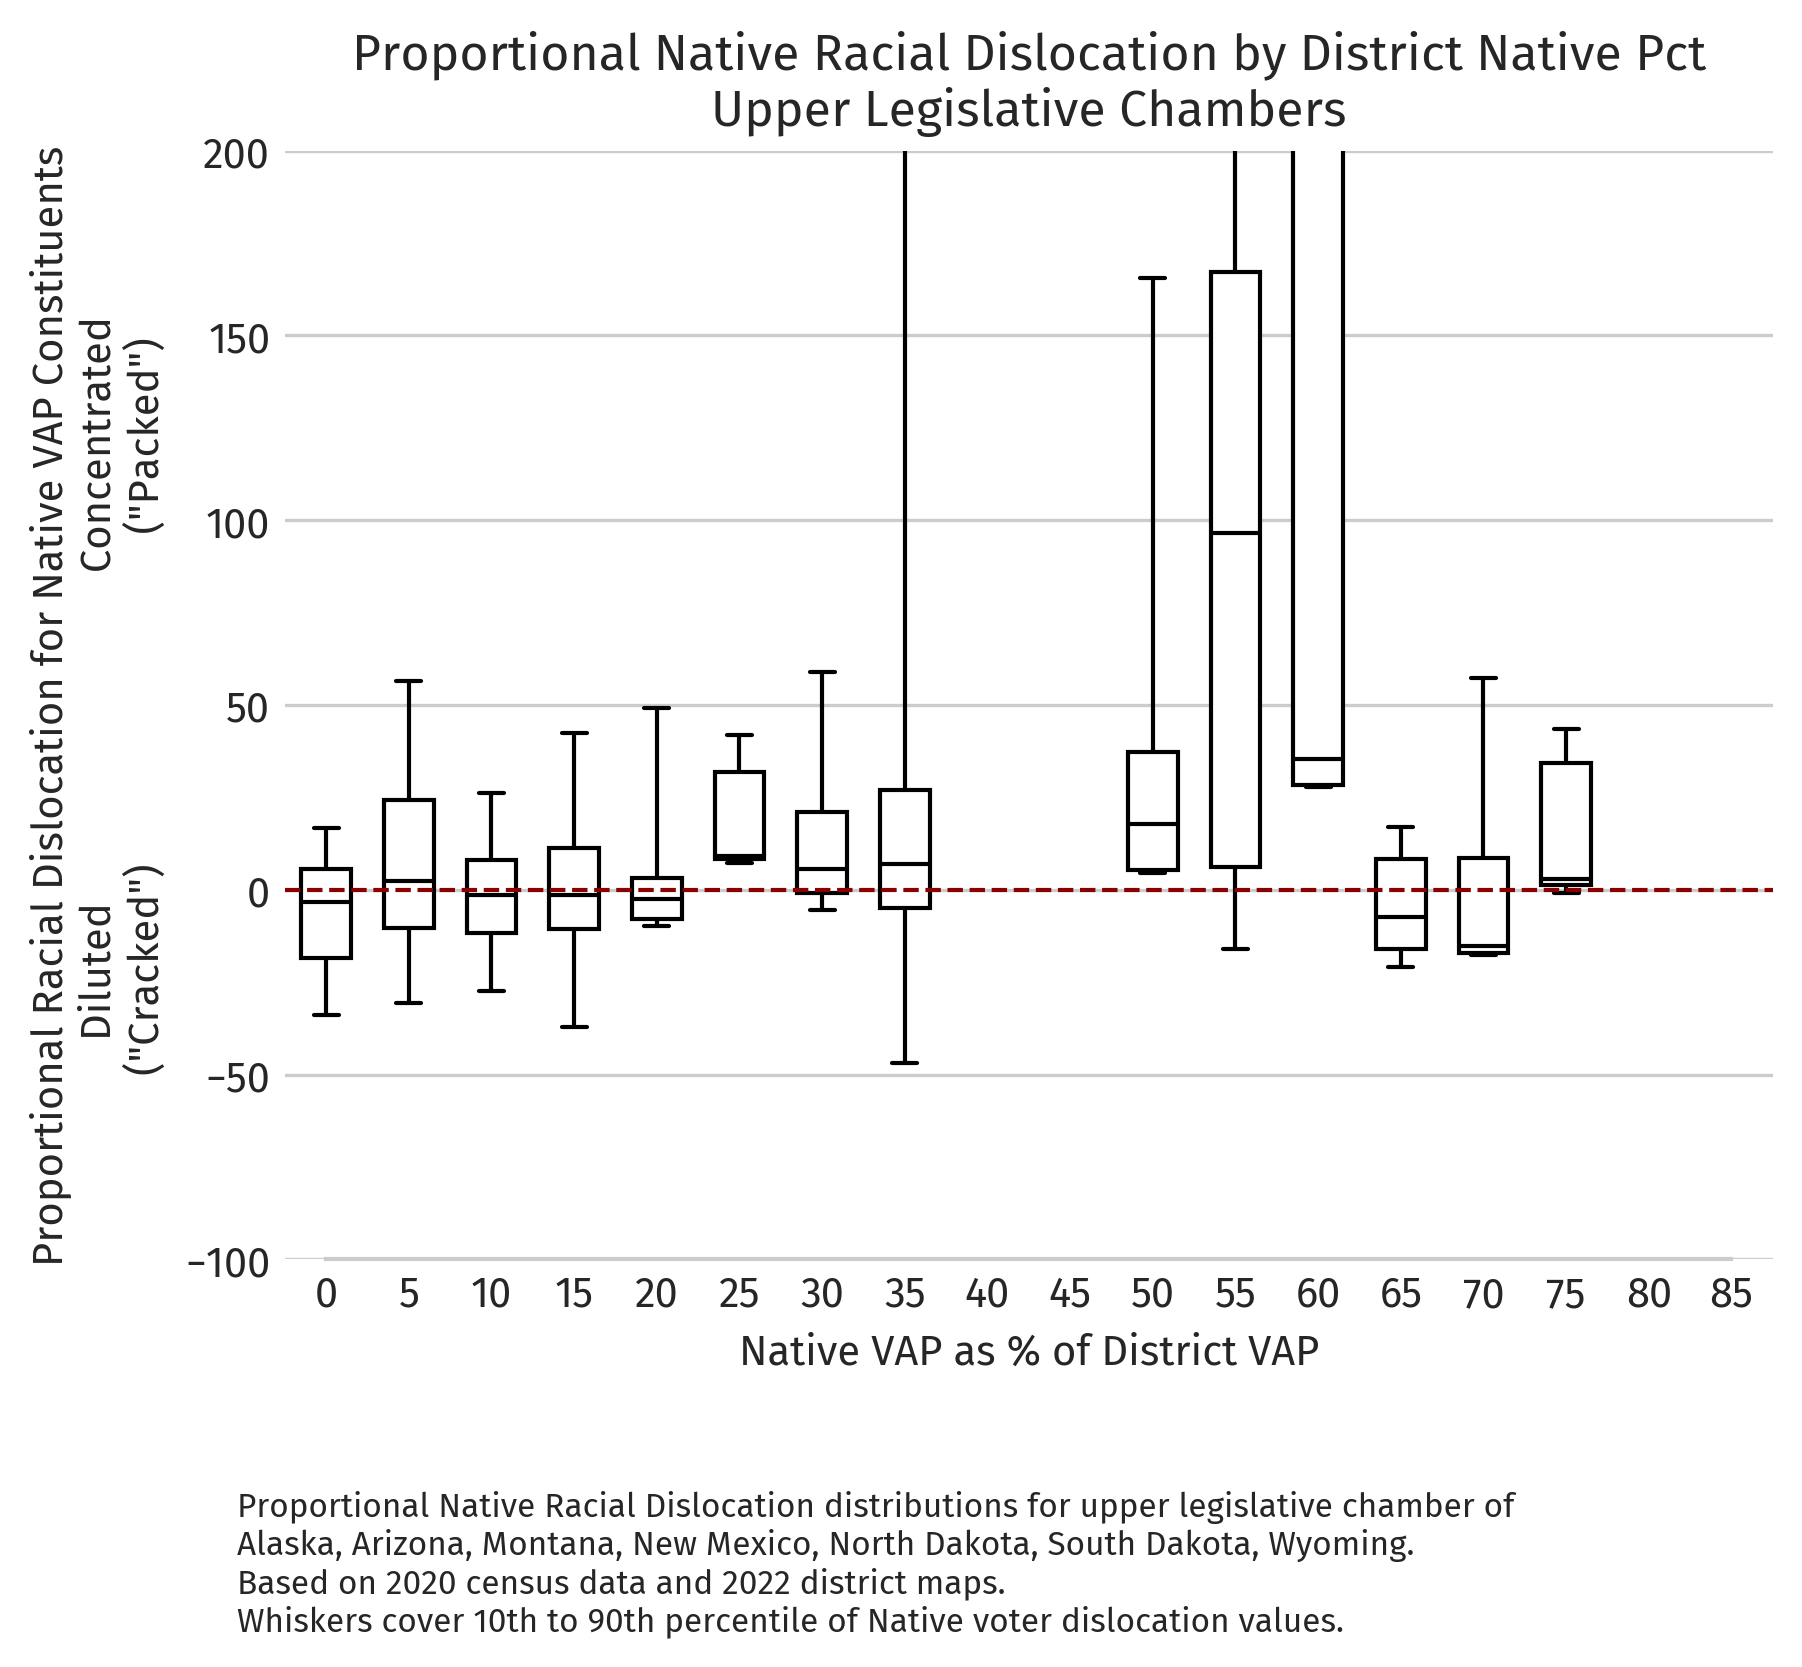
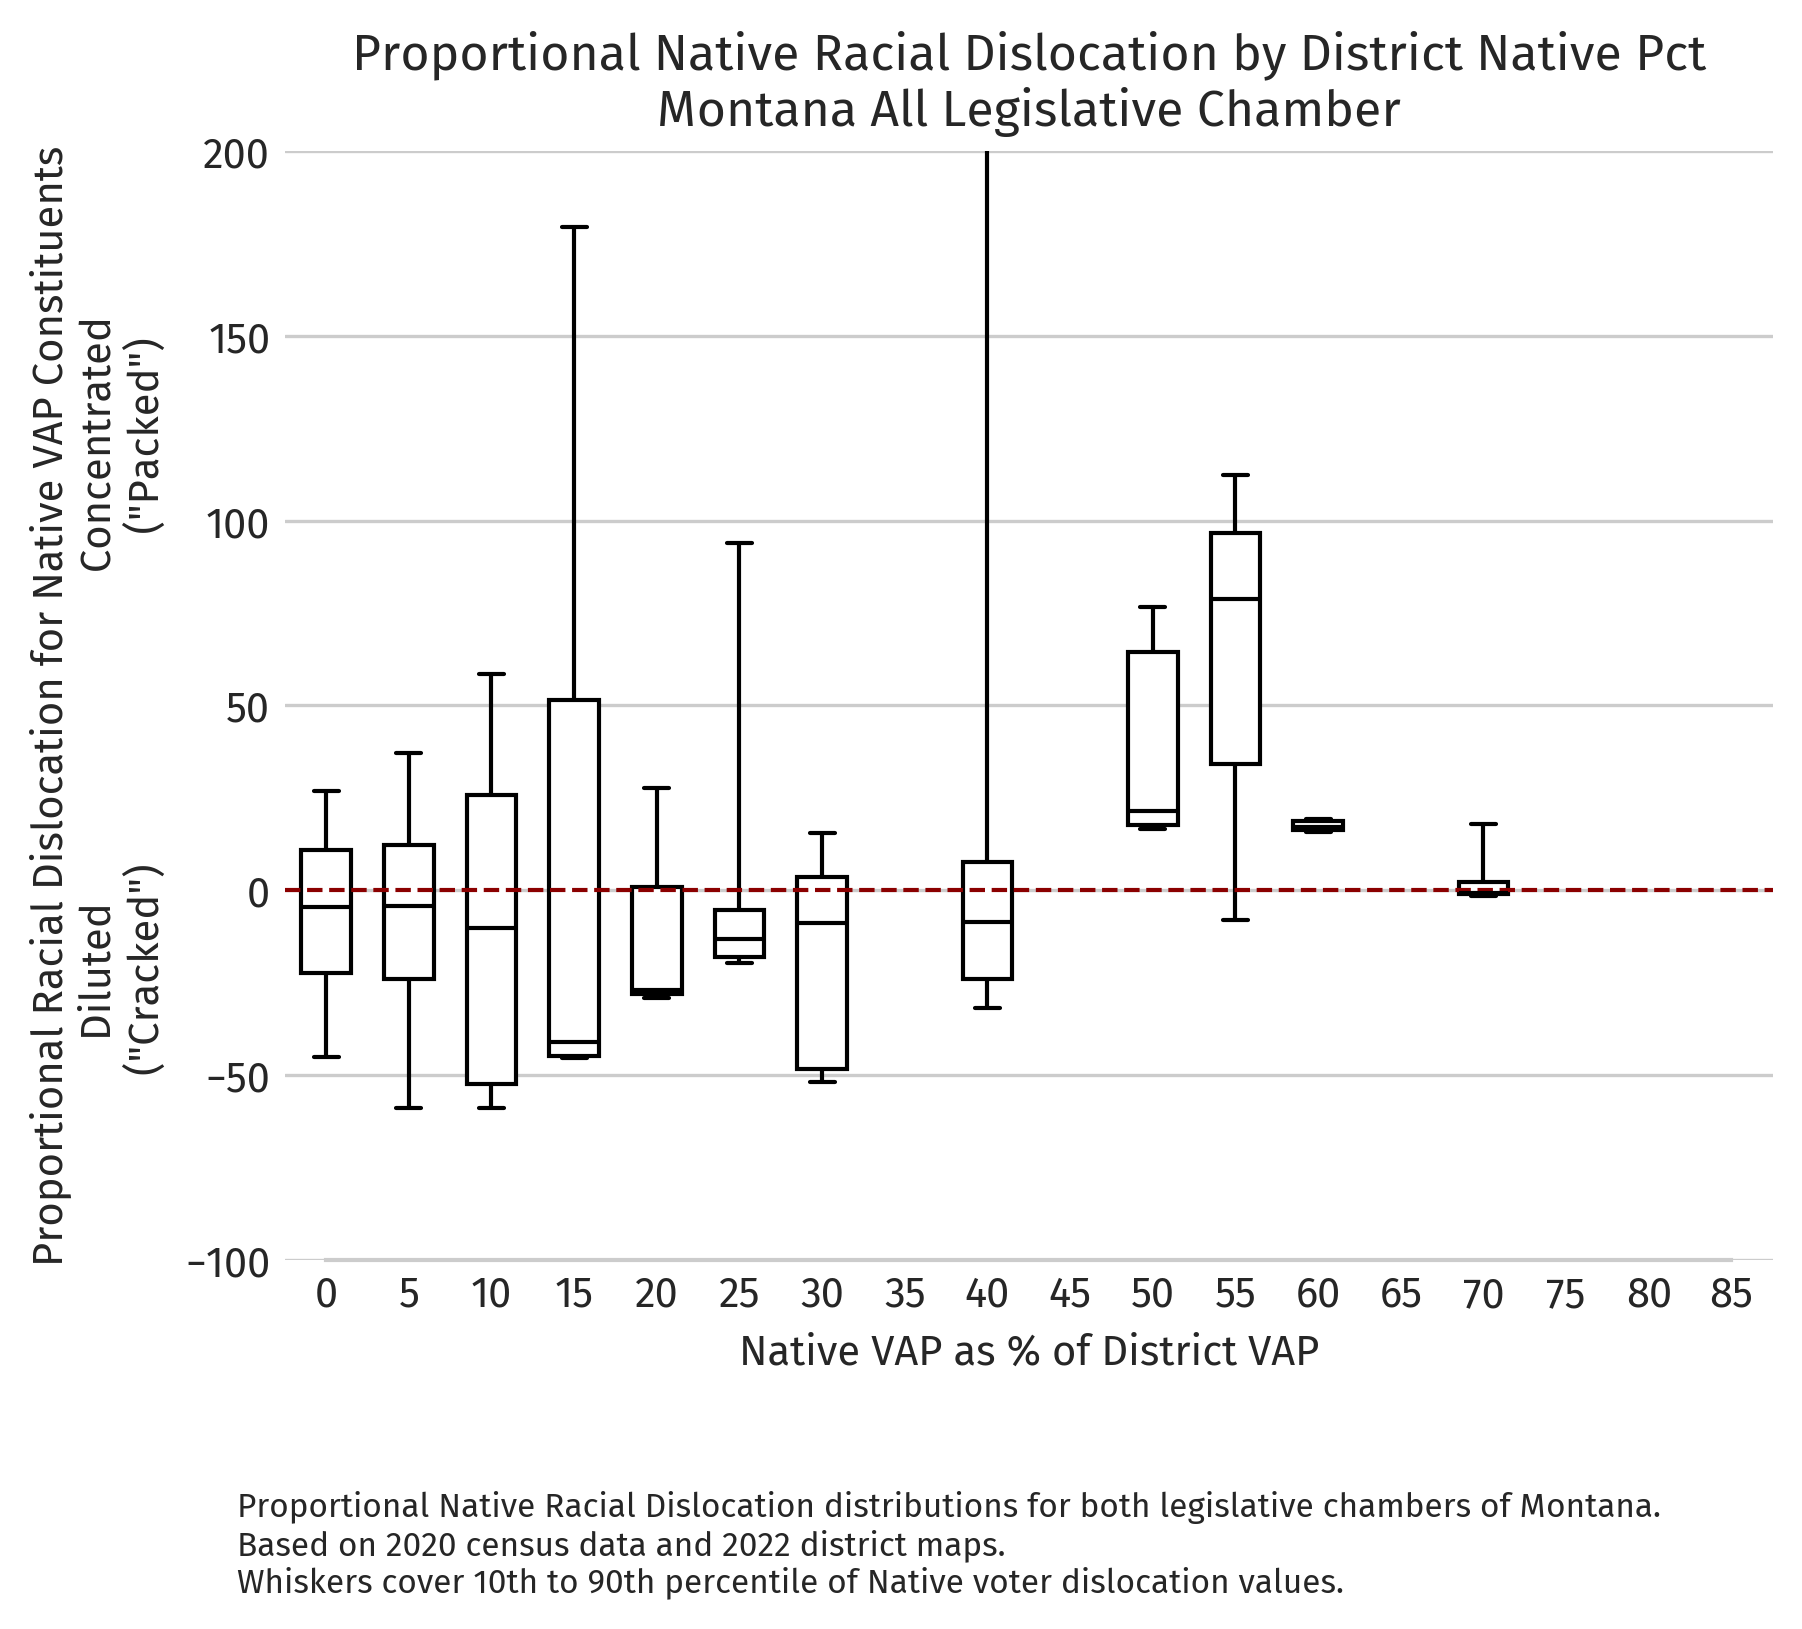
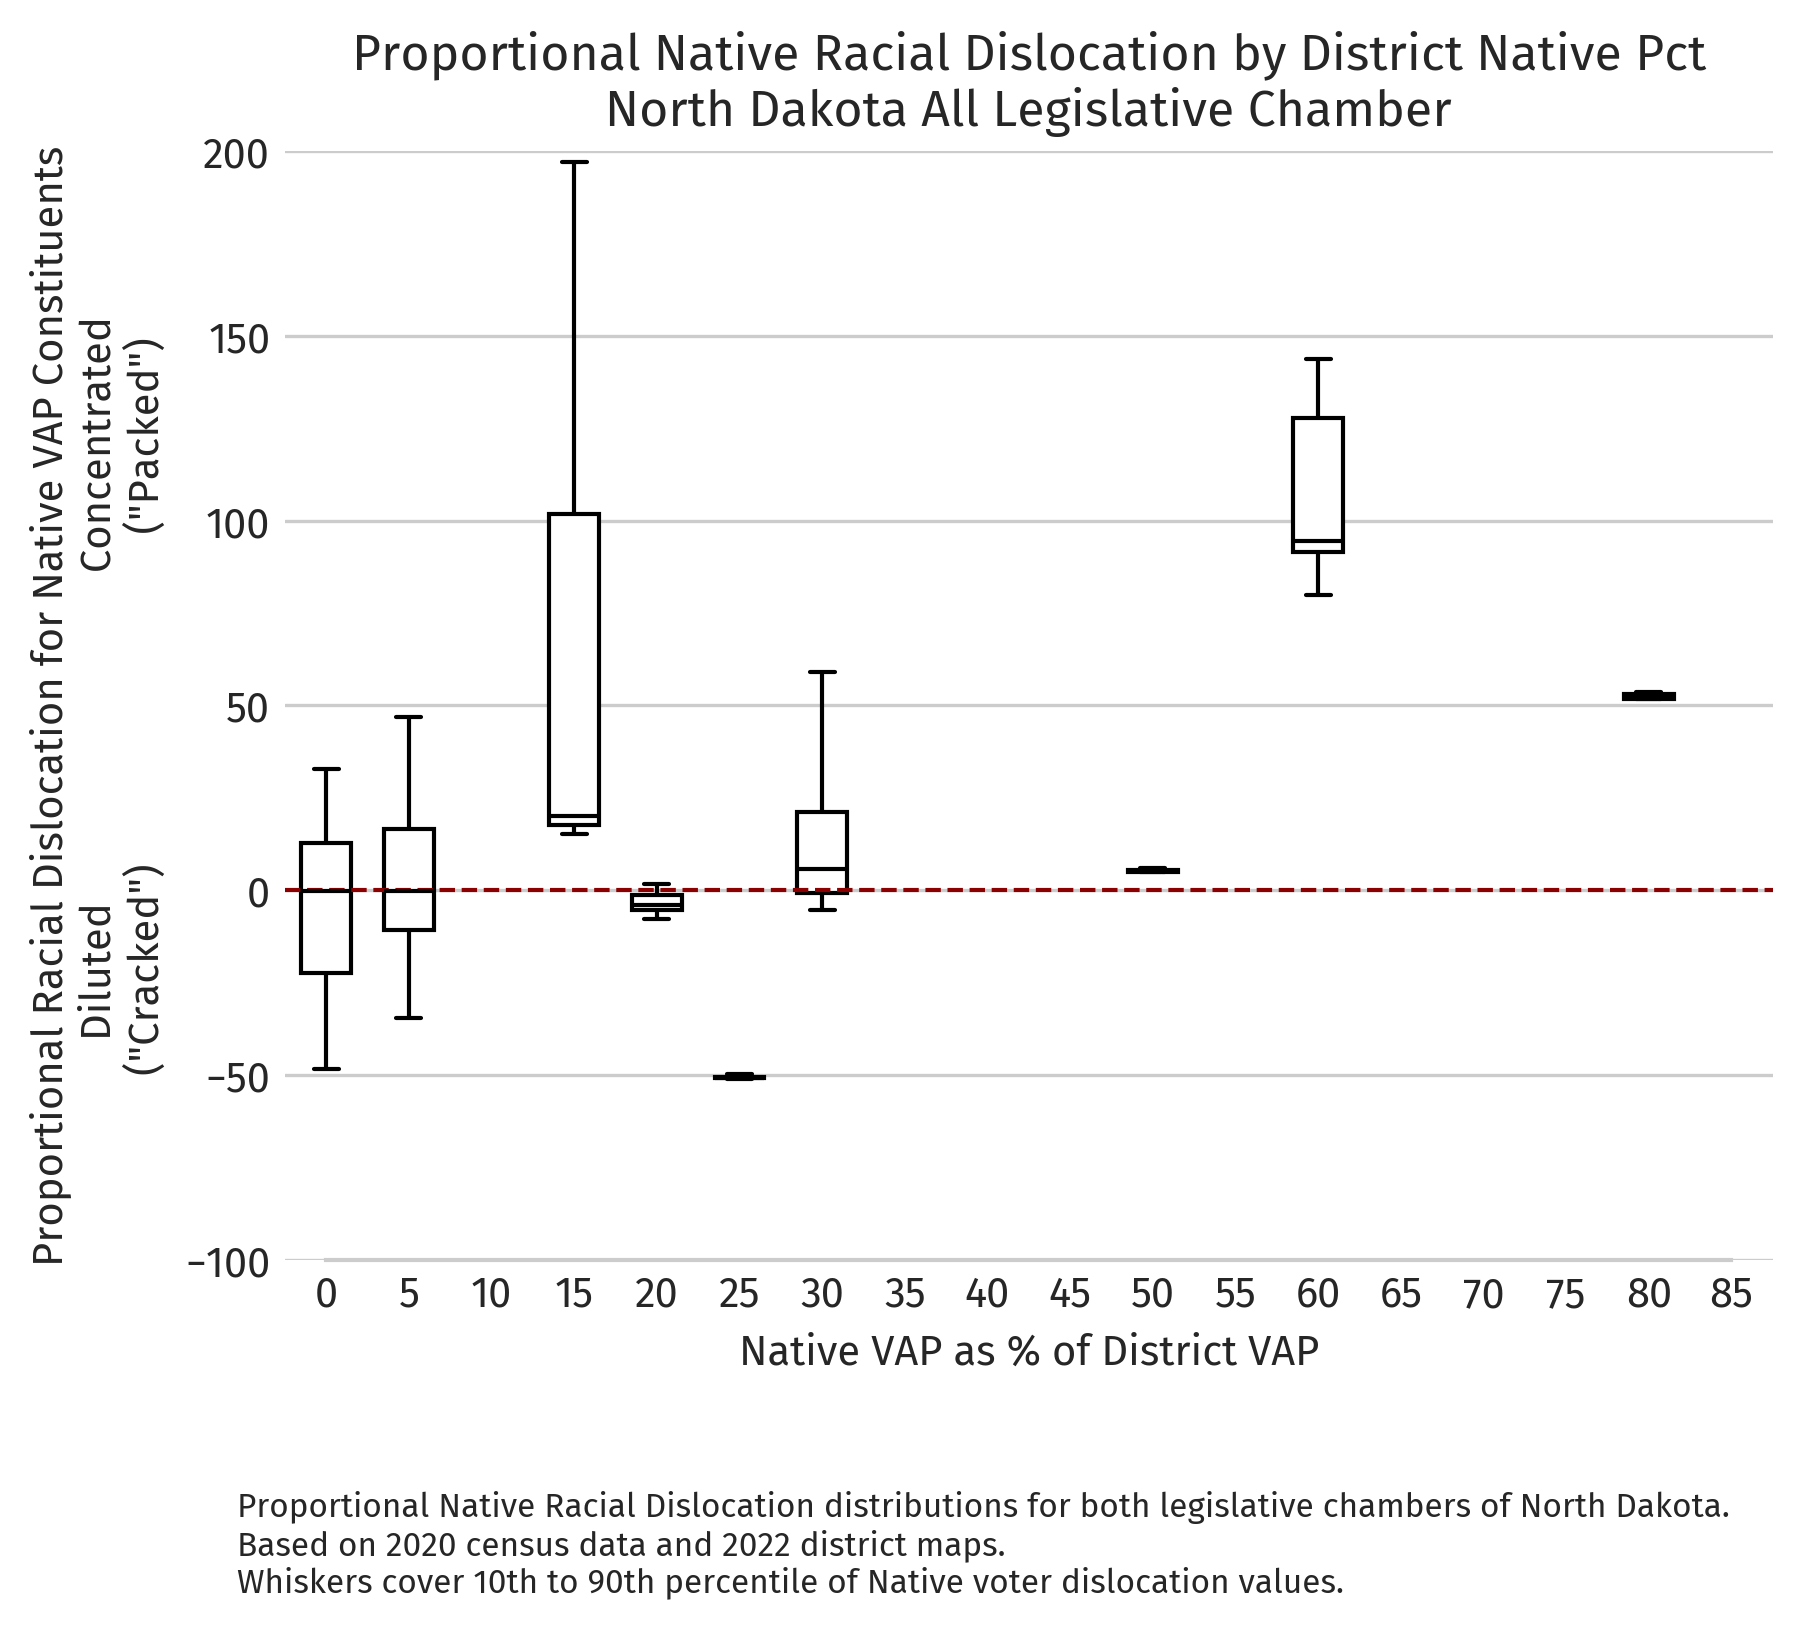
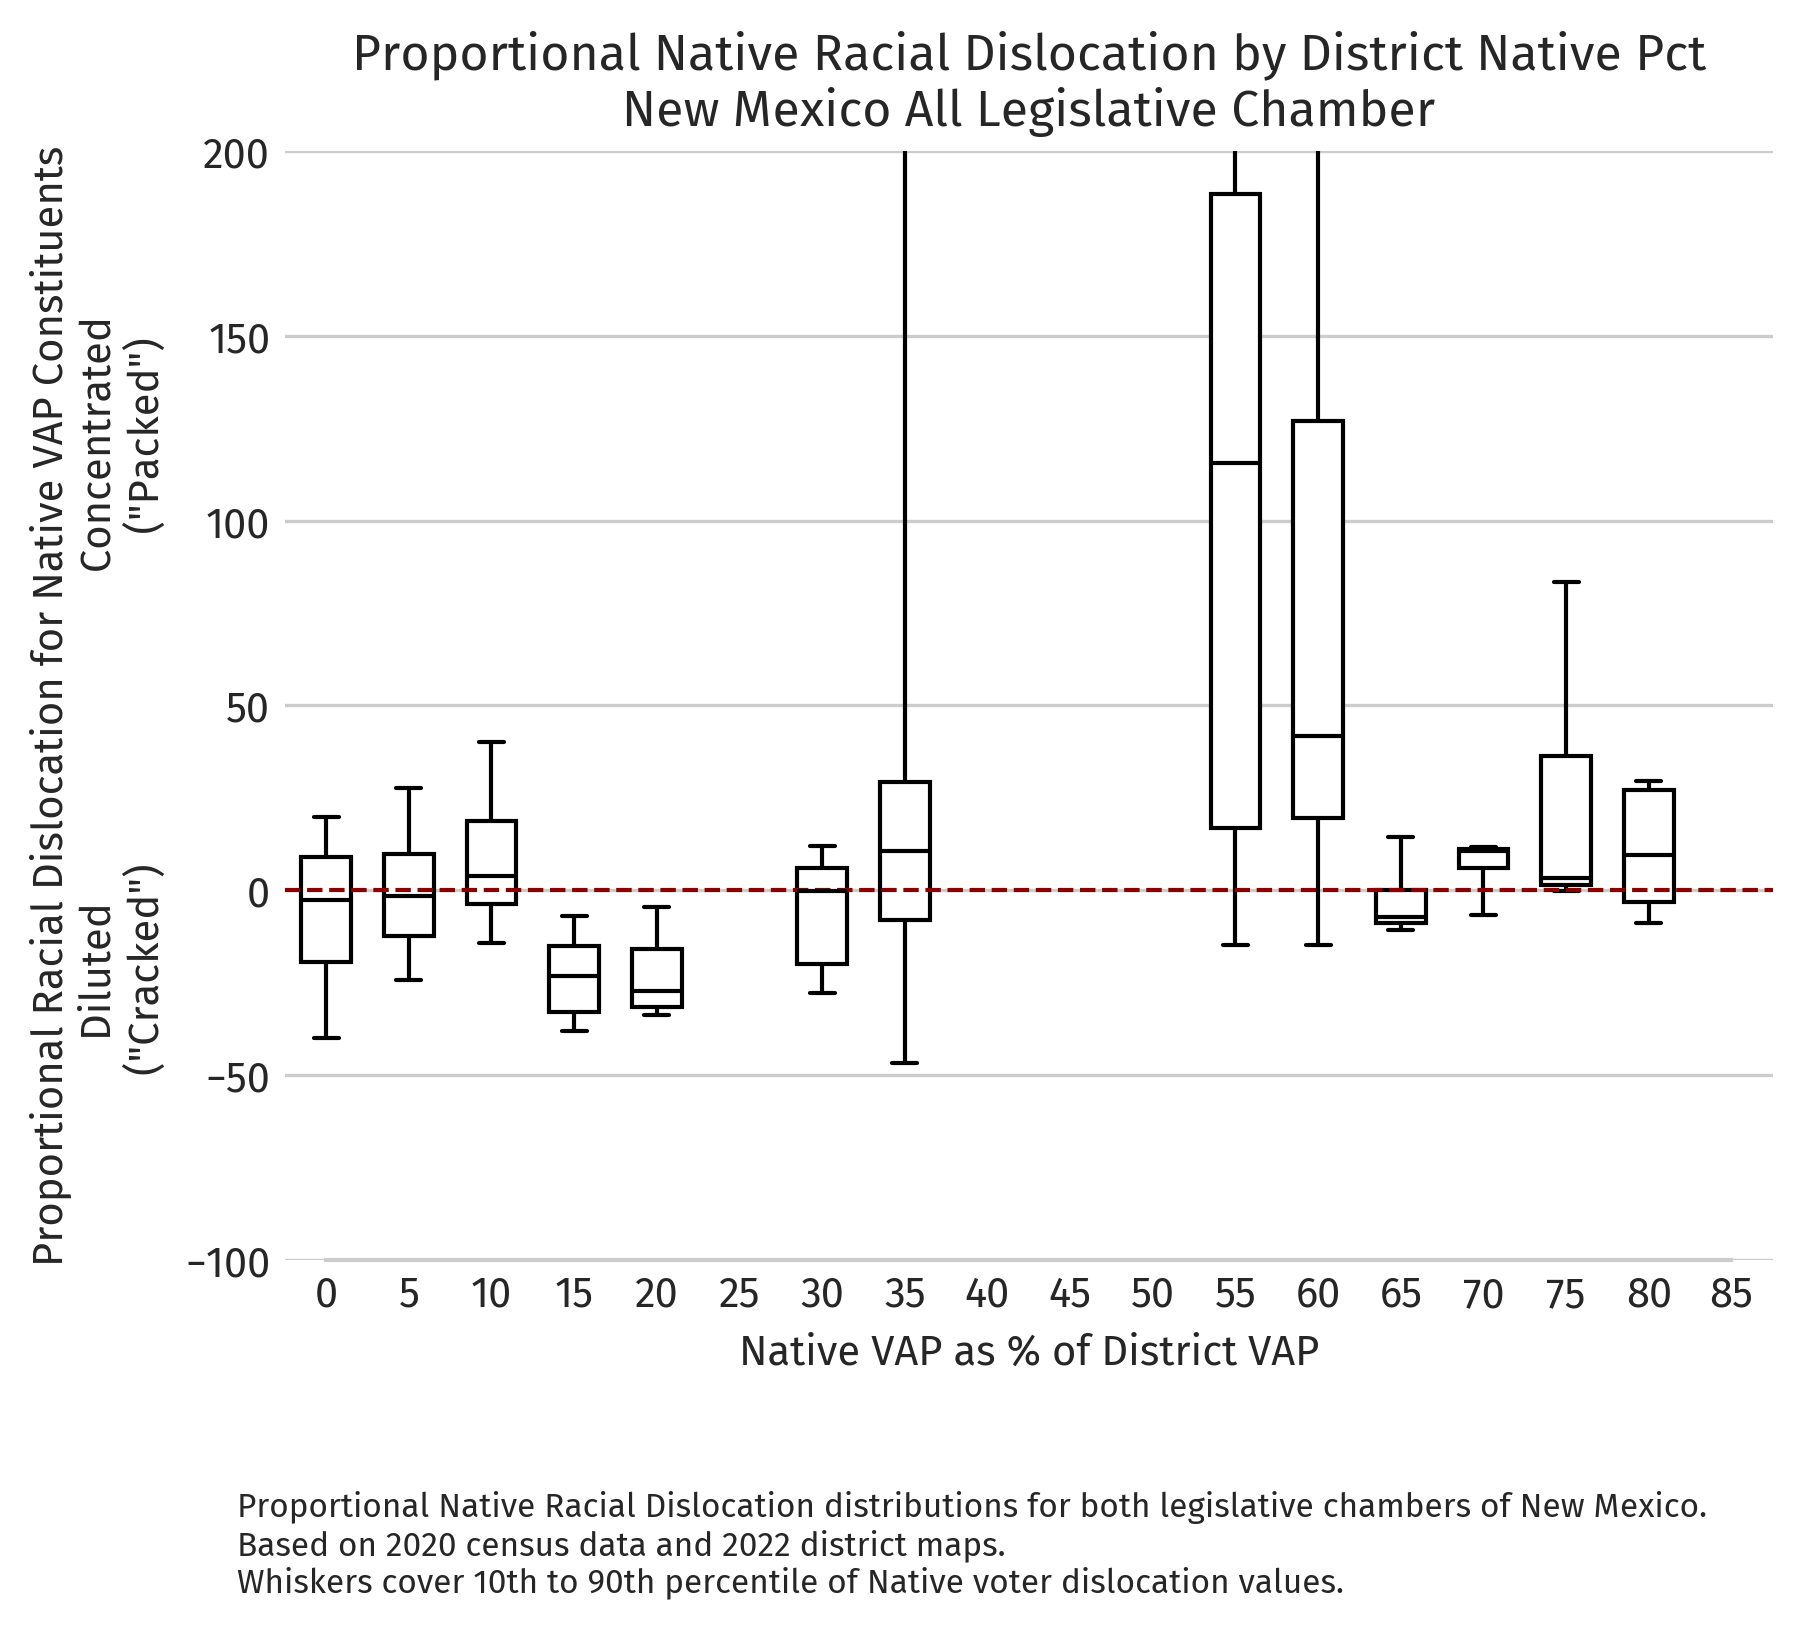
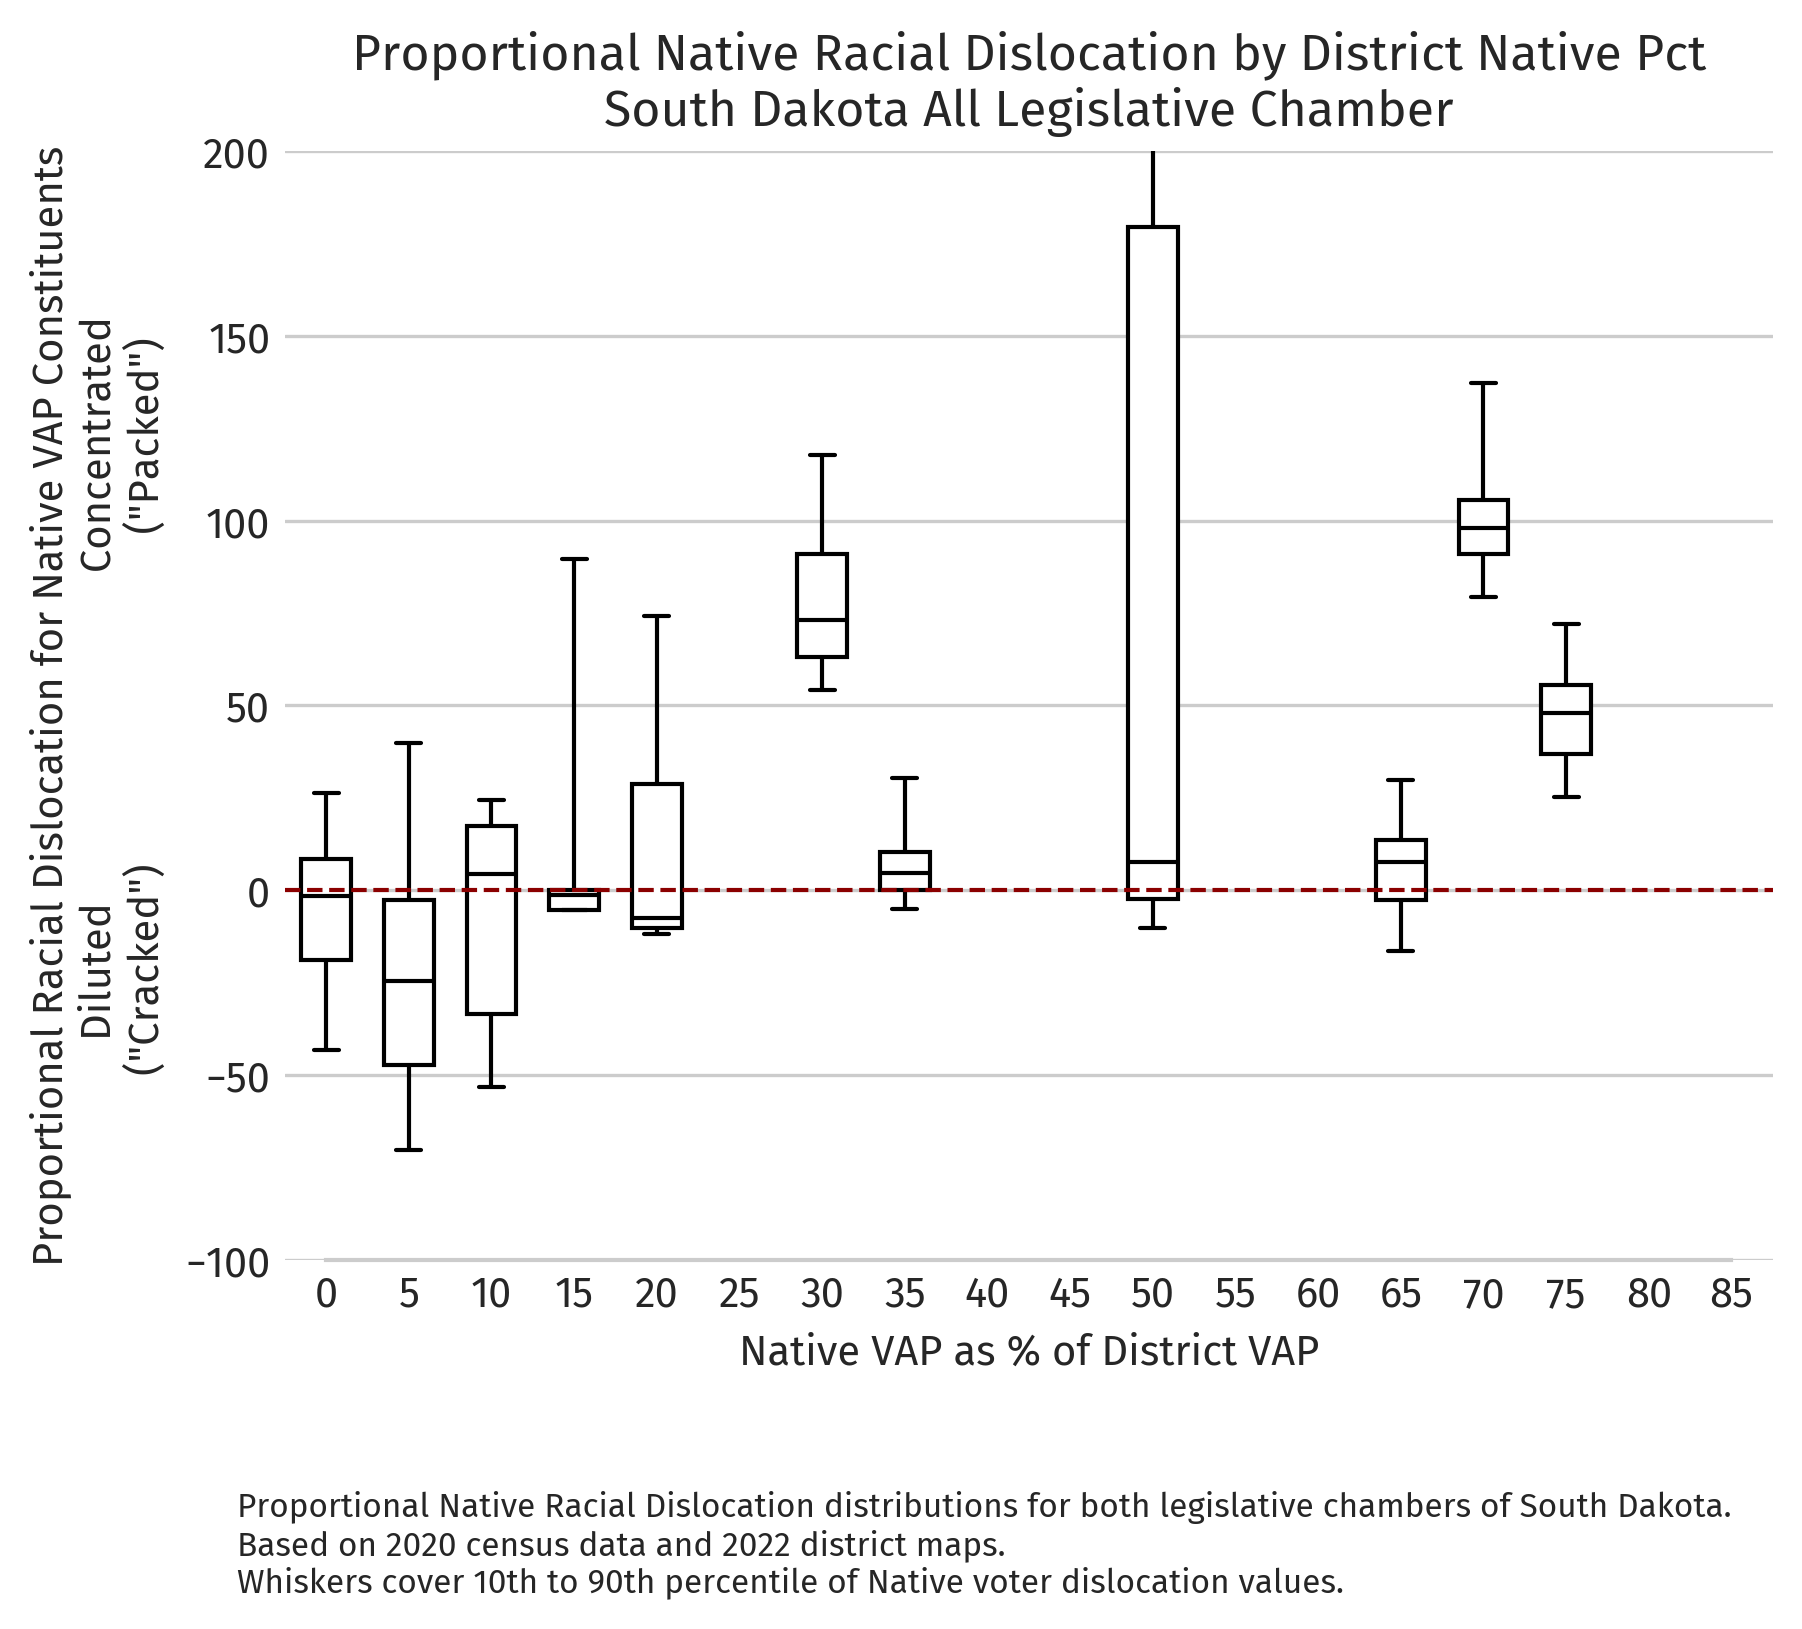
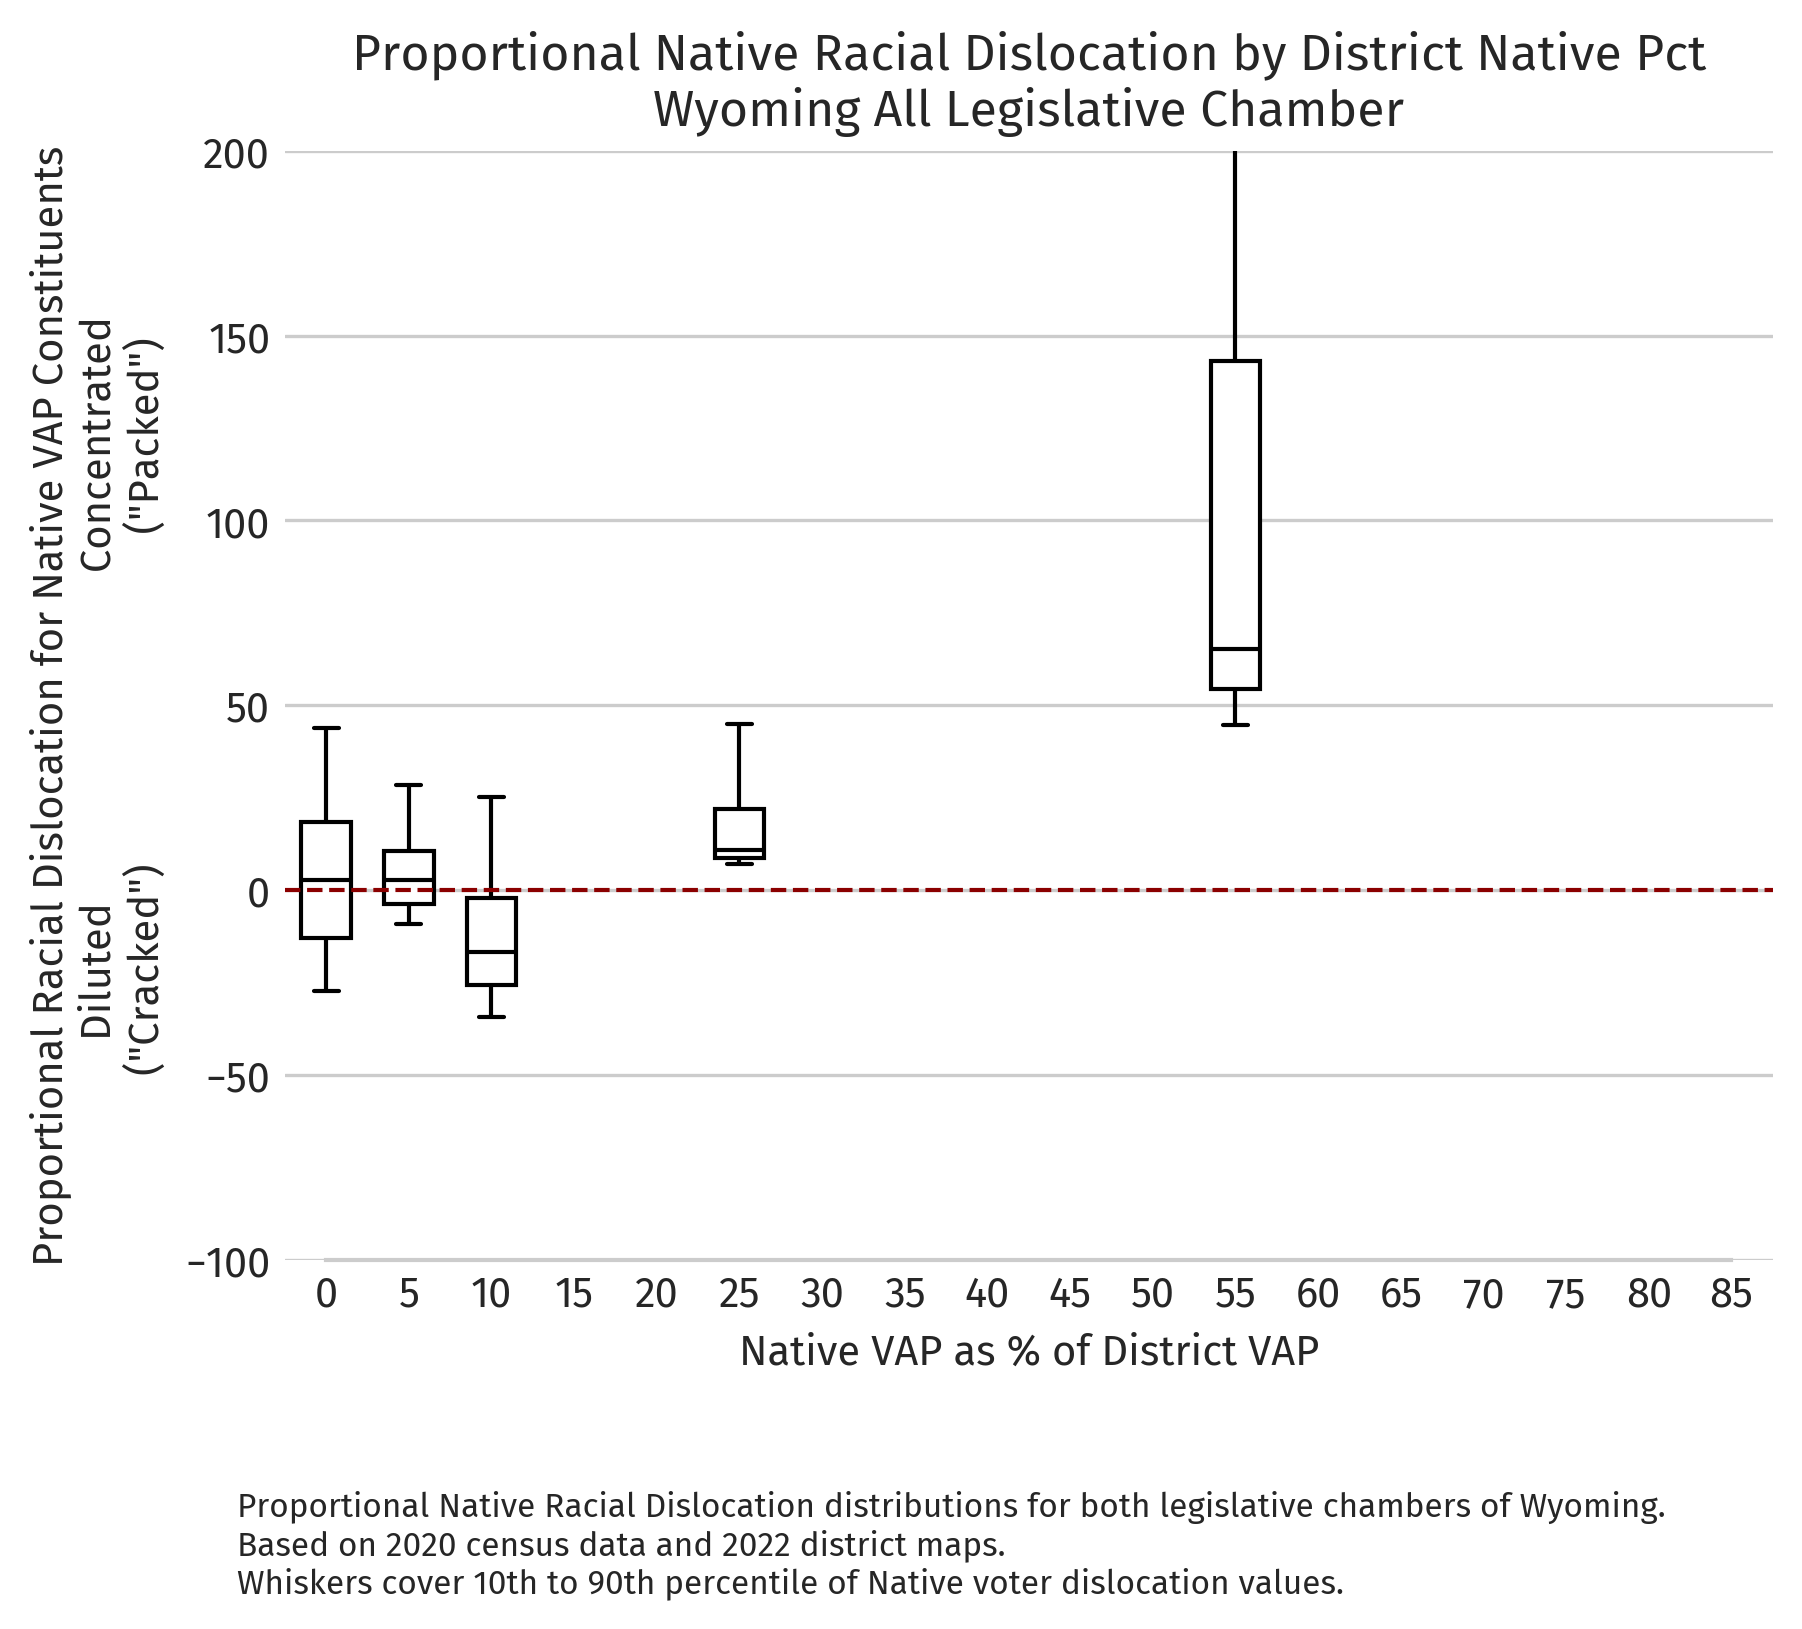
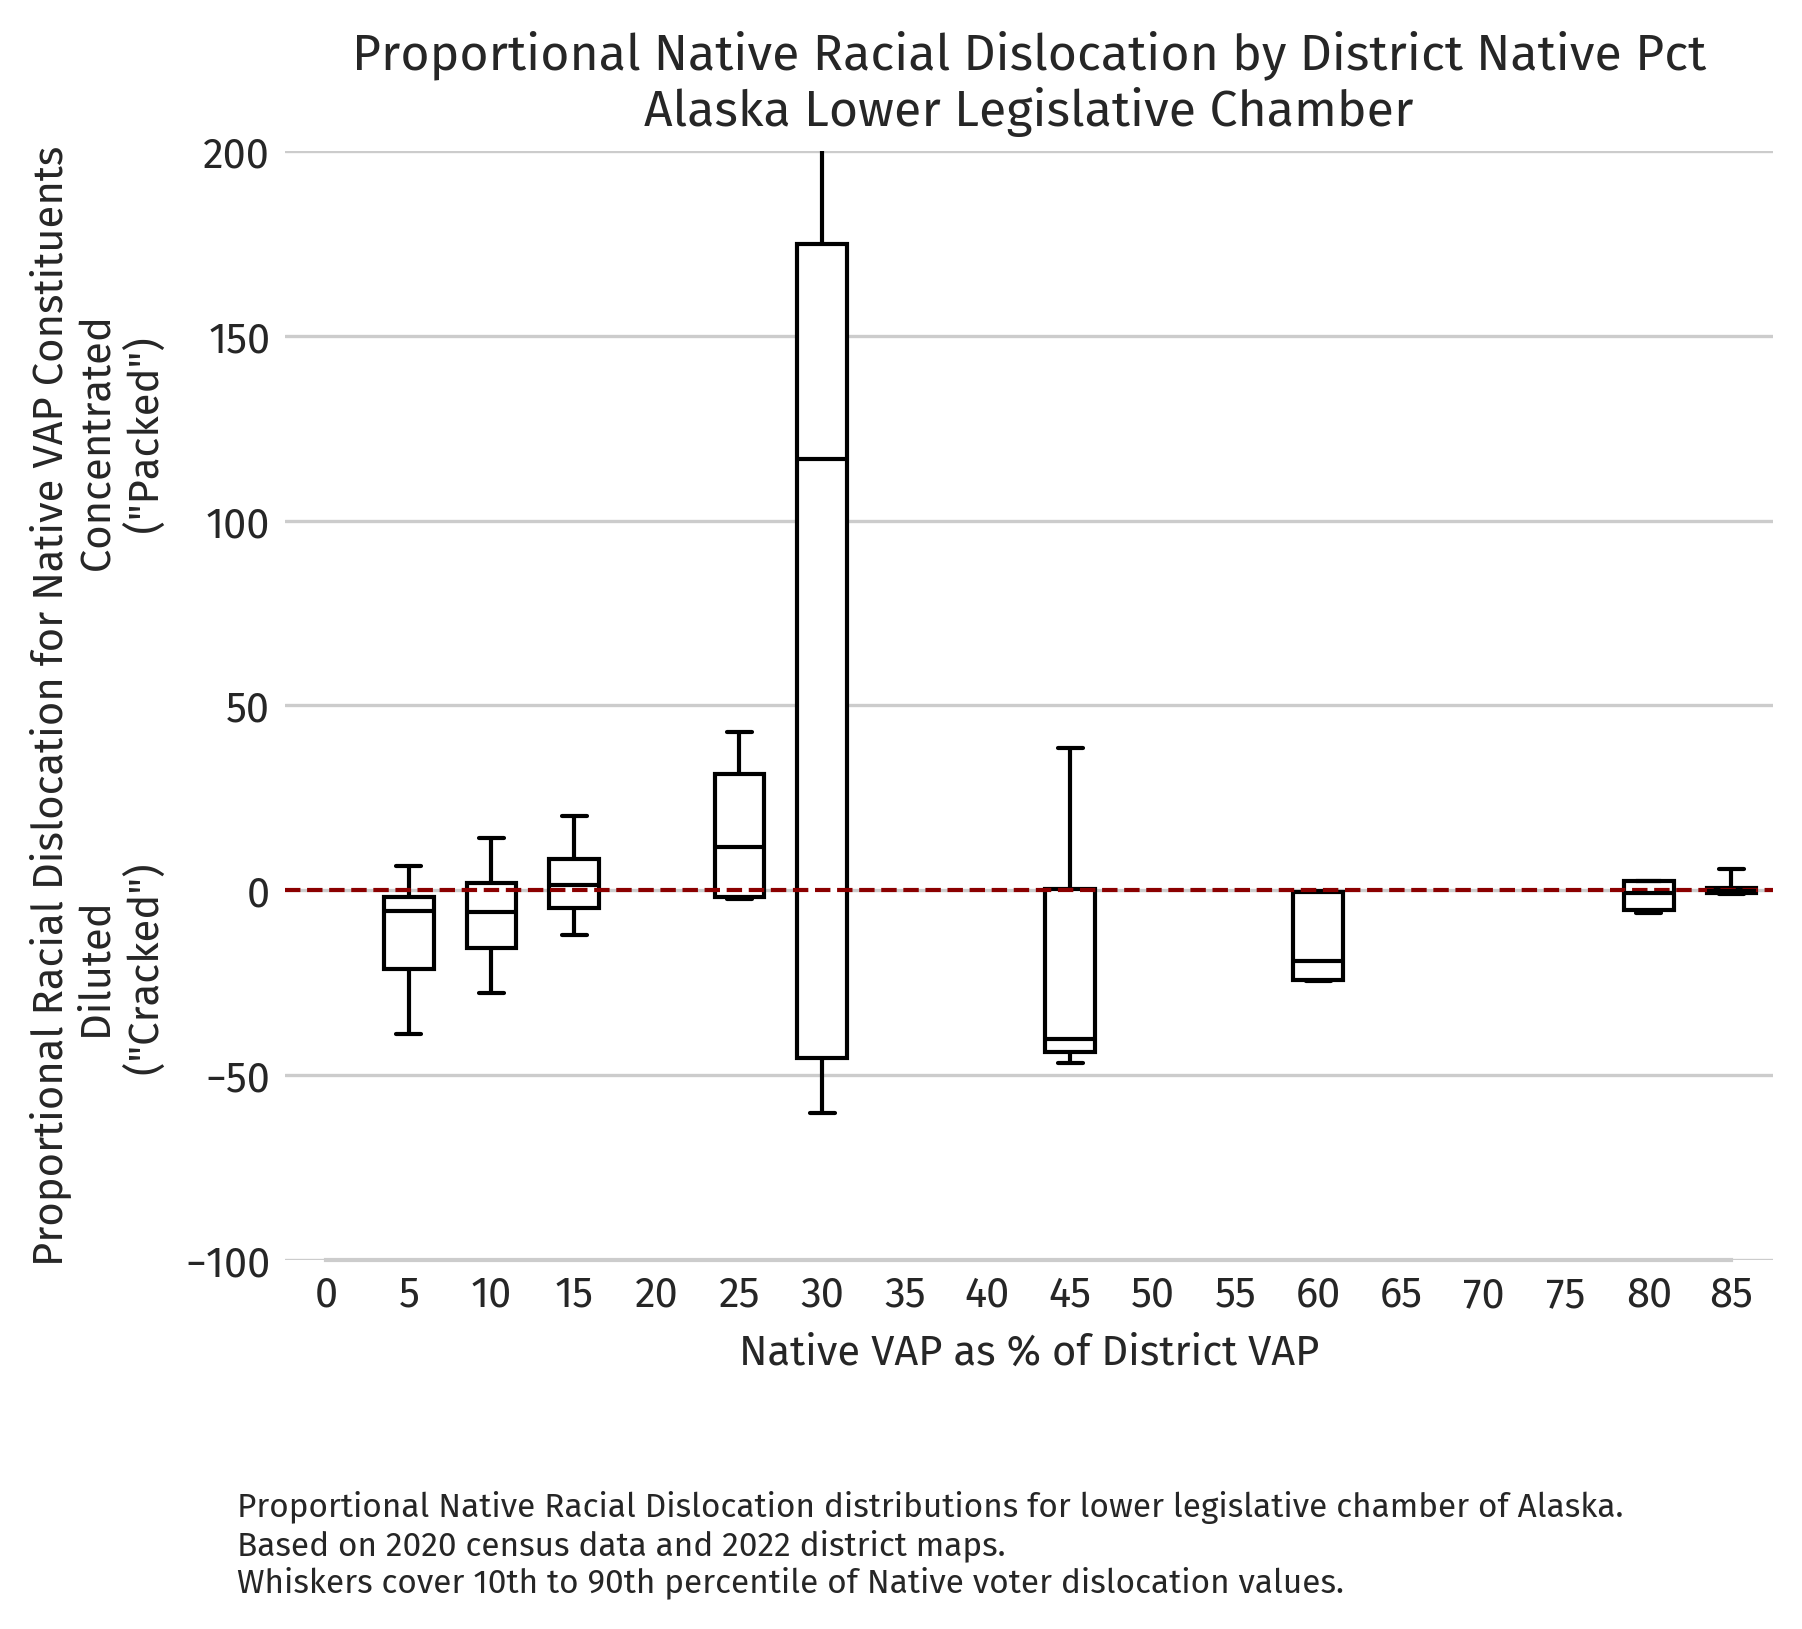
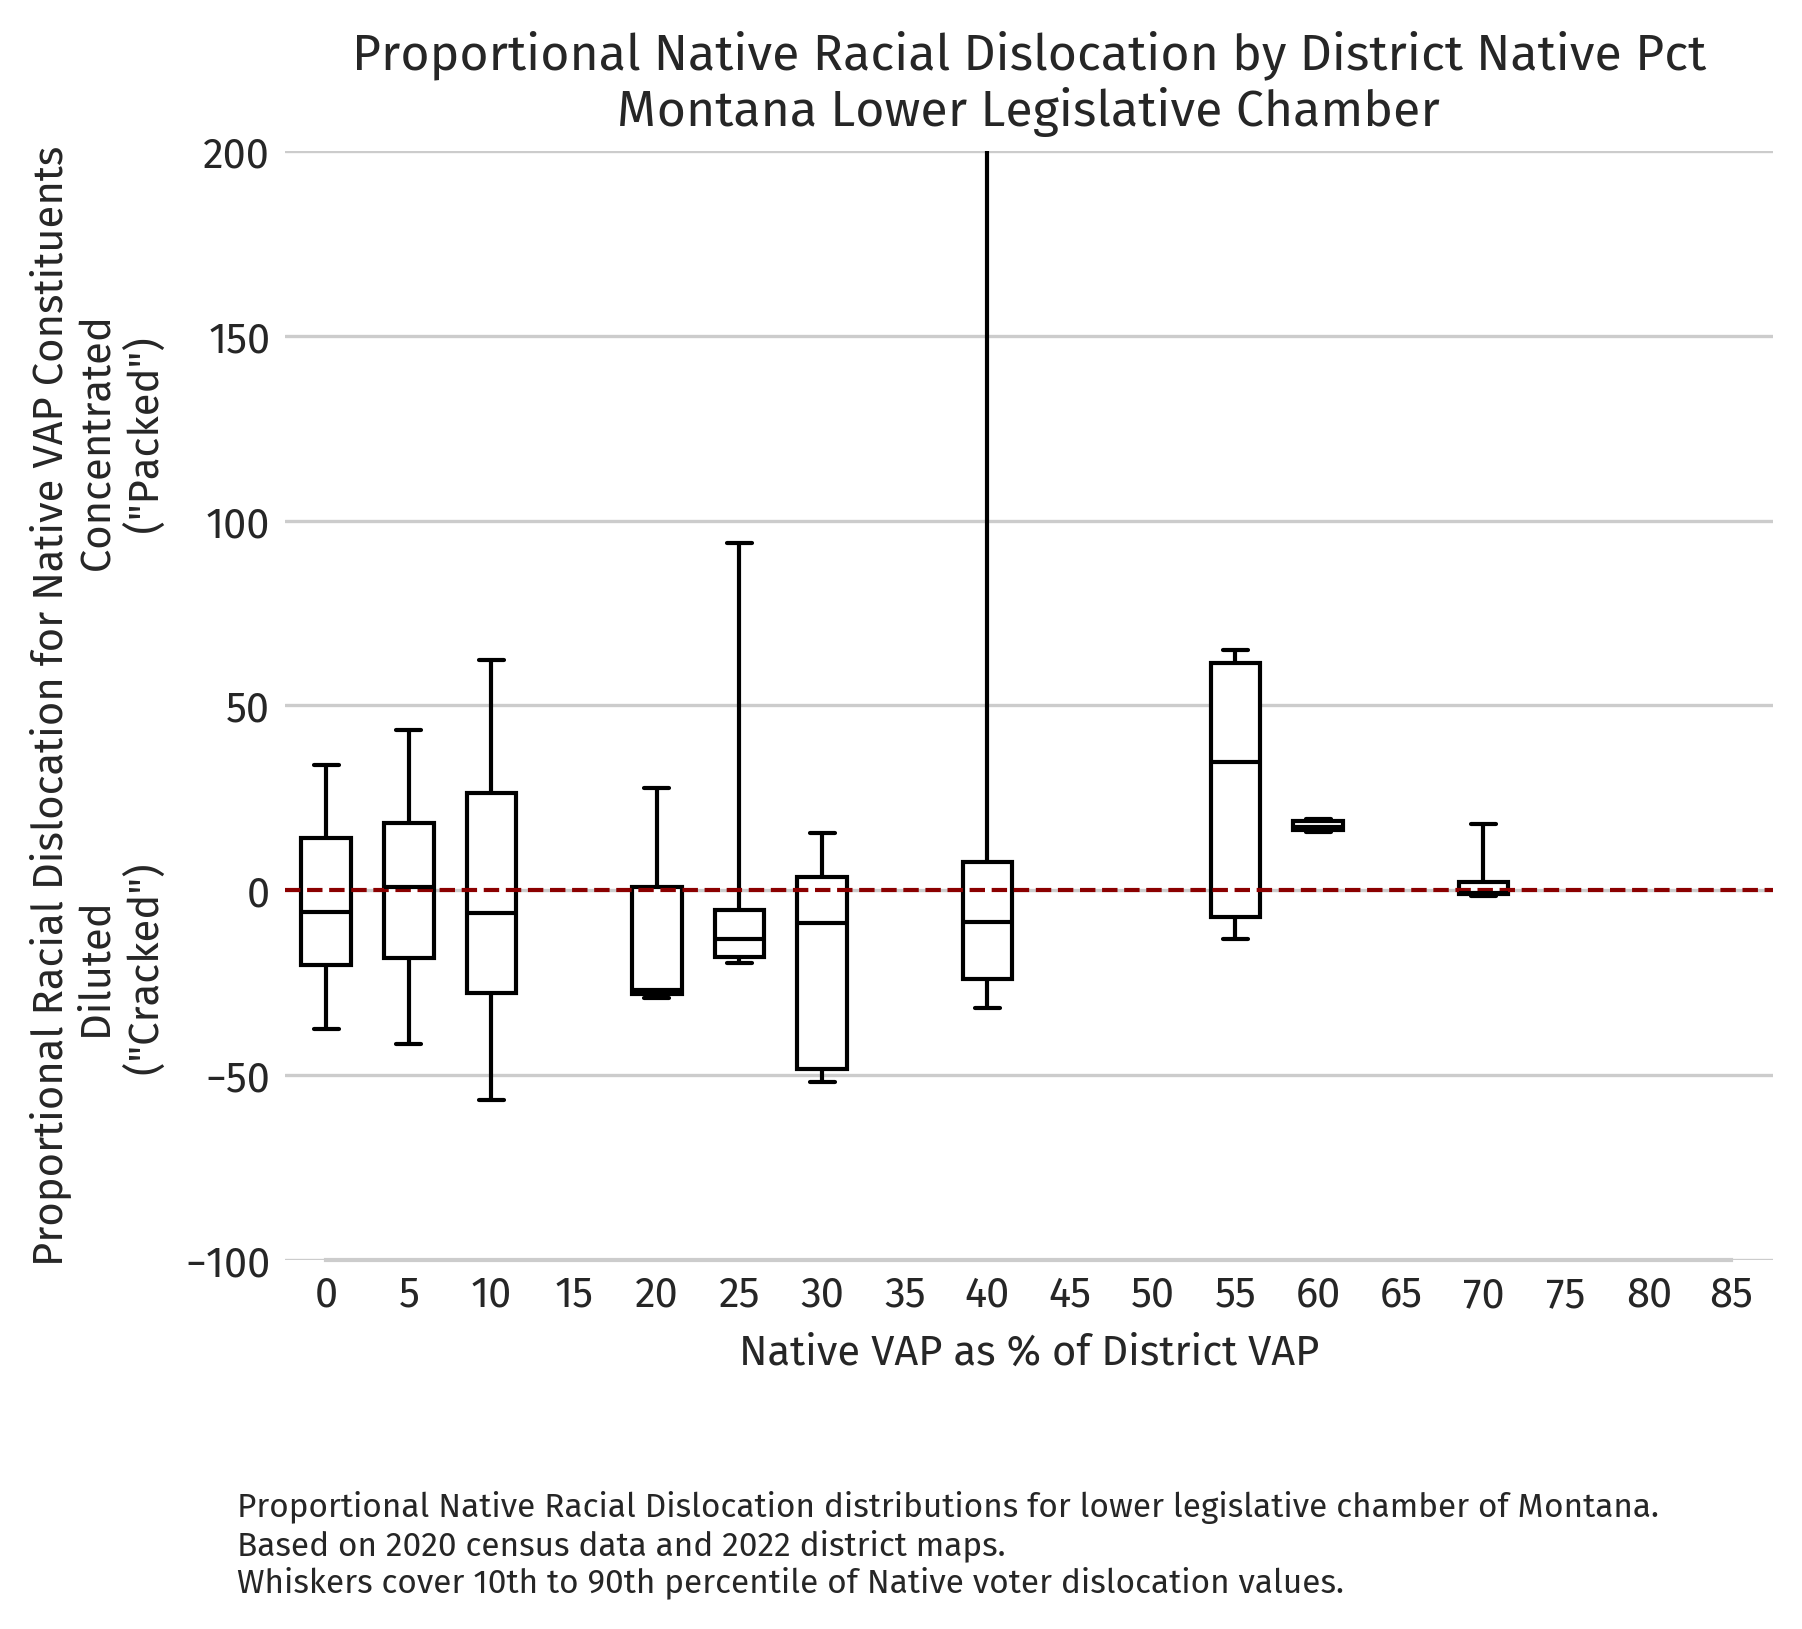
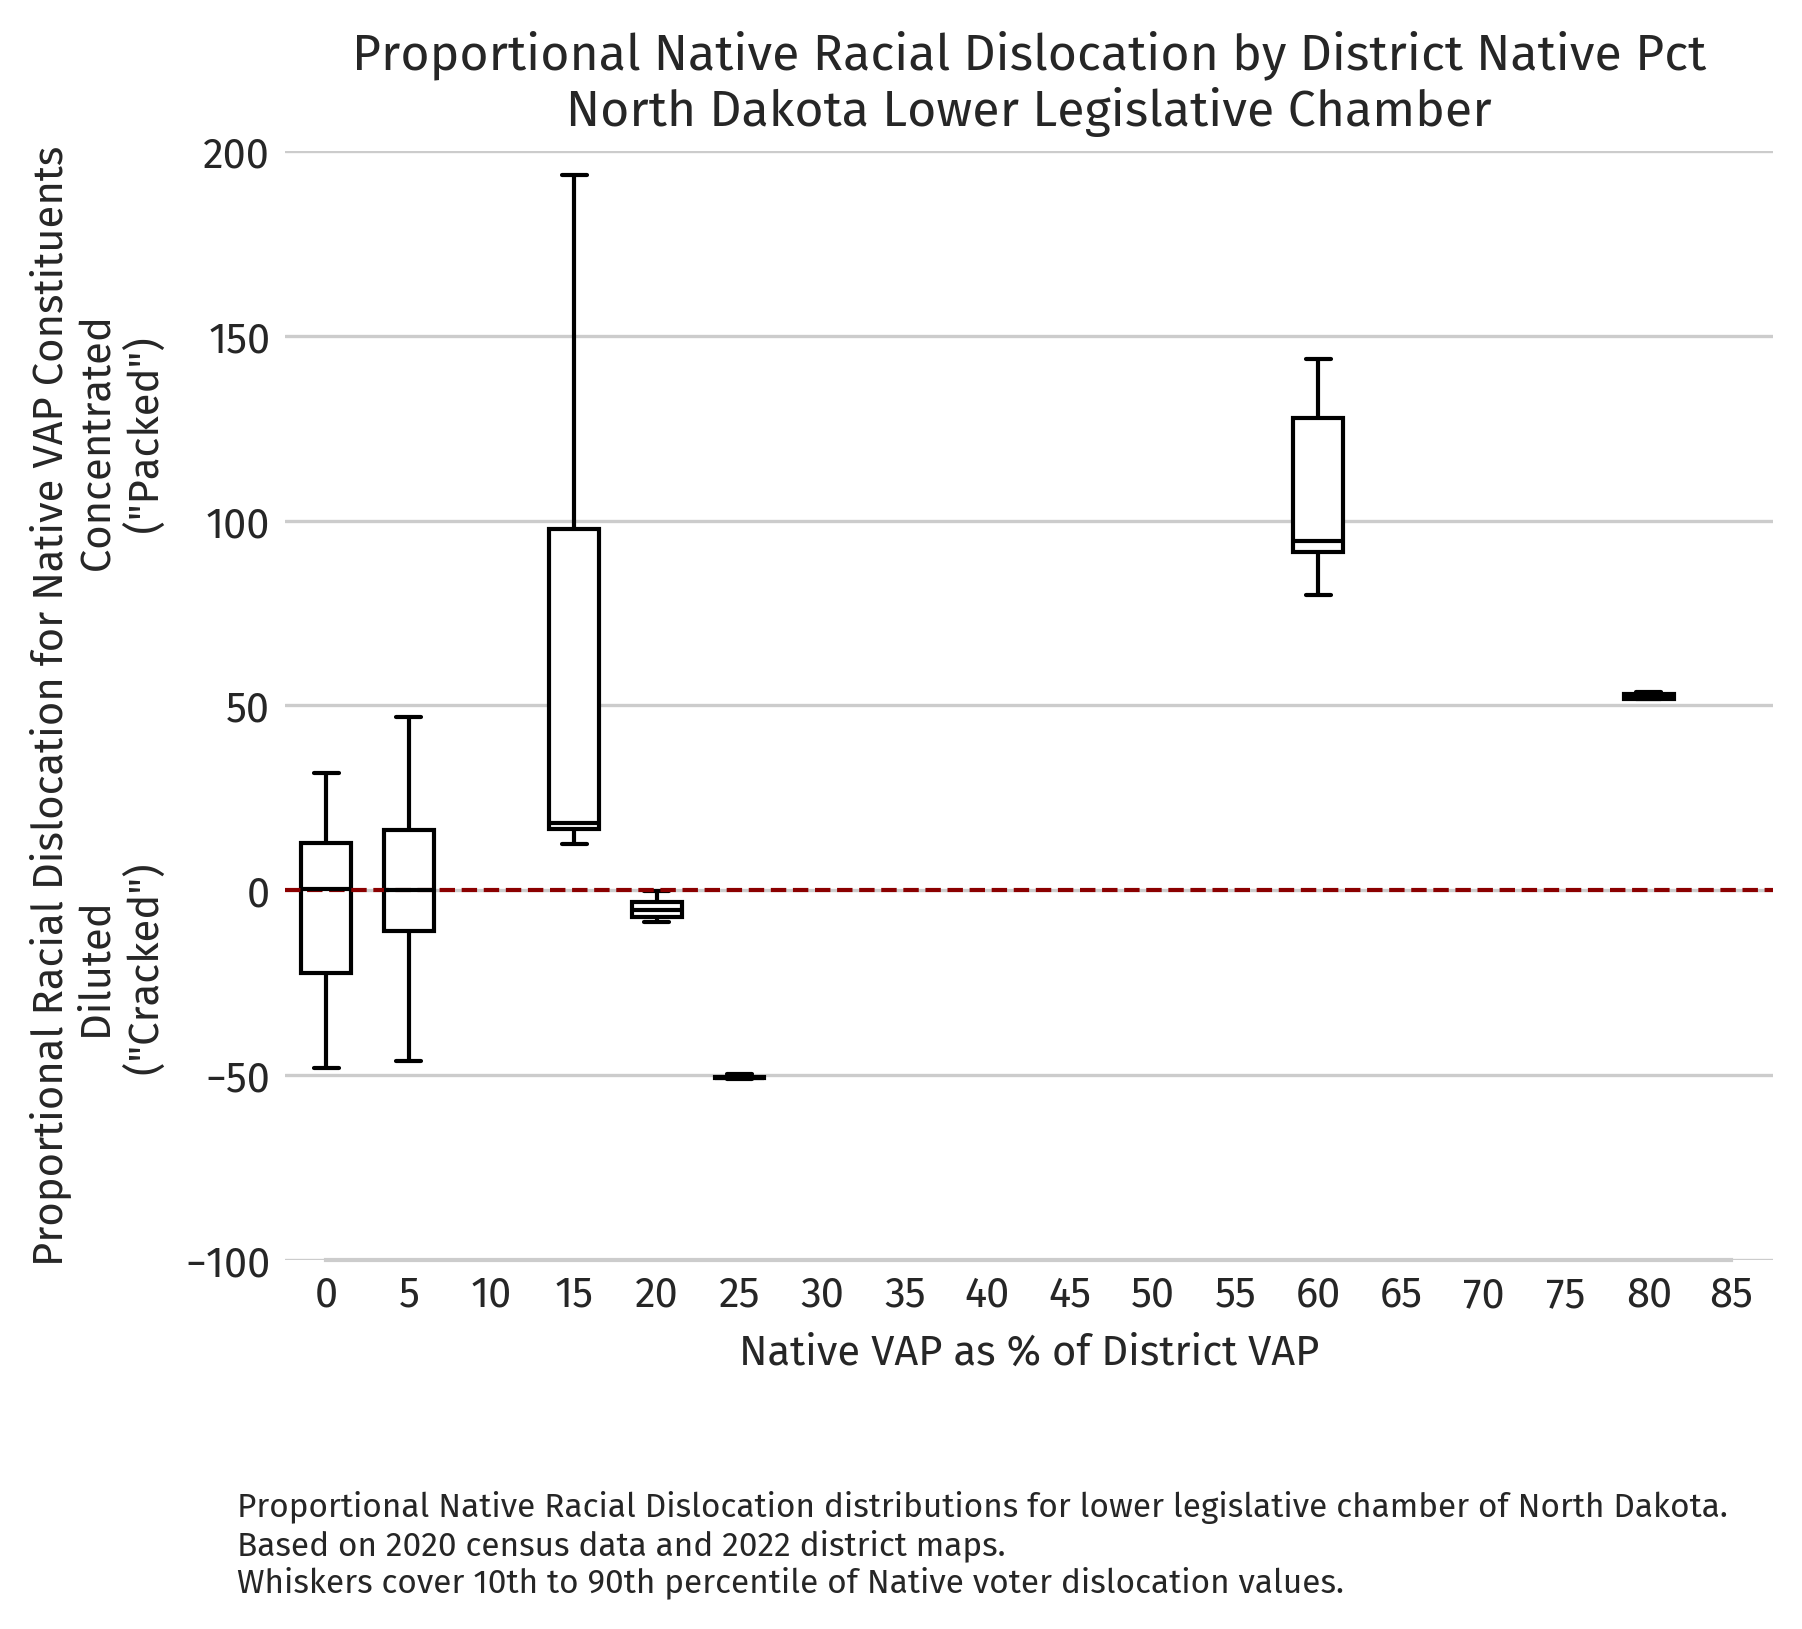
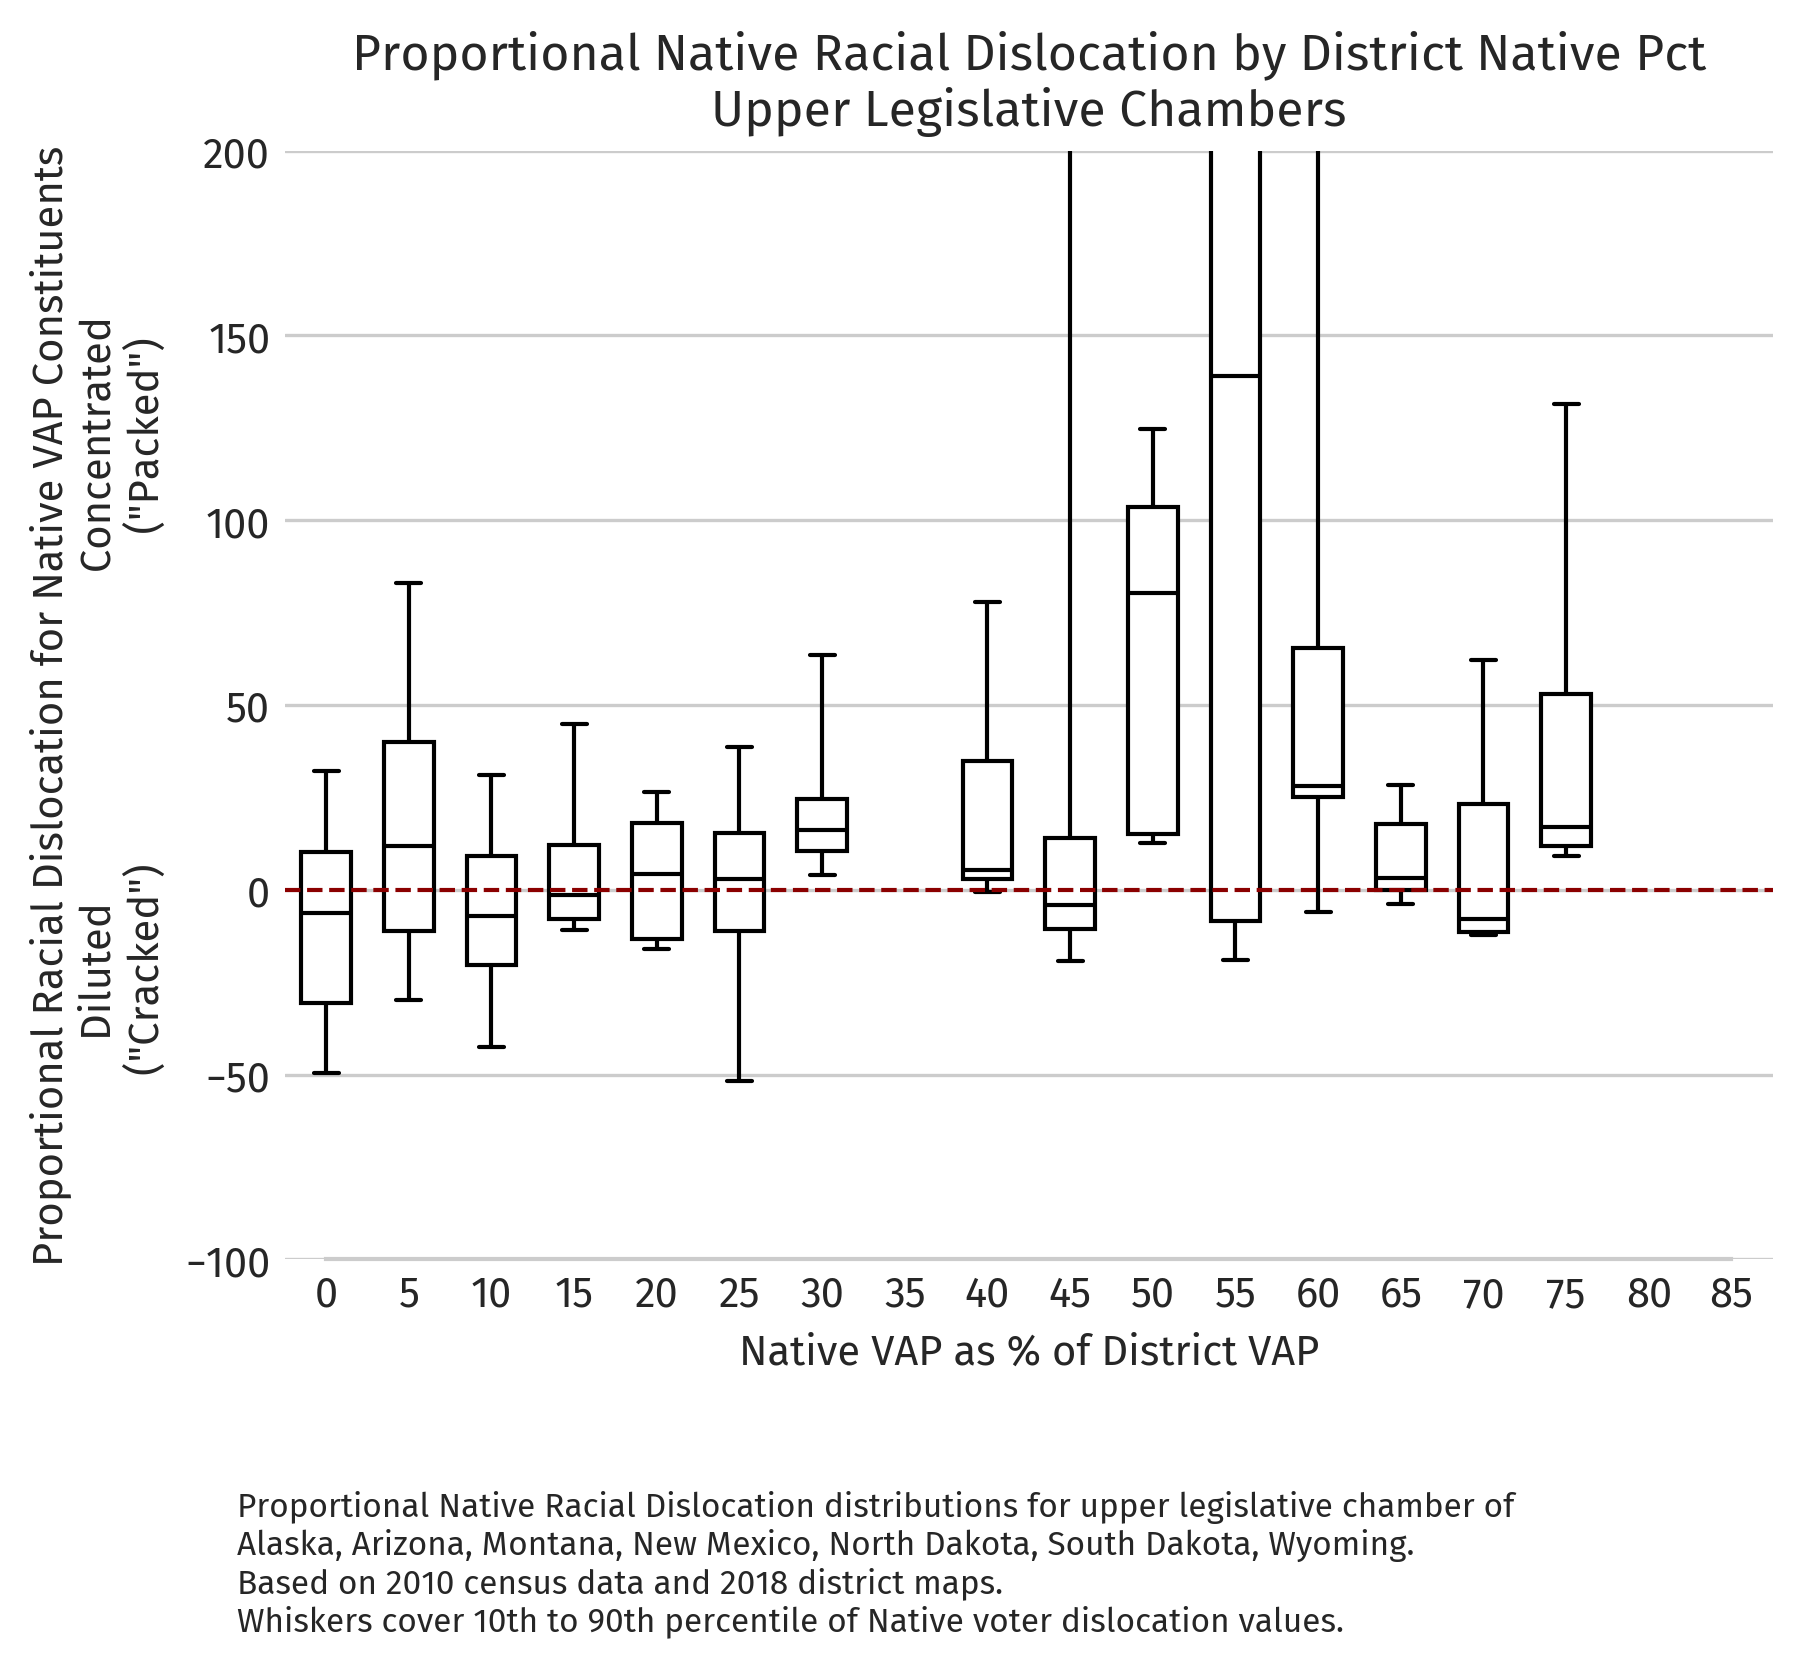
These figures present the same analyses as the absolute dislocation maps but using proportional dislocation values rather than absolute ones. The paper reports absolute dislocation values as the primary measure because they are more intuitive; proportional values are included here because they are the conventional measure in the partisan gerrymandering literature.
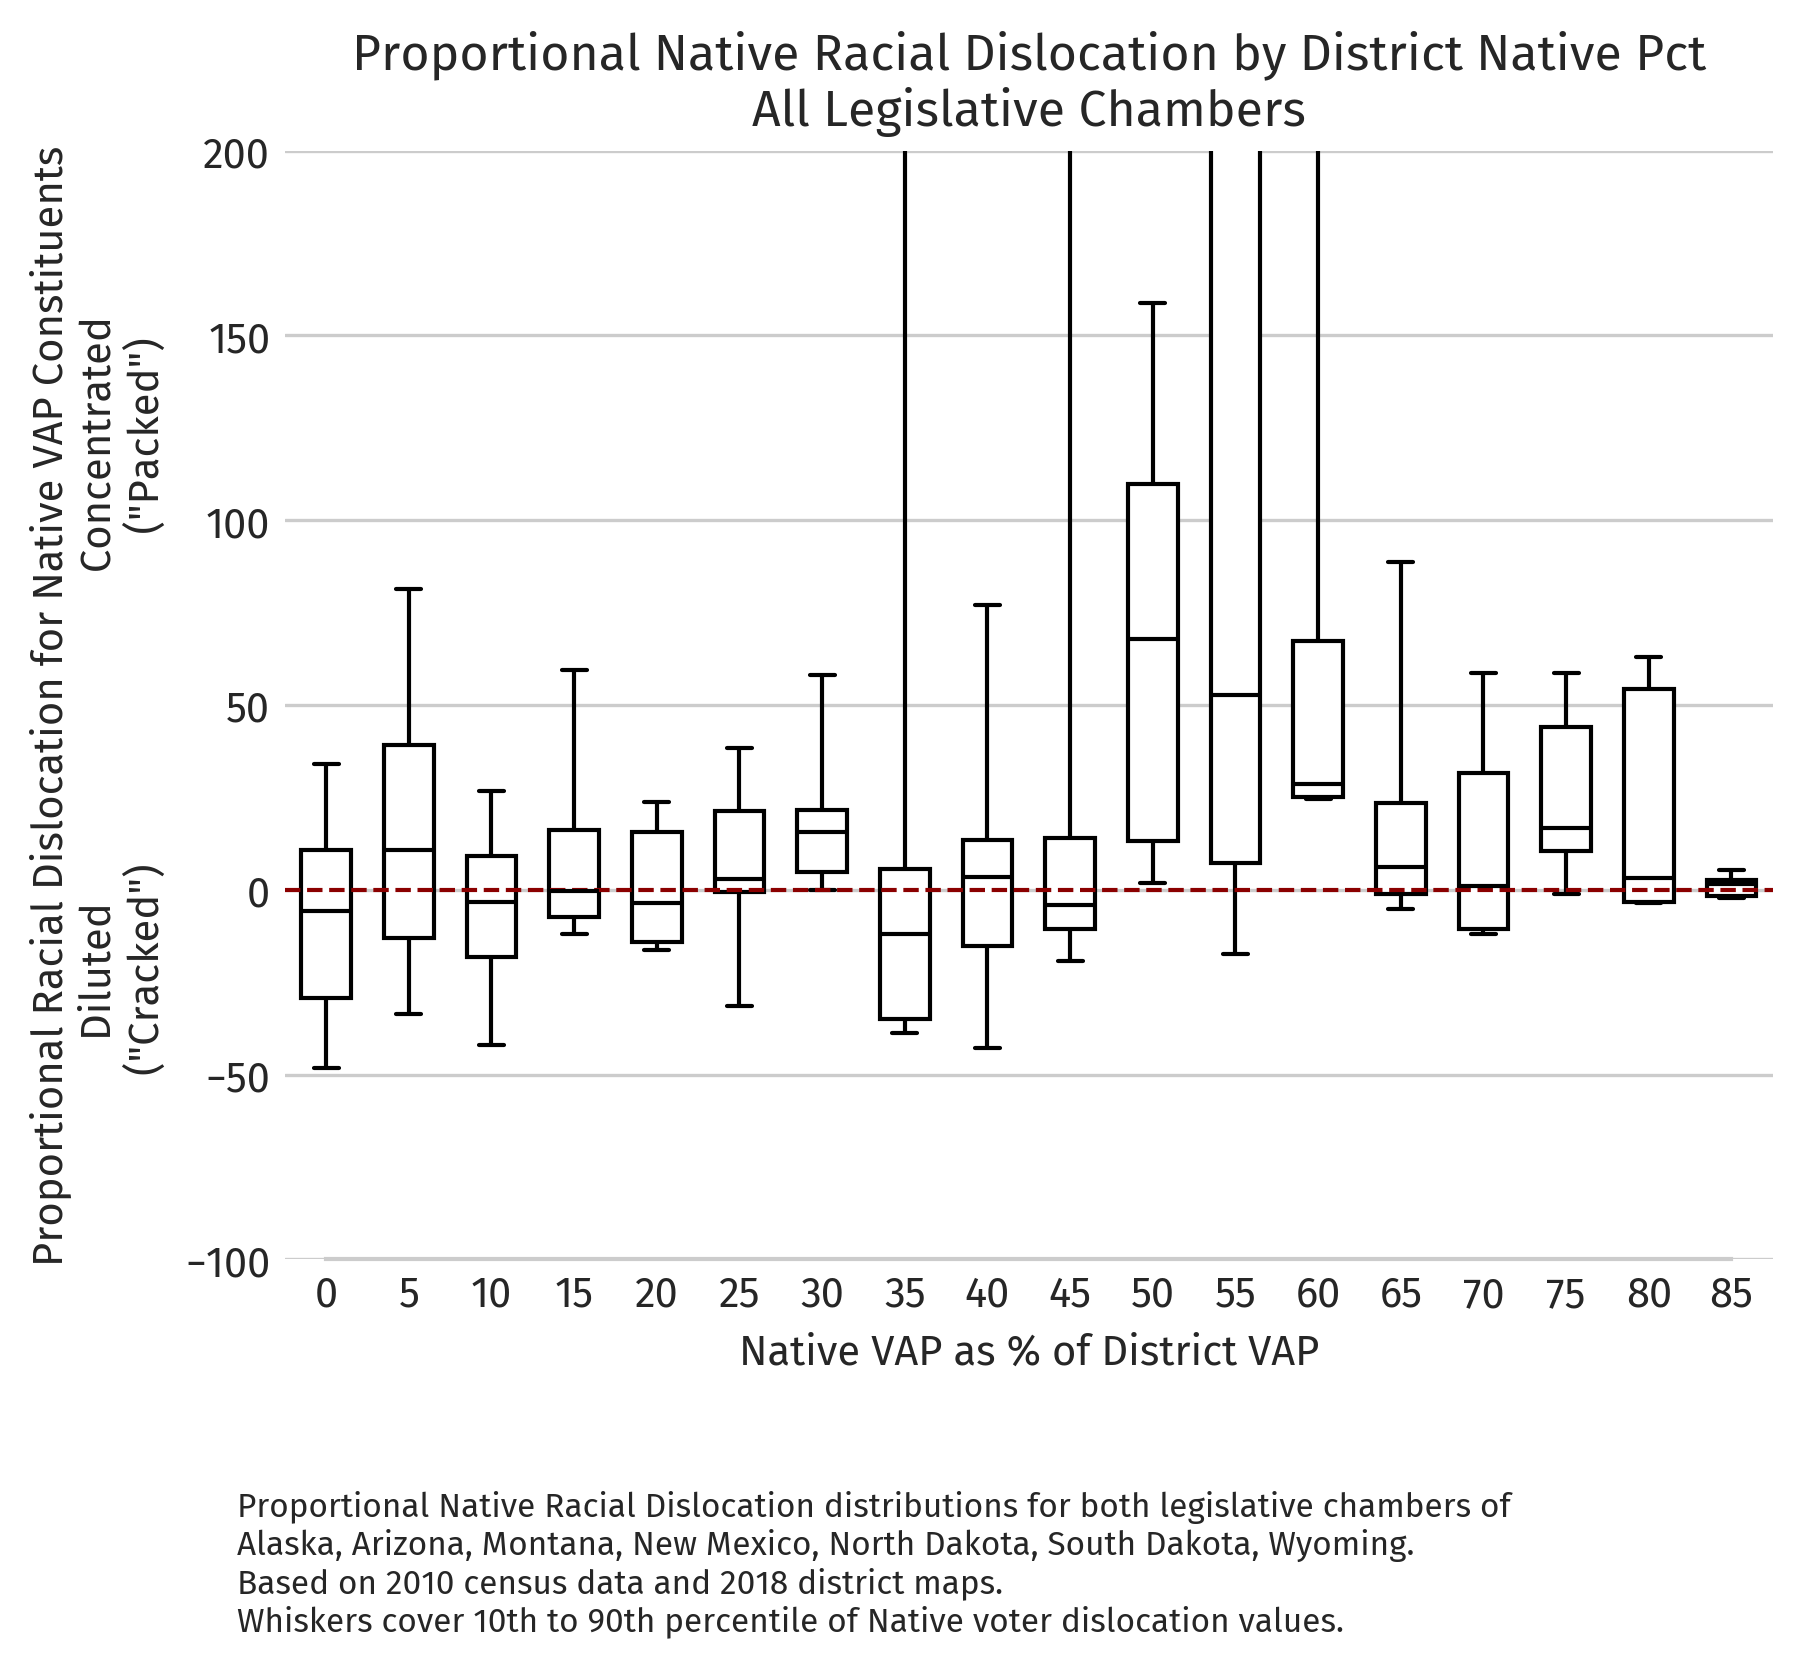
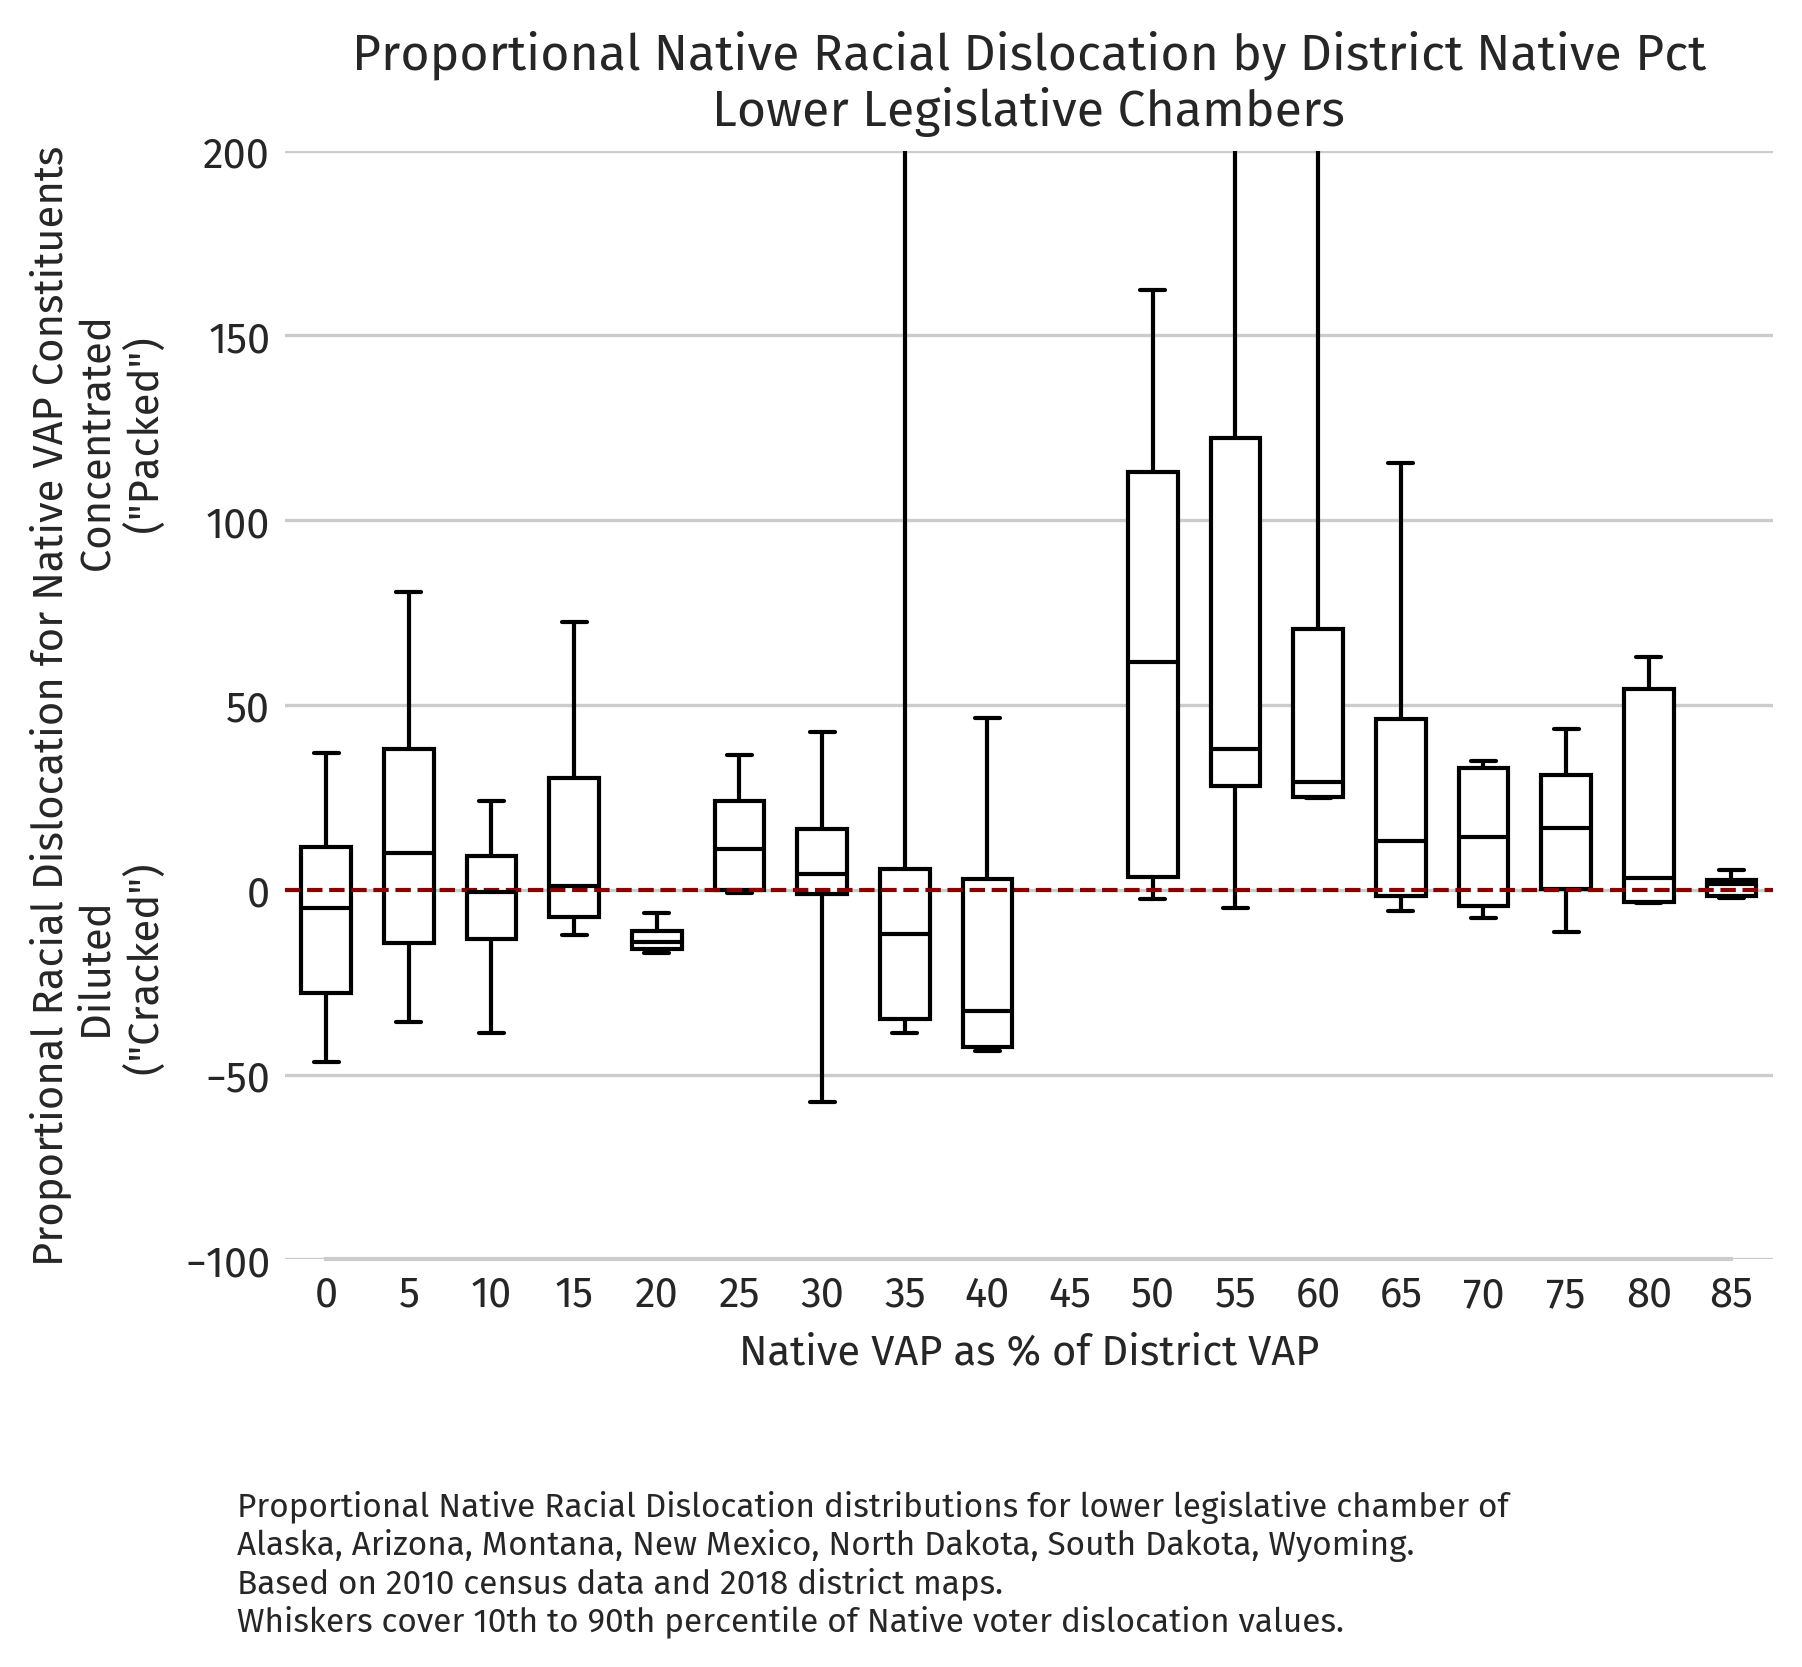
National overview figures appear first, followed by state-specific breakdowns for Alaska, Arizona, Montana, North Dakota, New Mexico, South Dakota, and Wyoming.
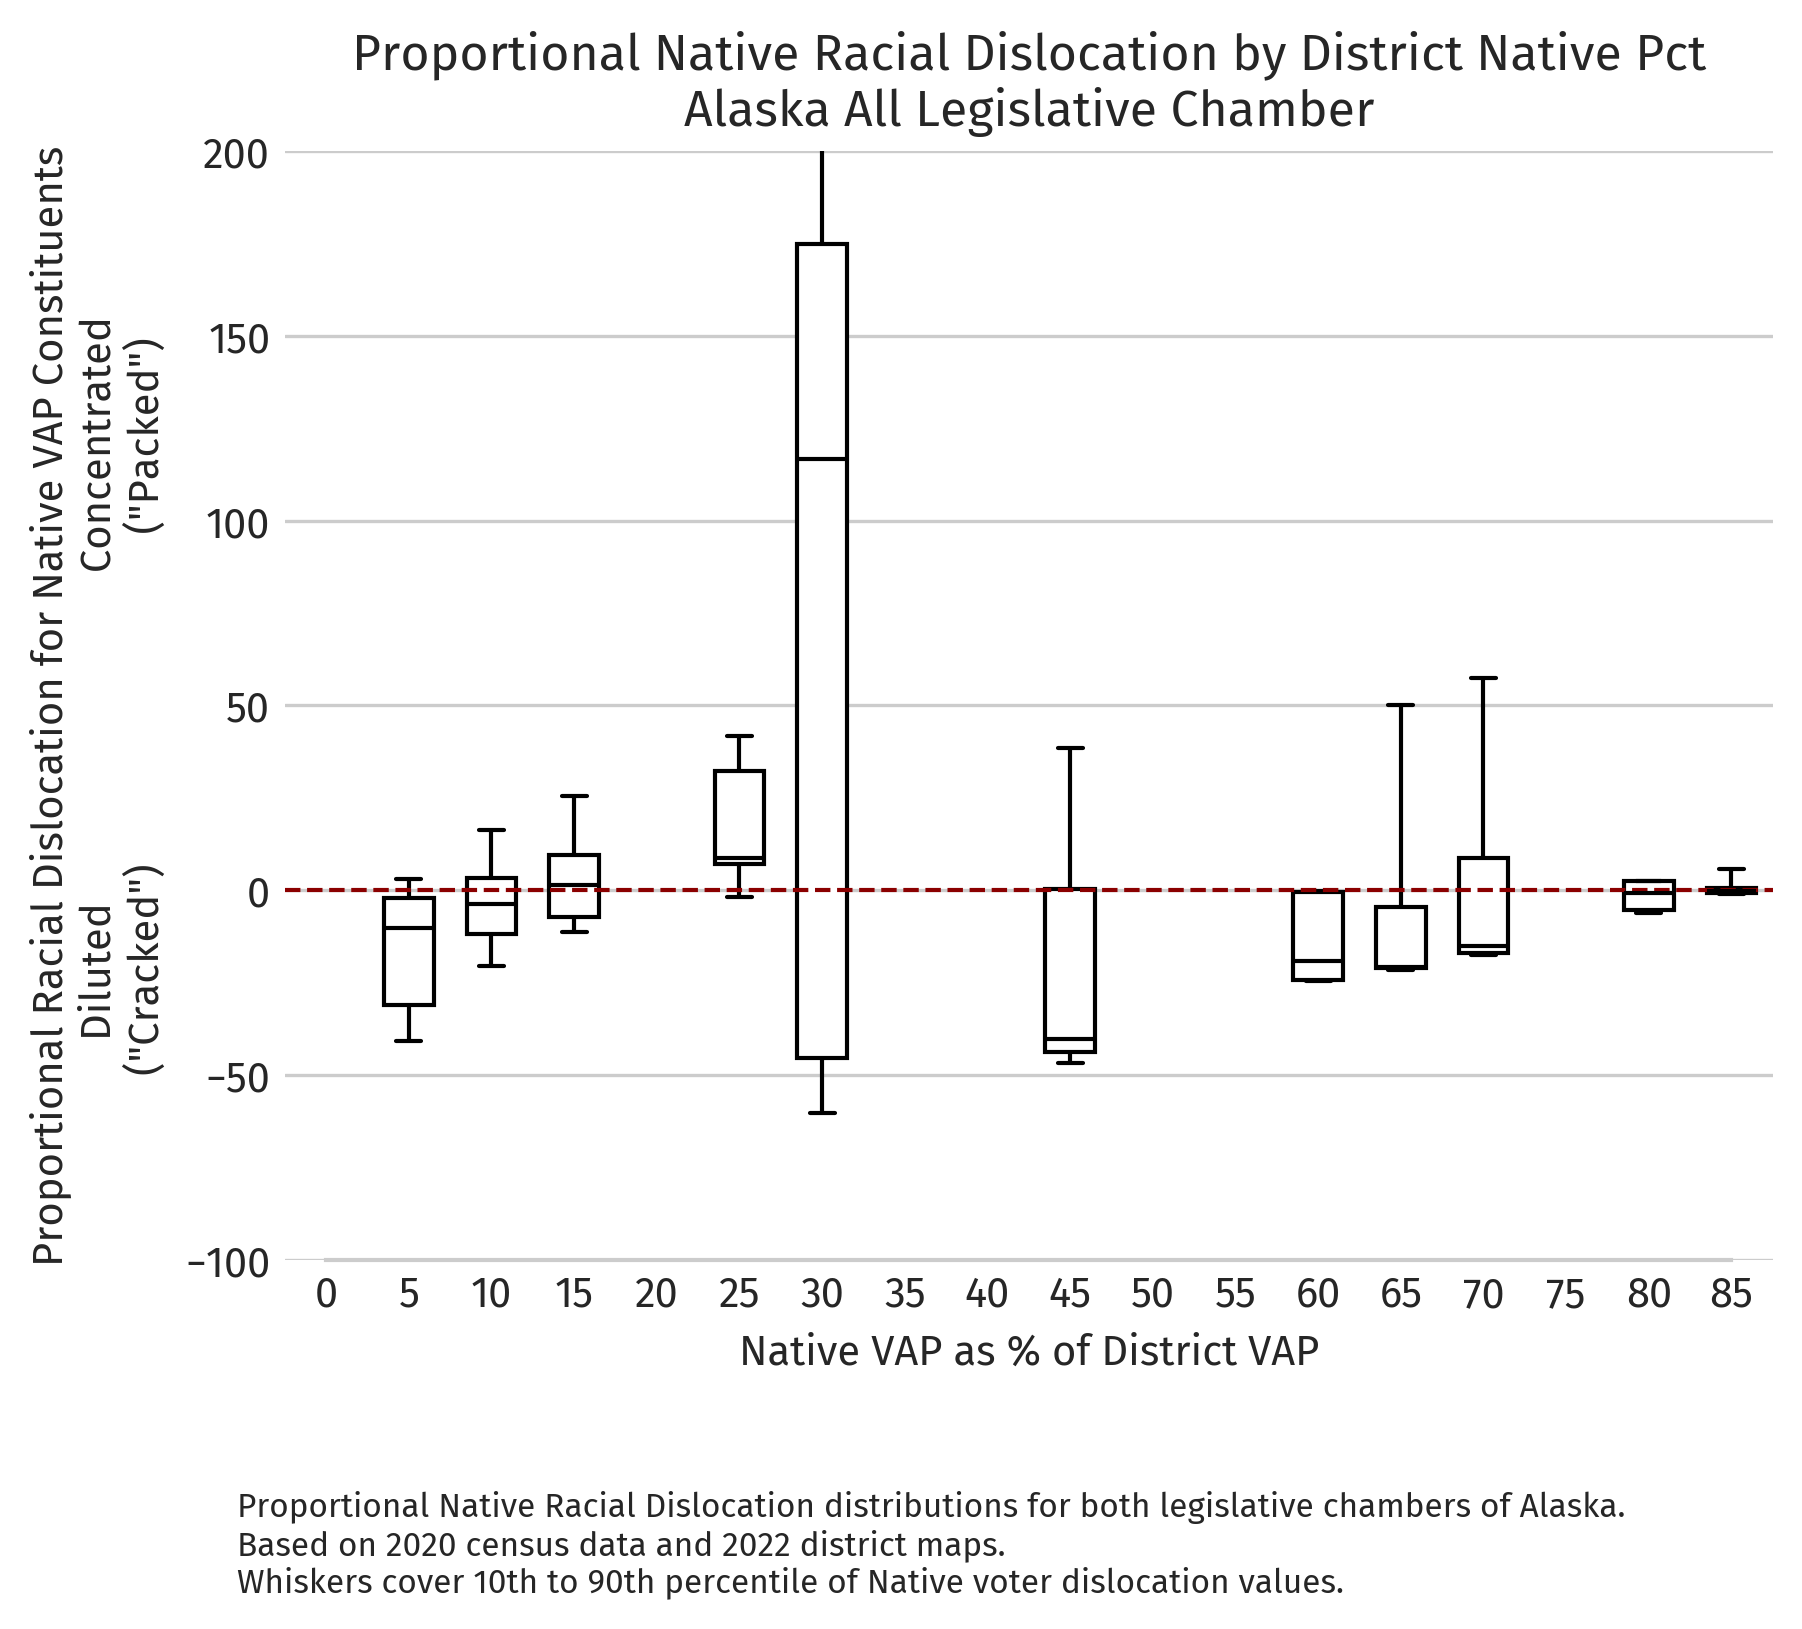
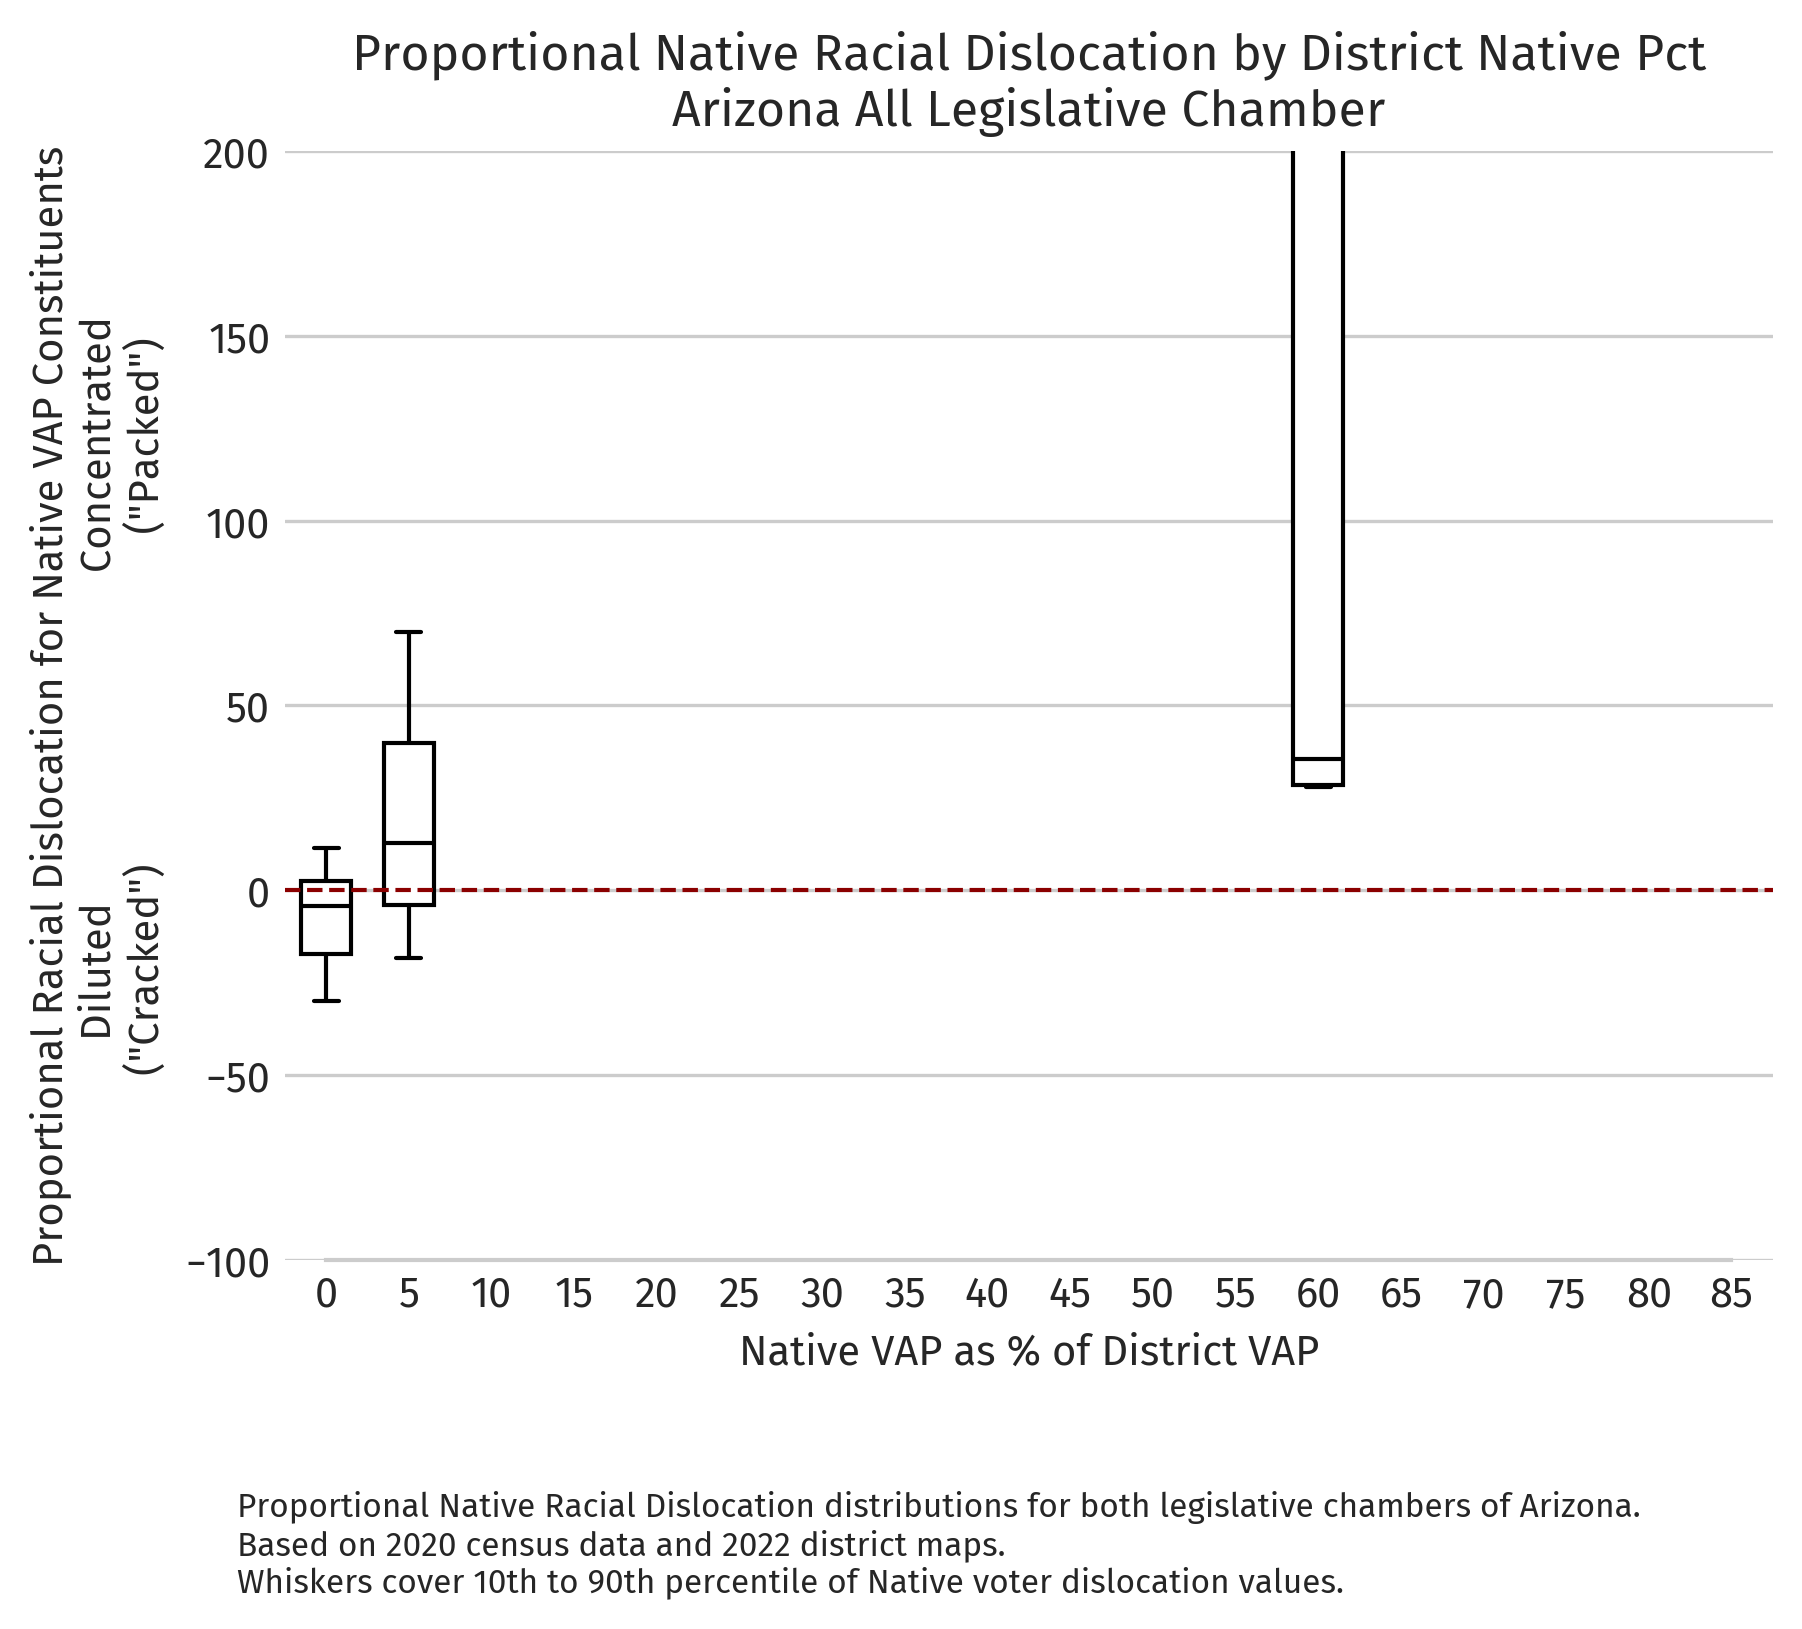
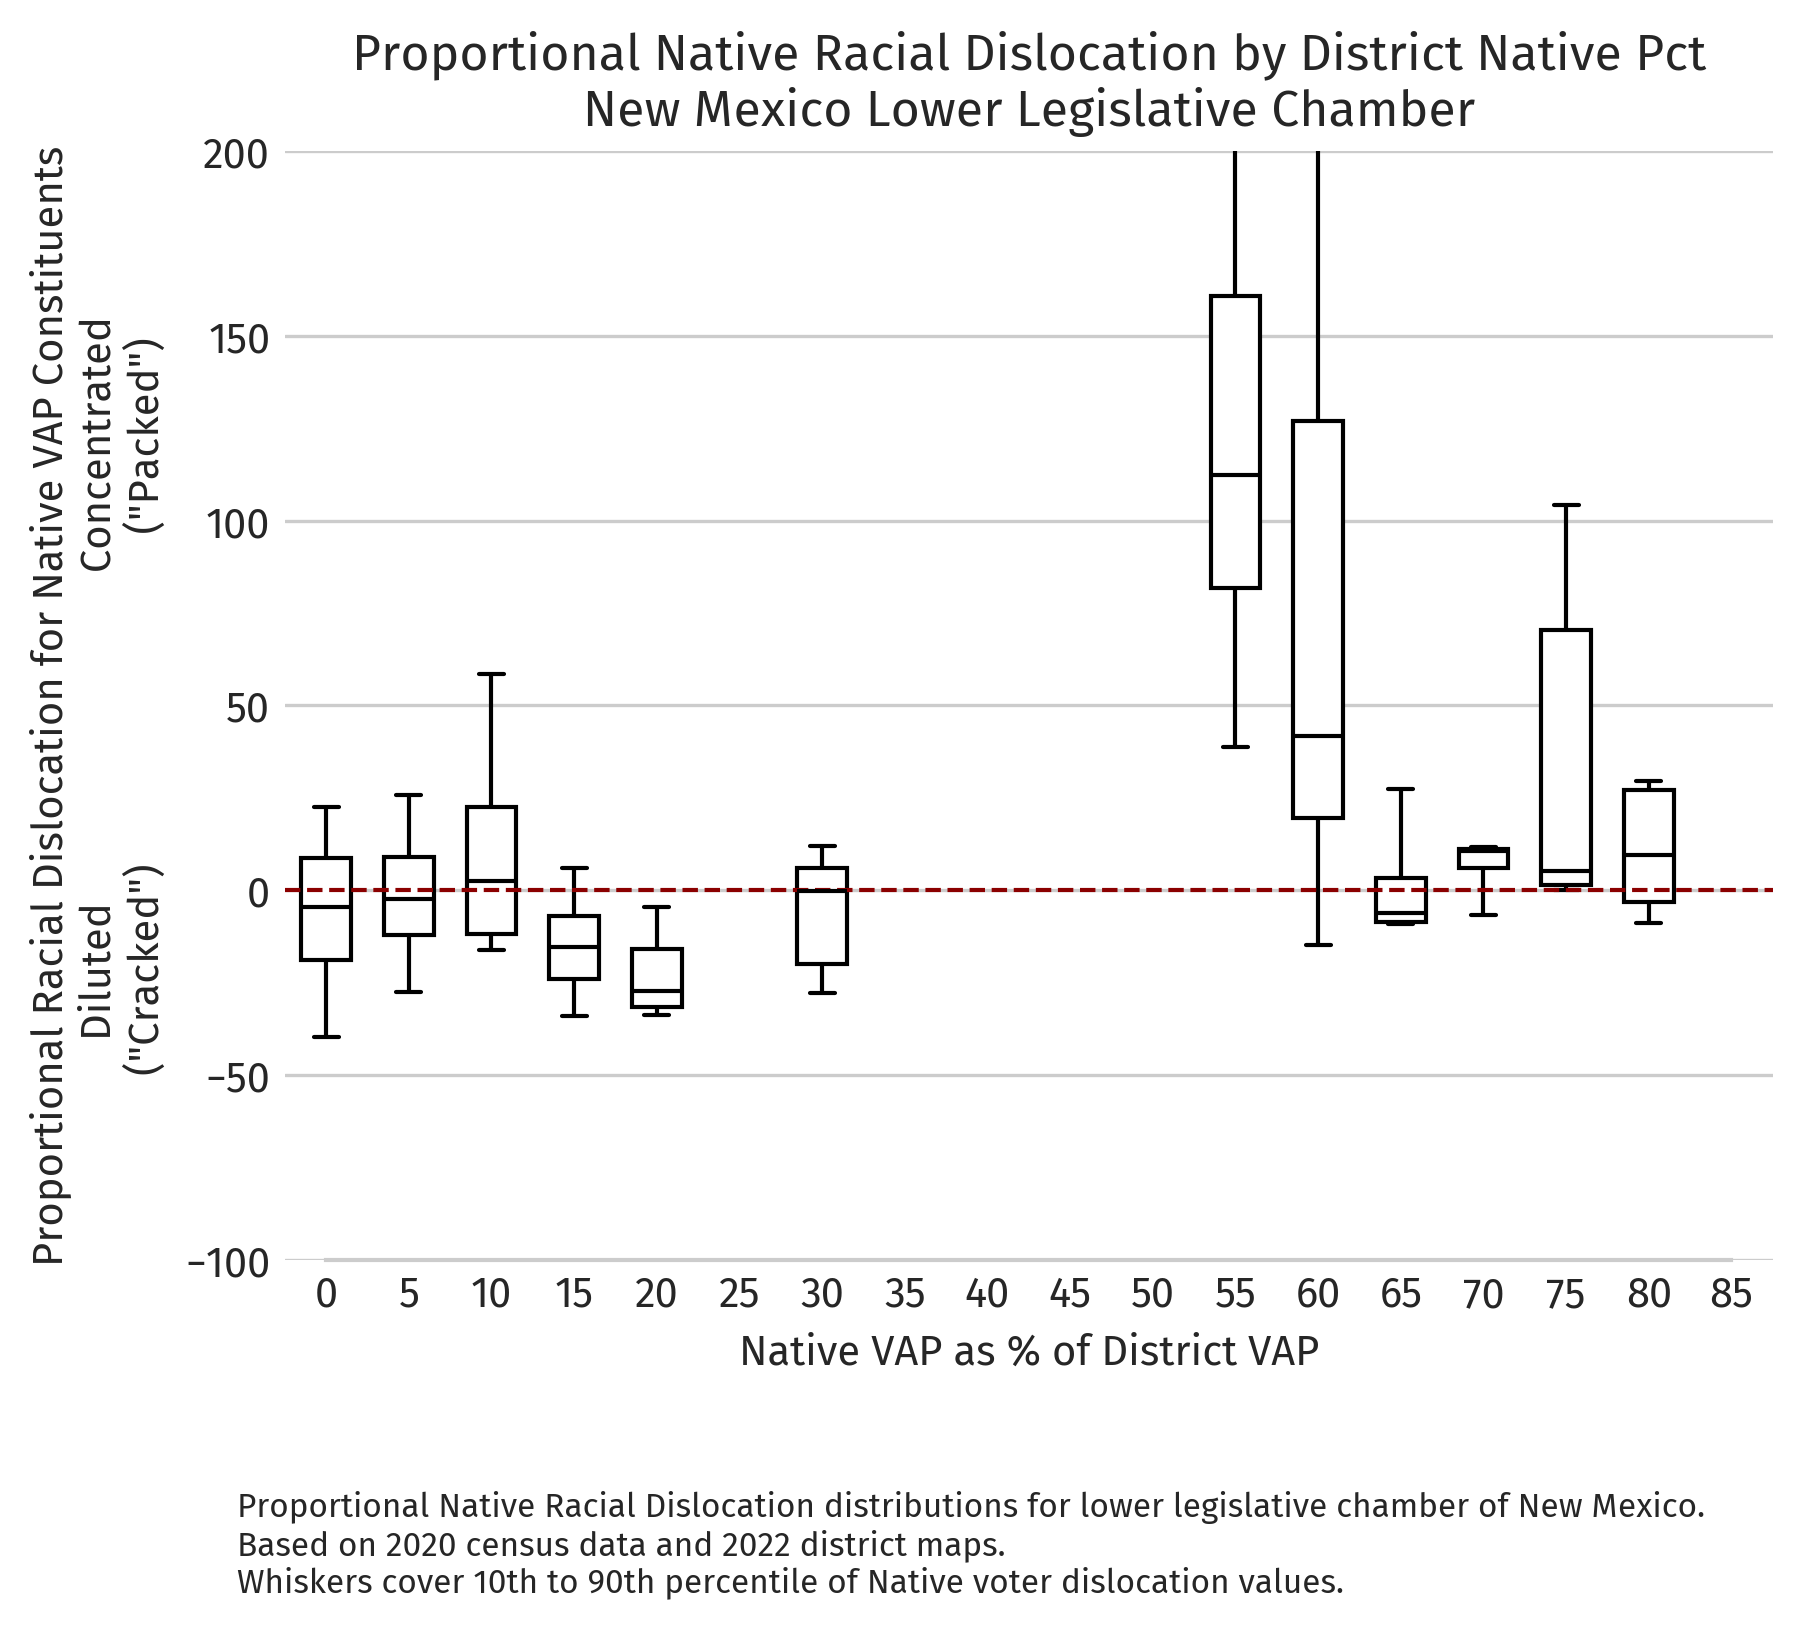
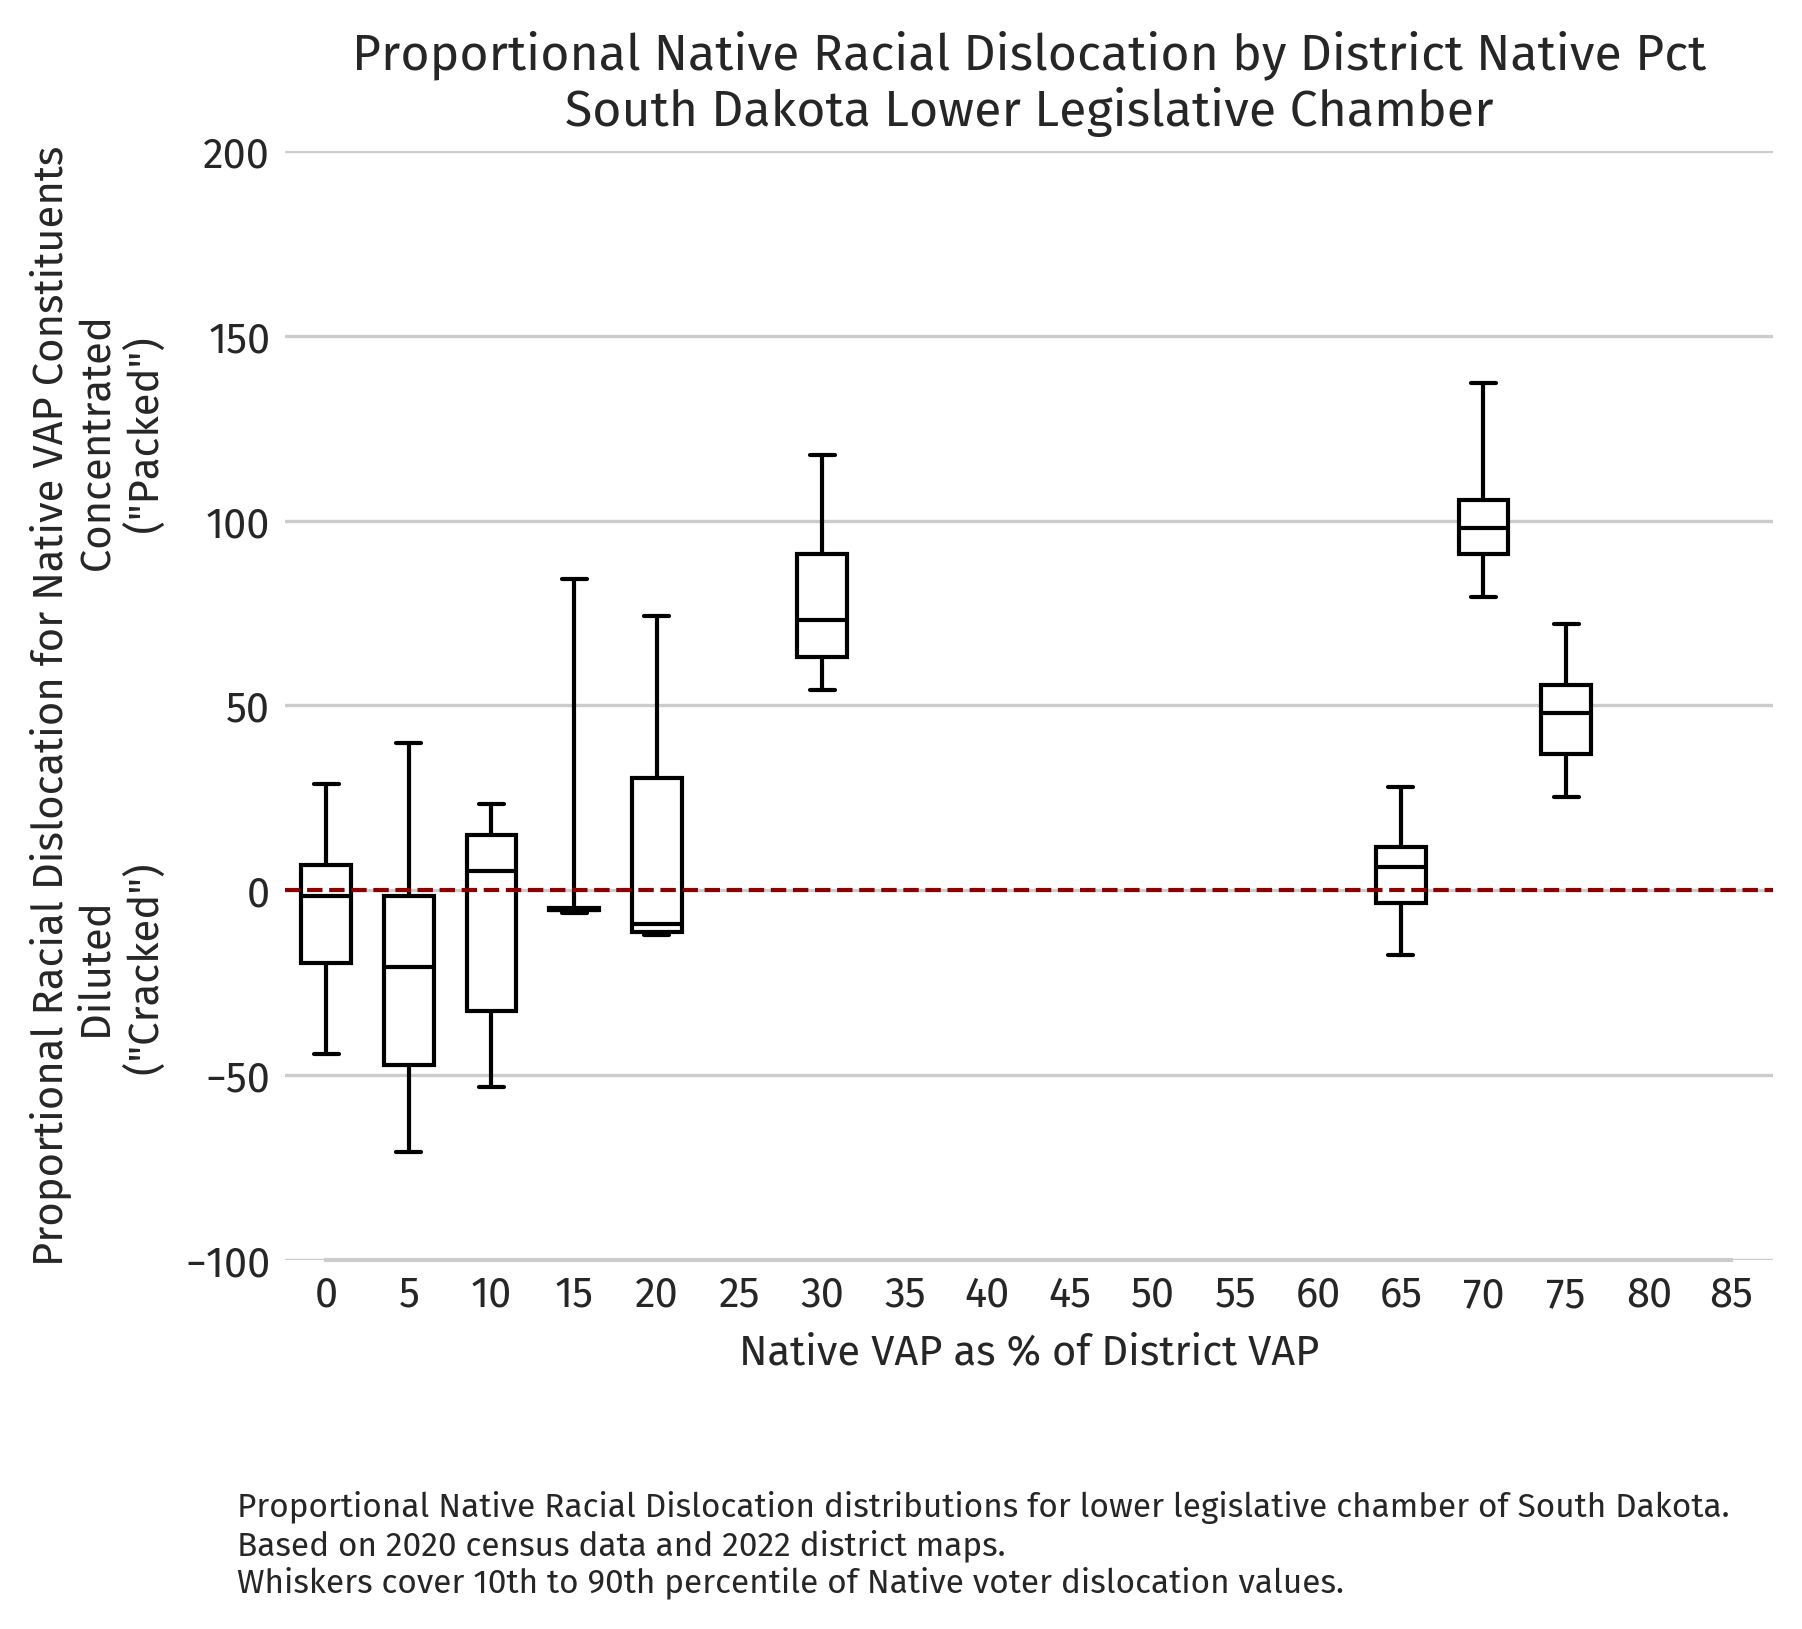
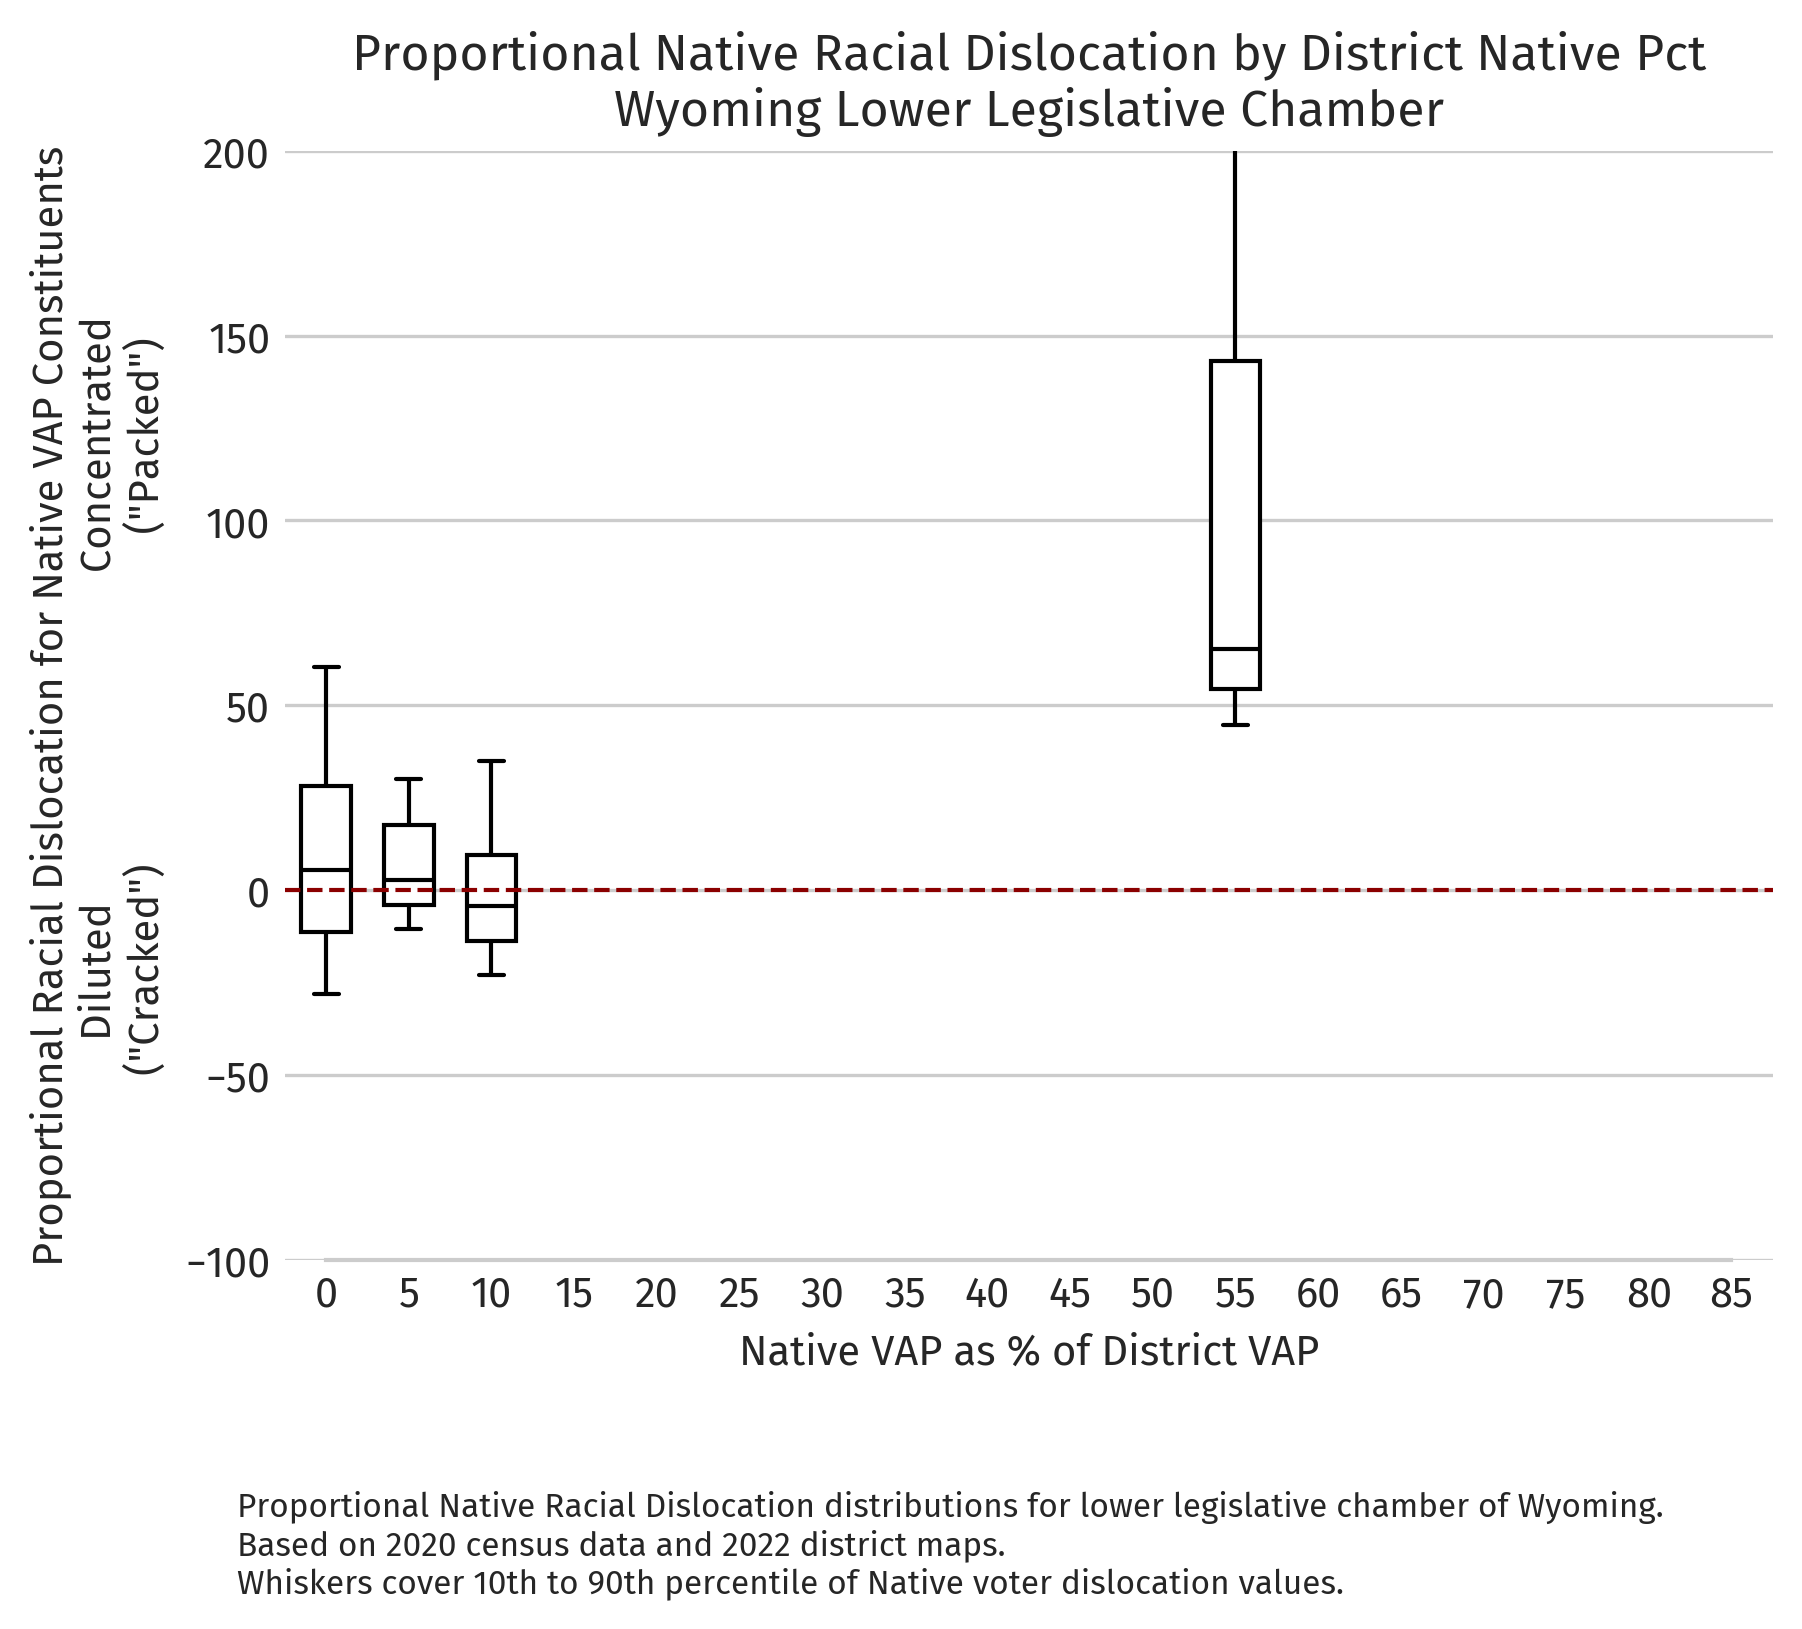
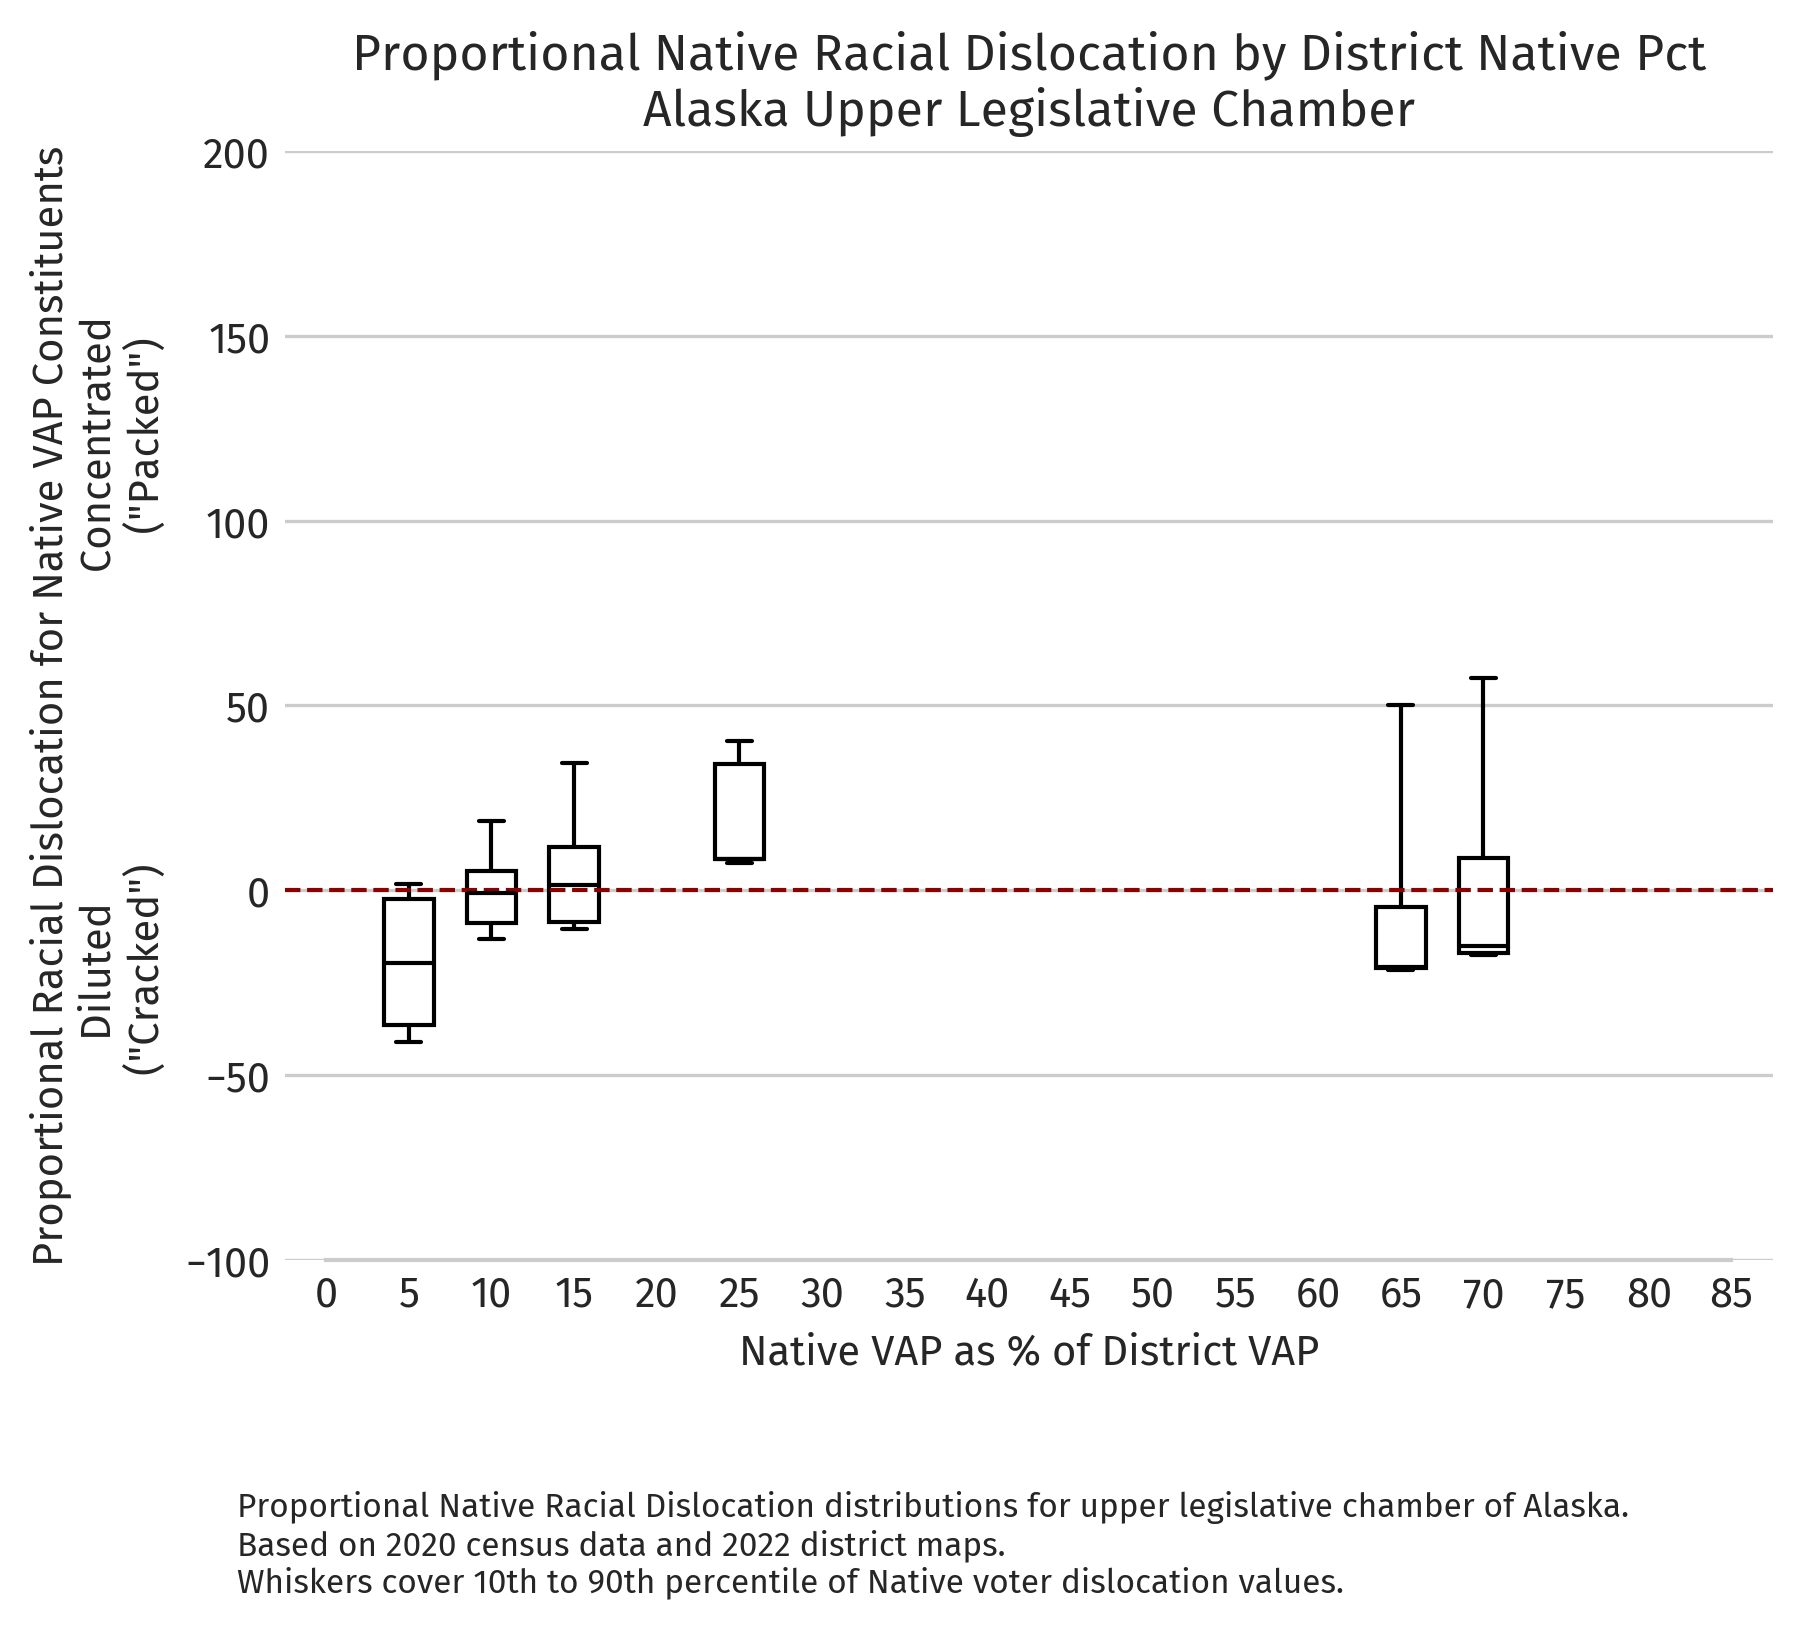
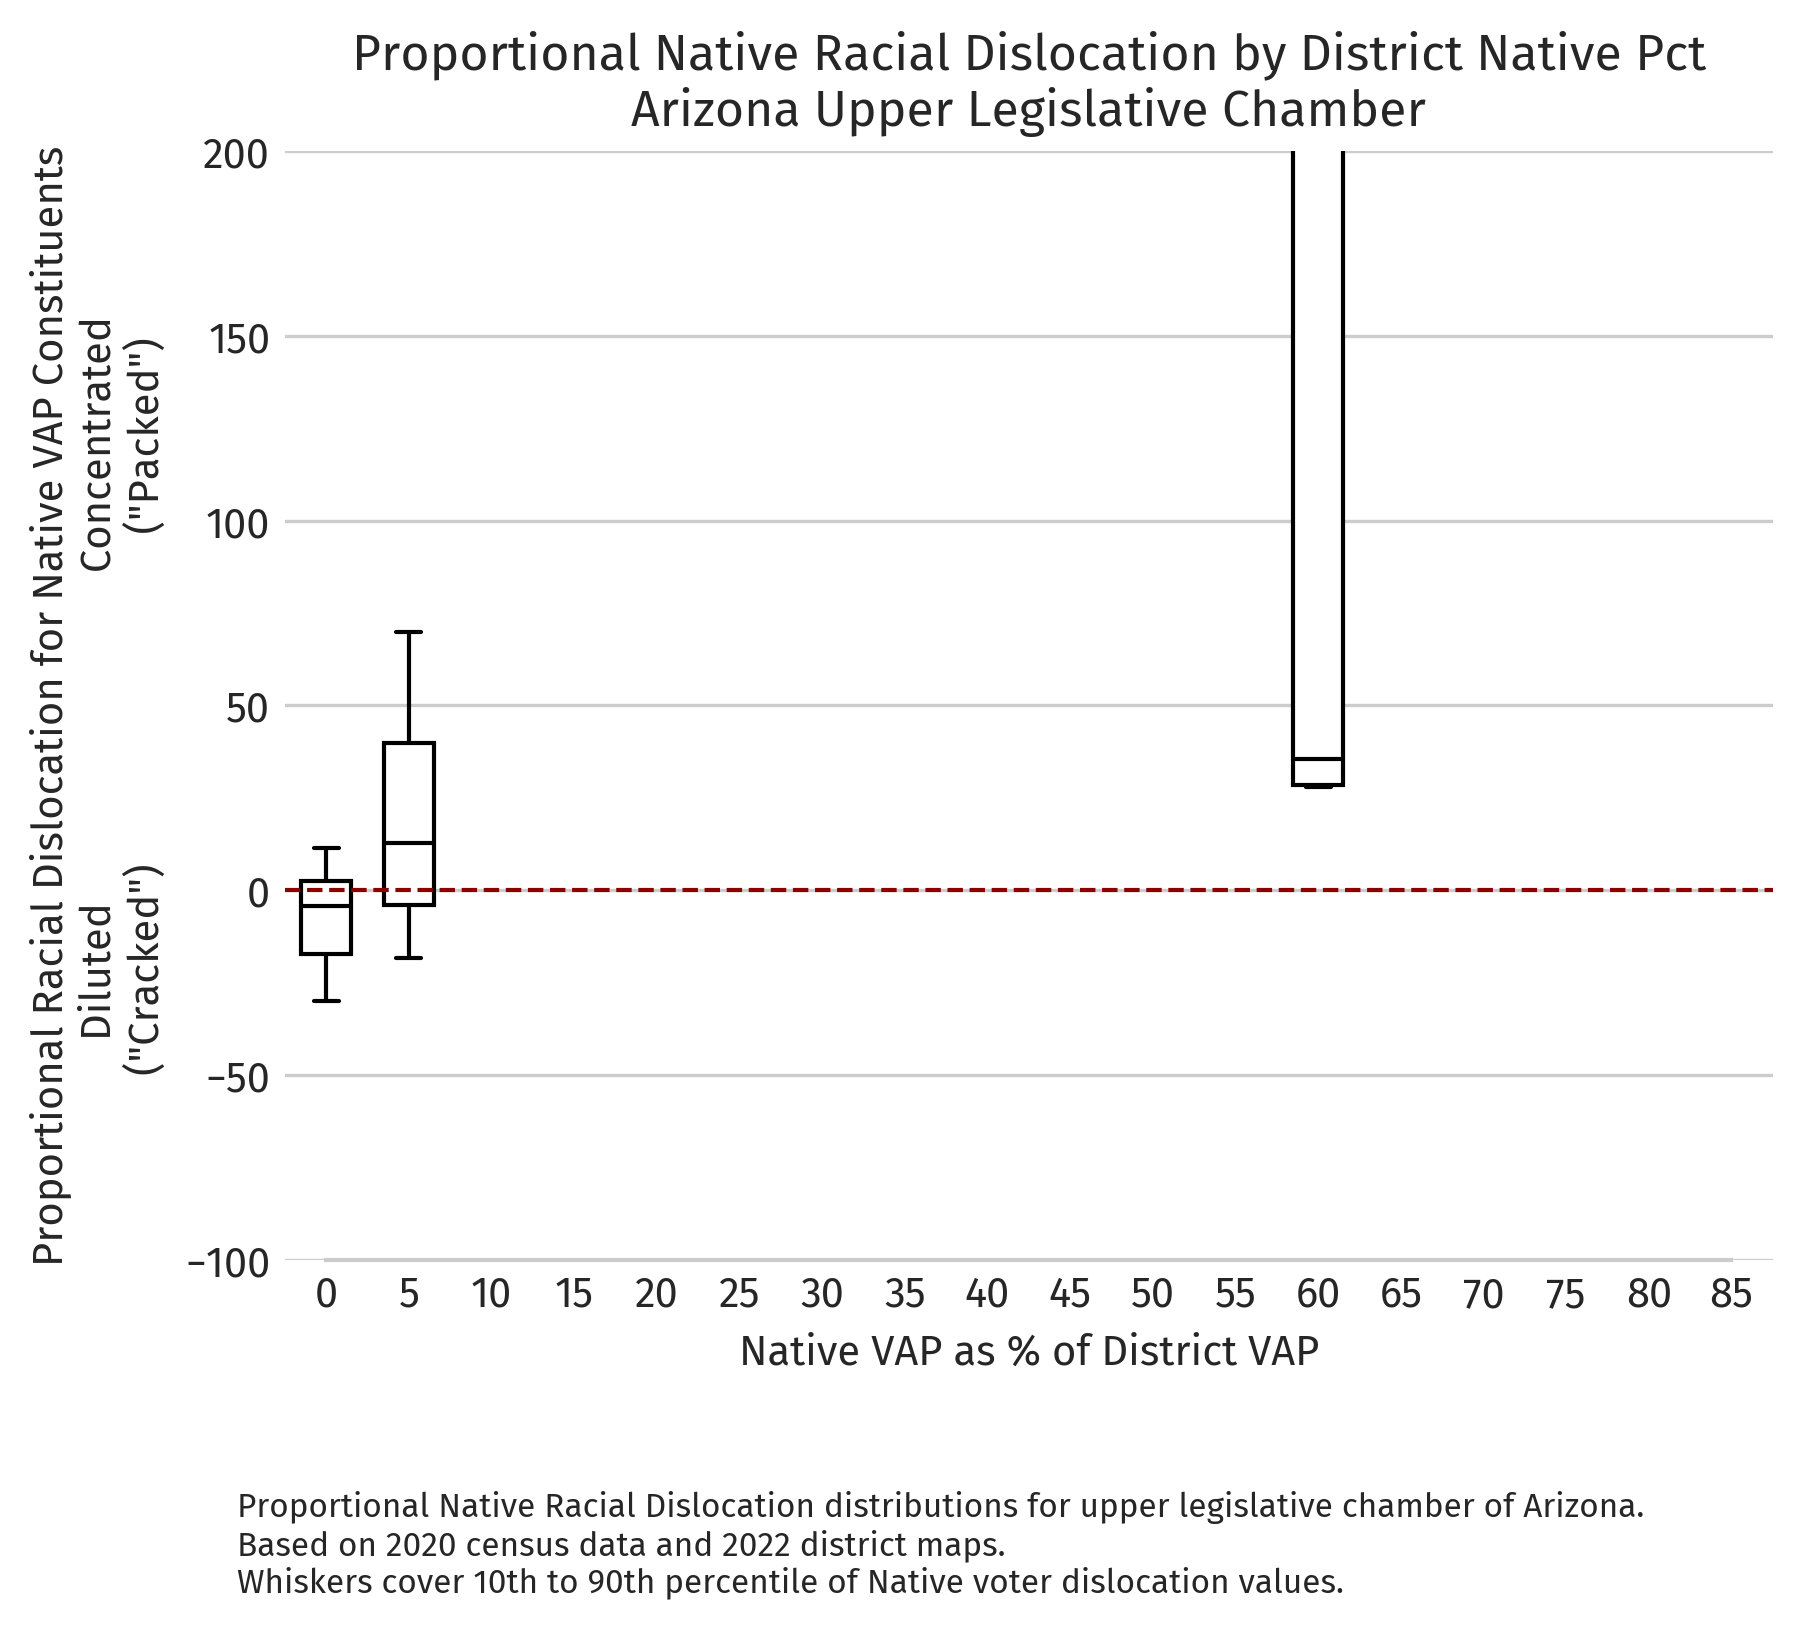
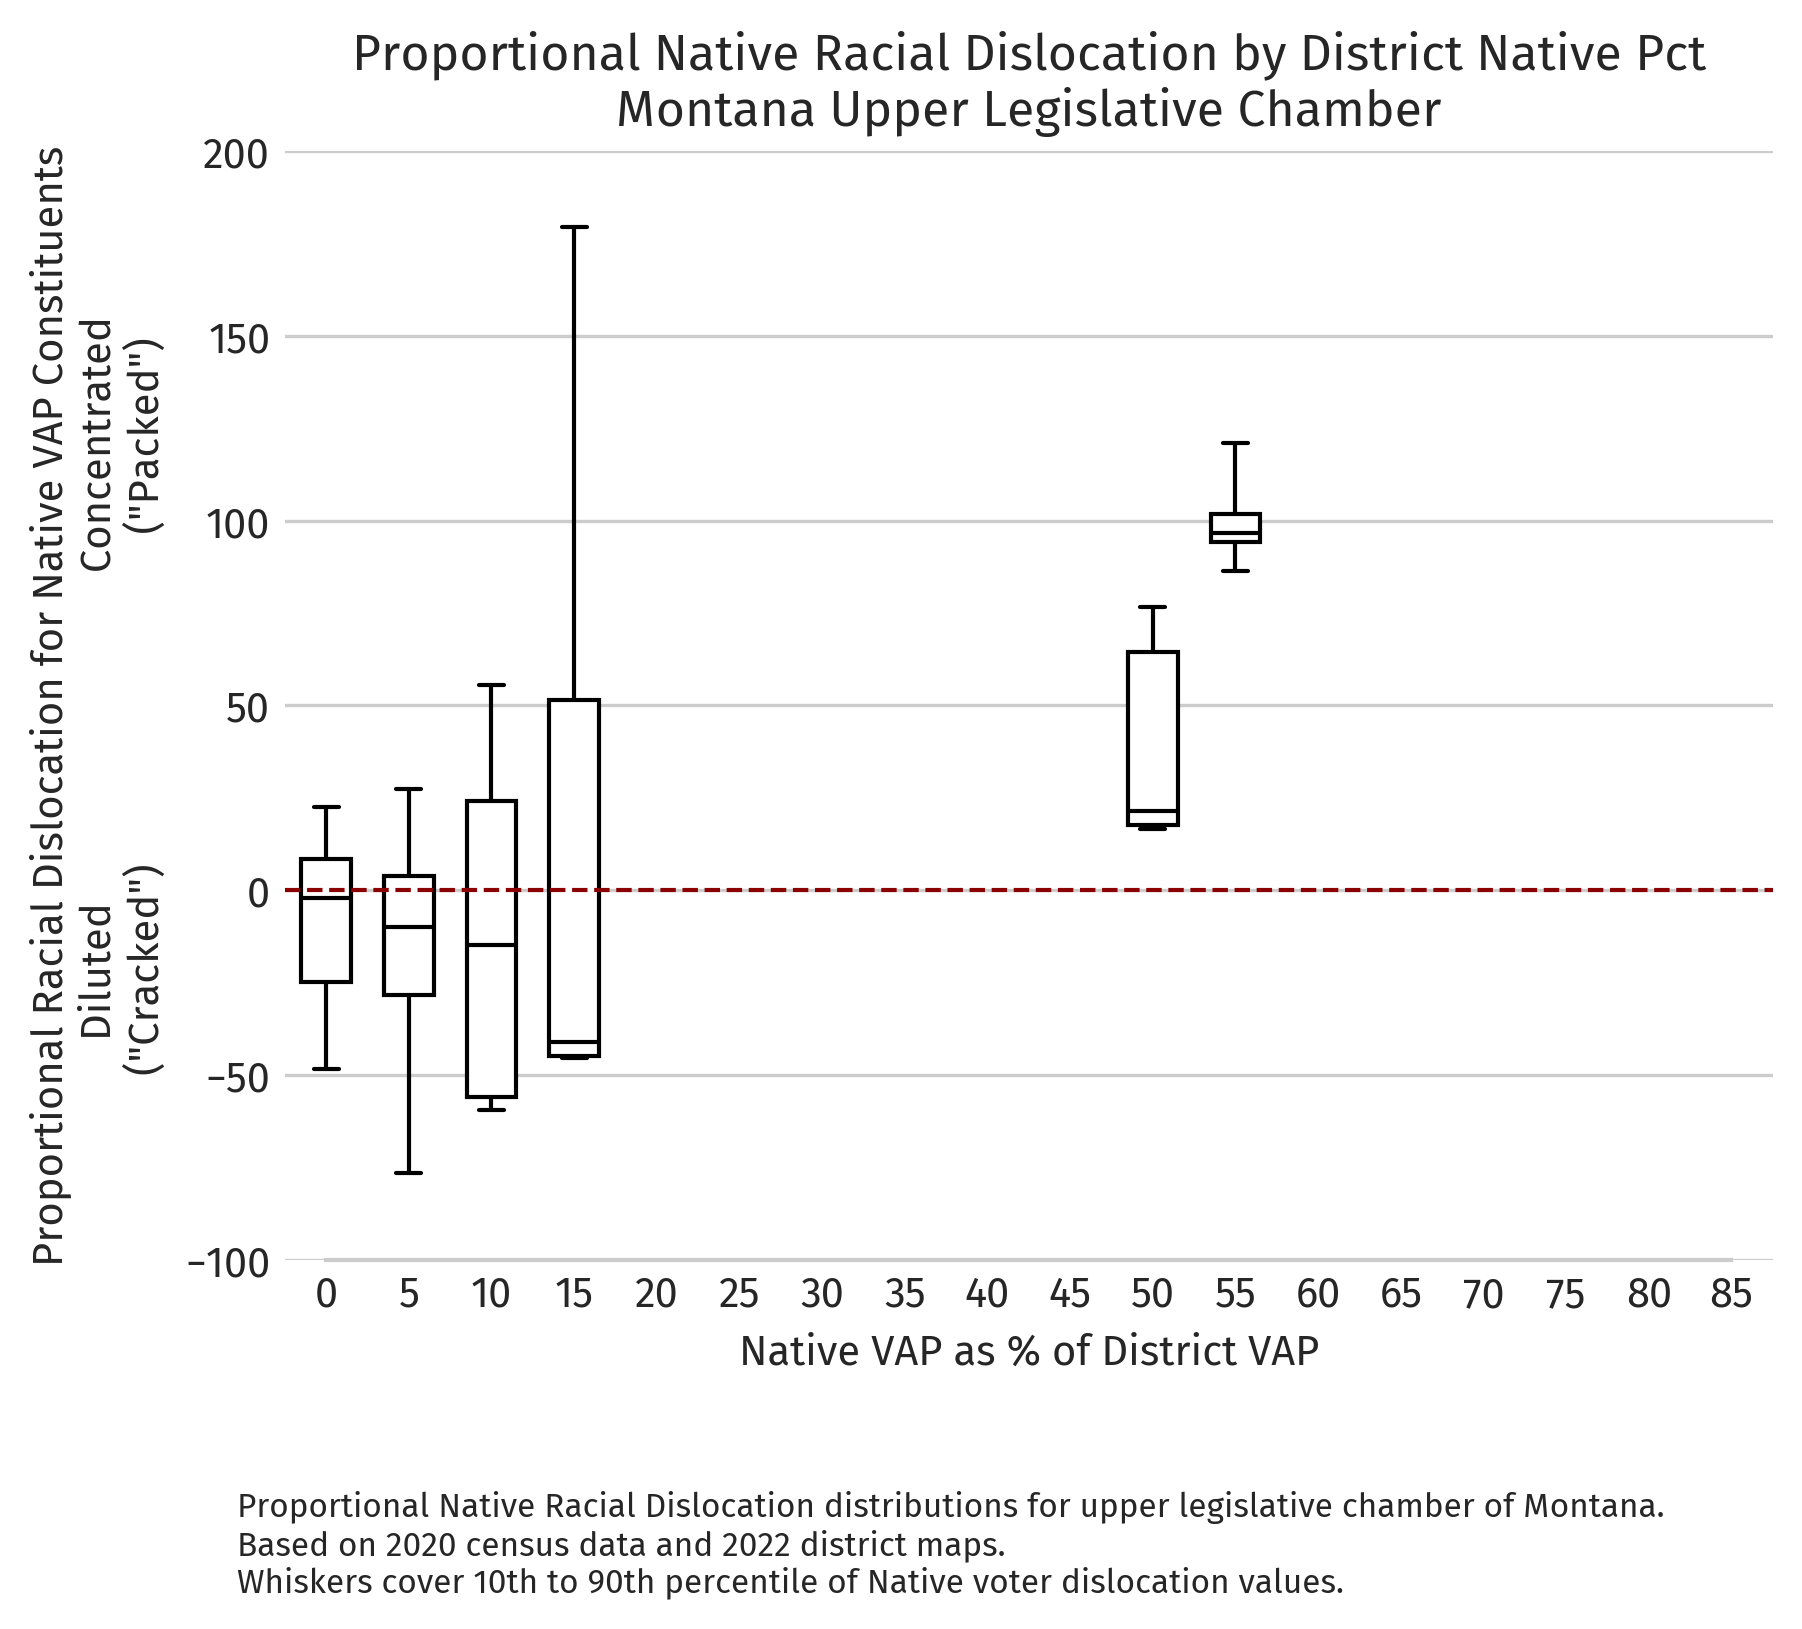
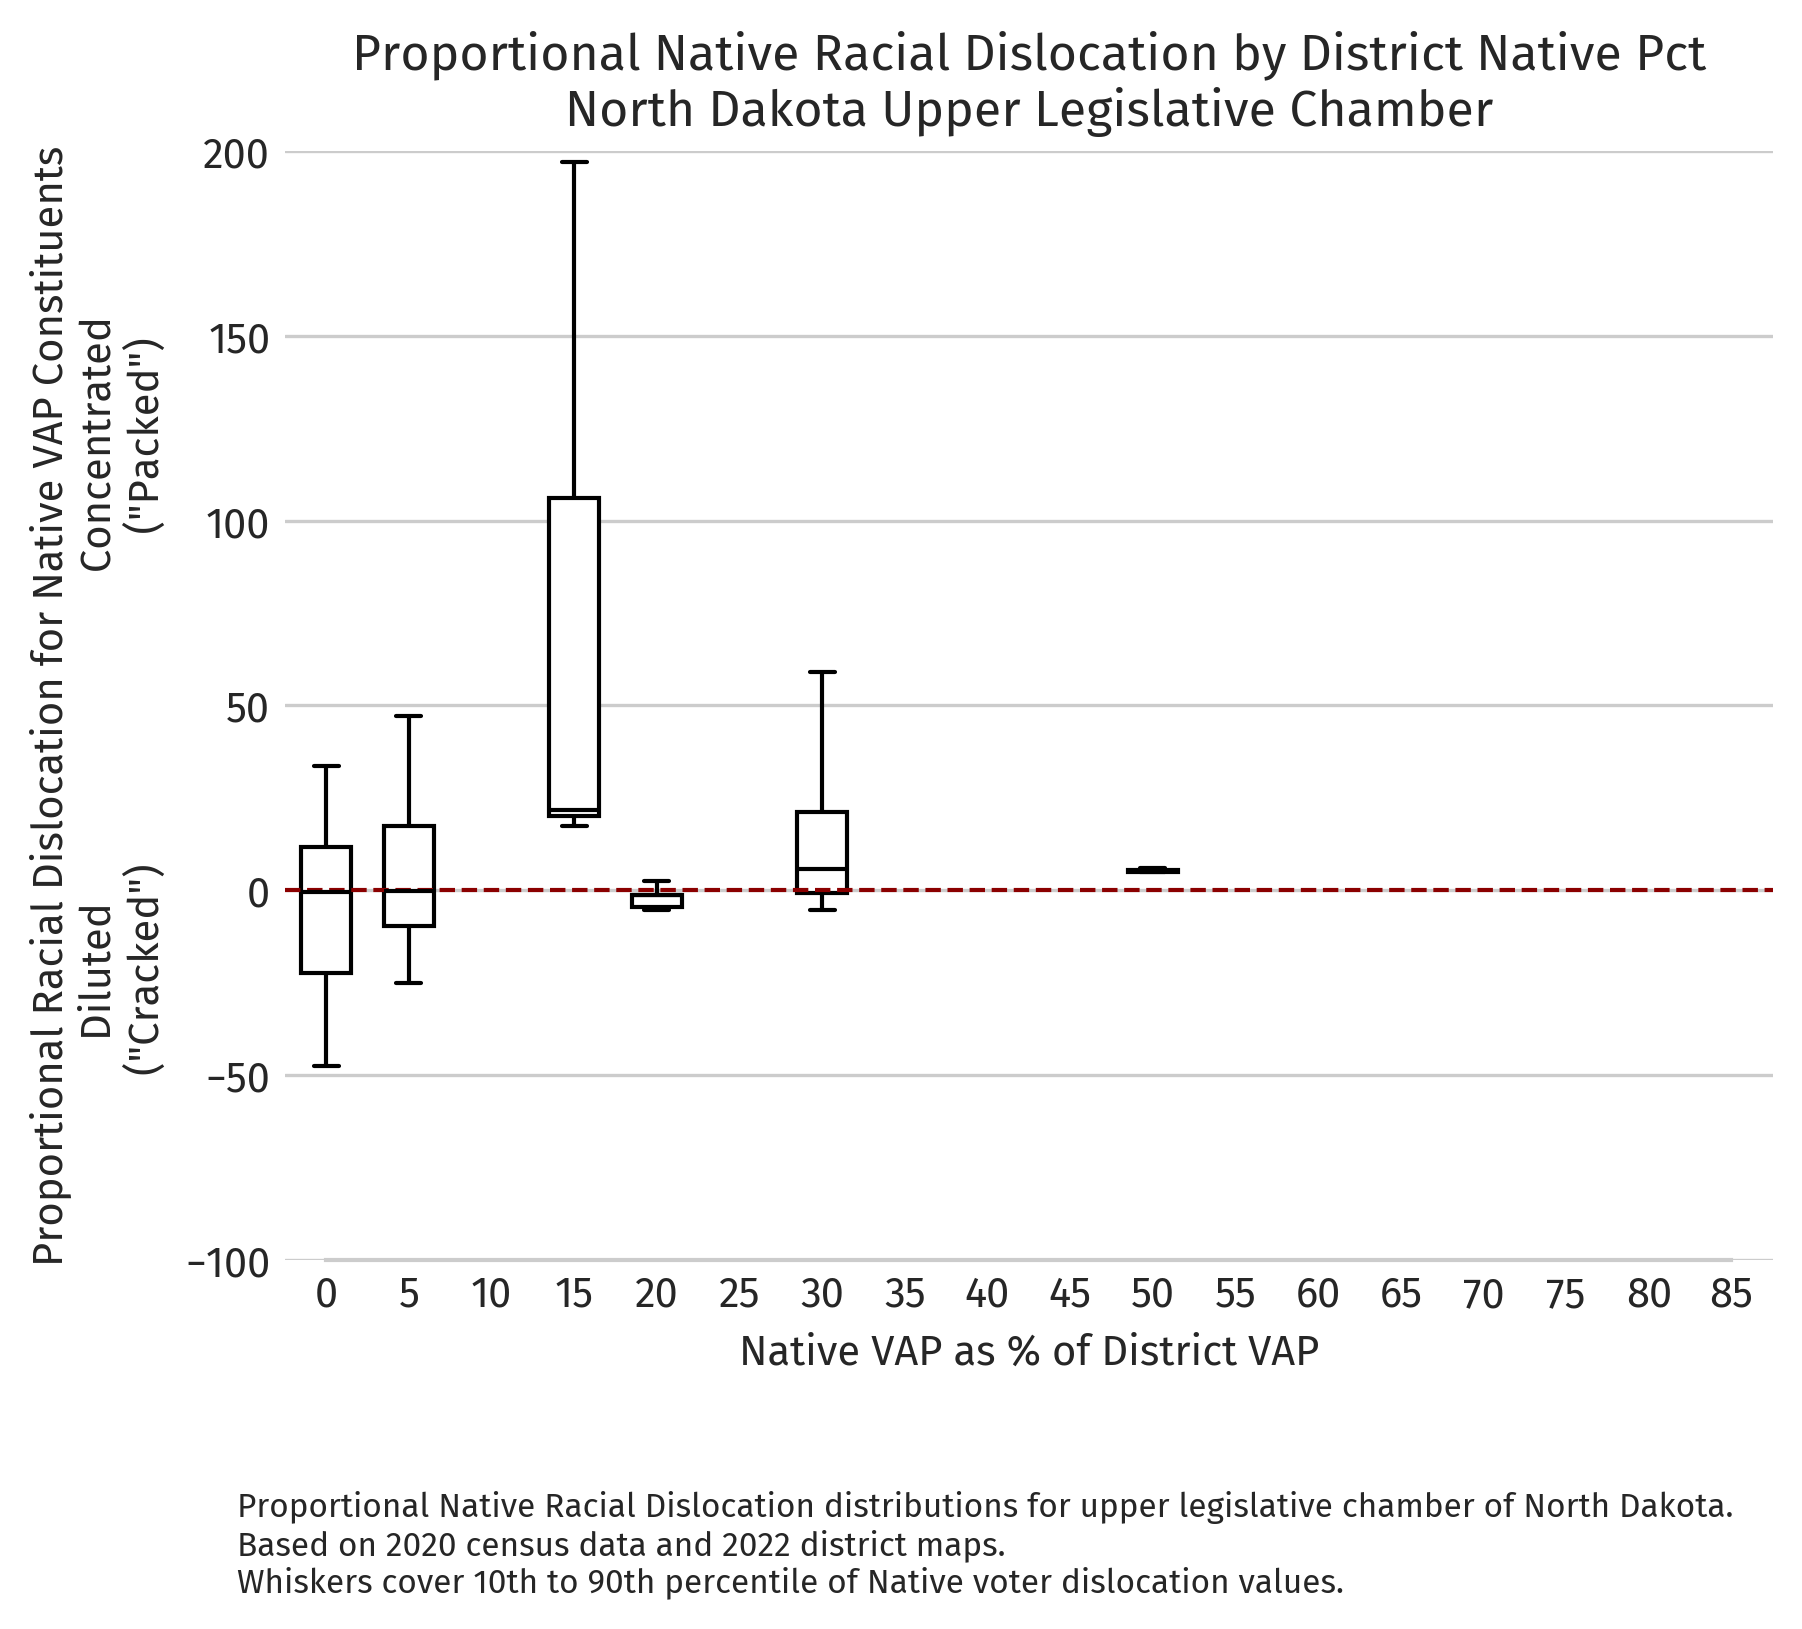
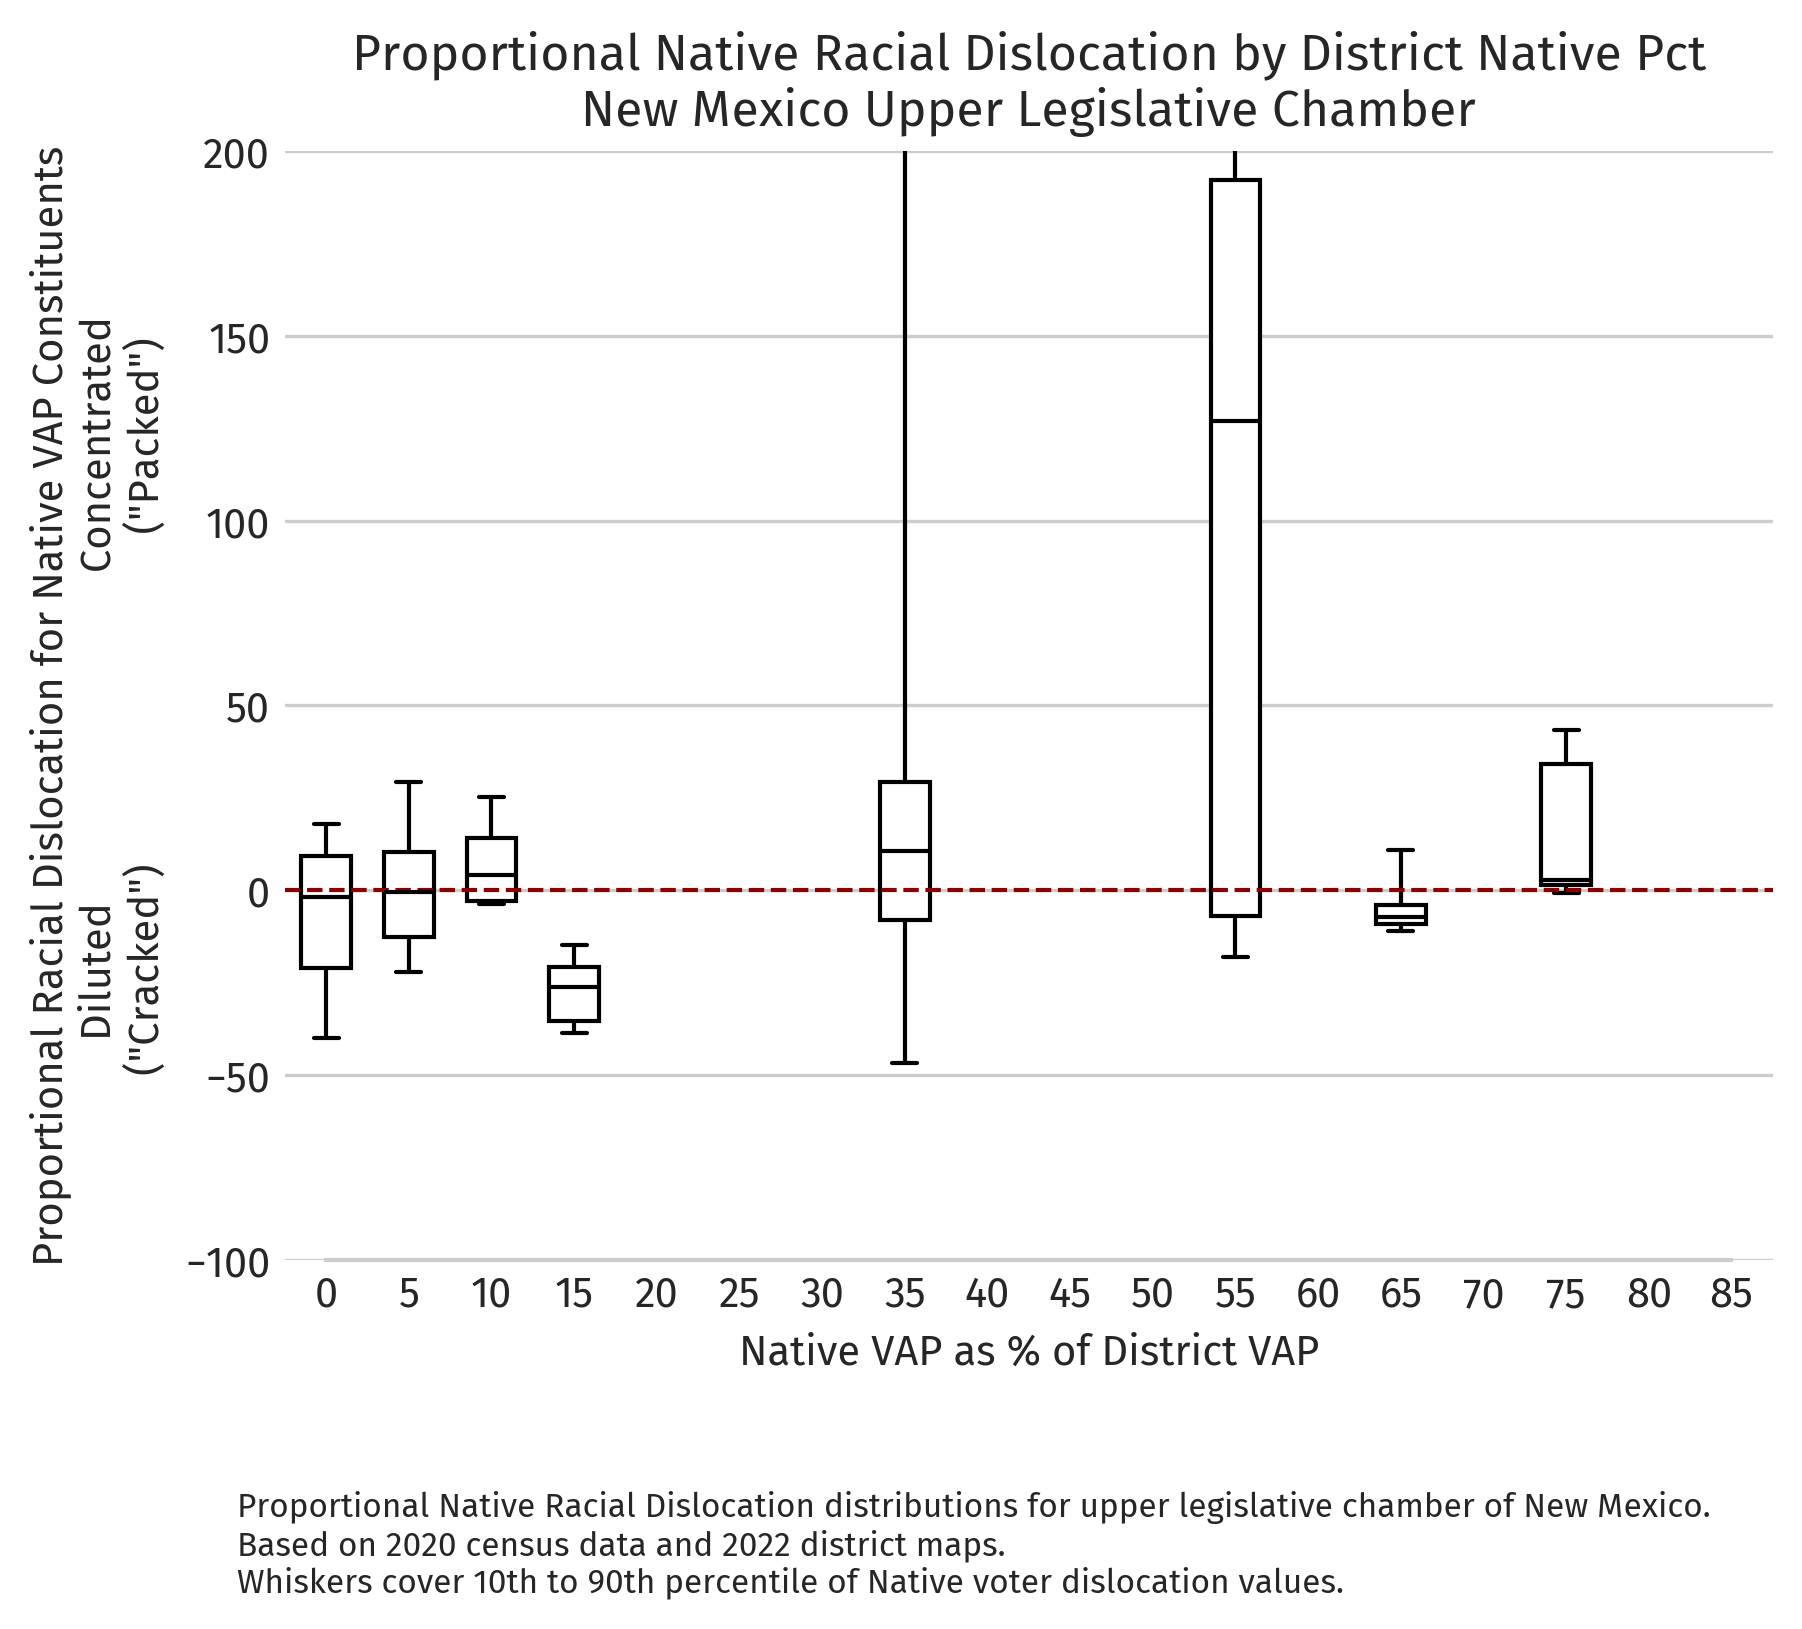
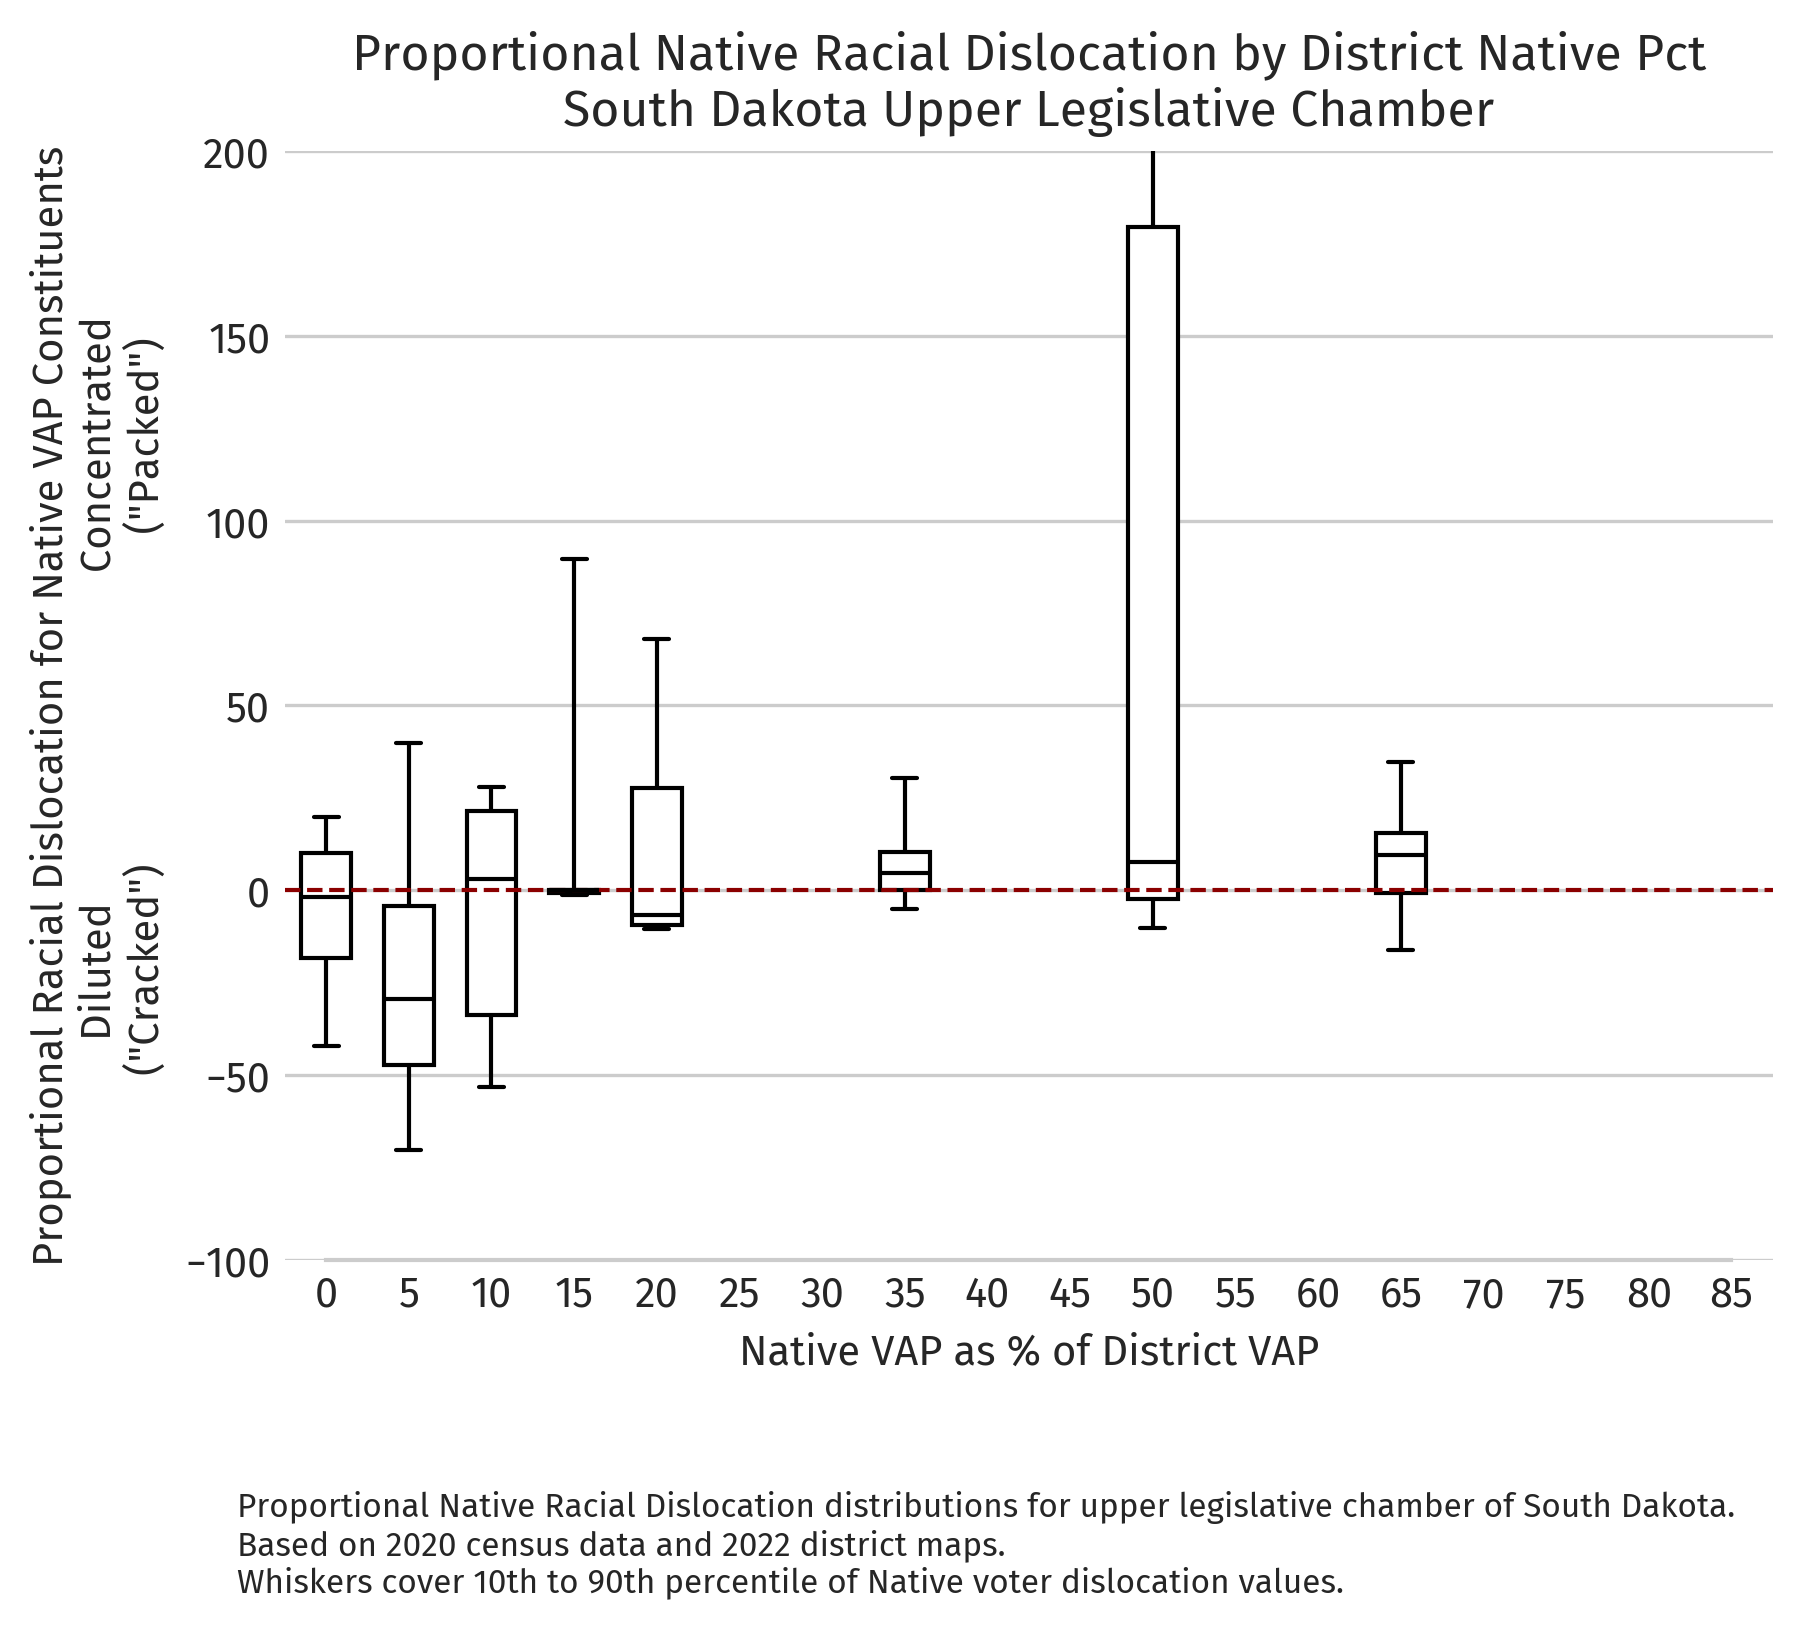
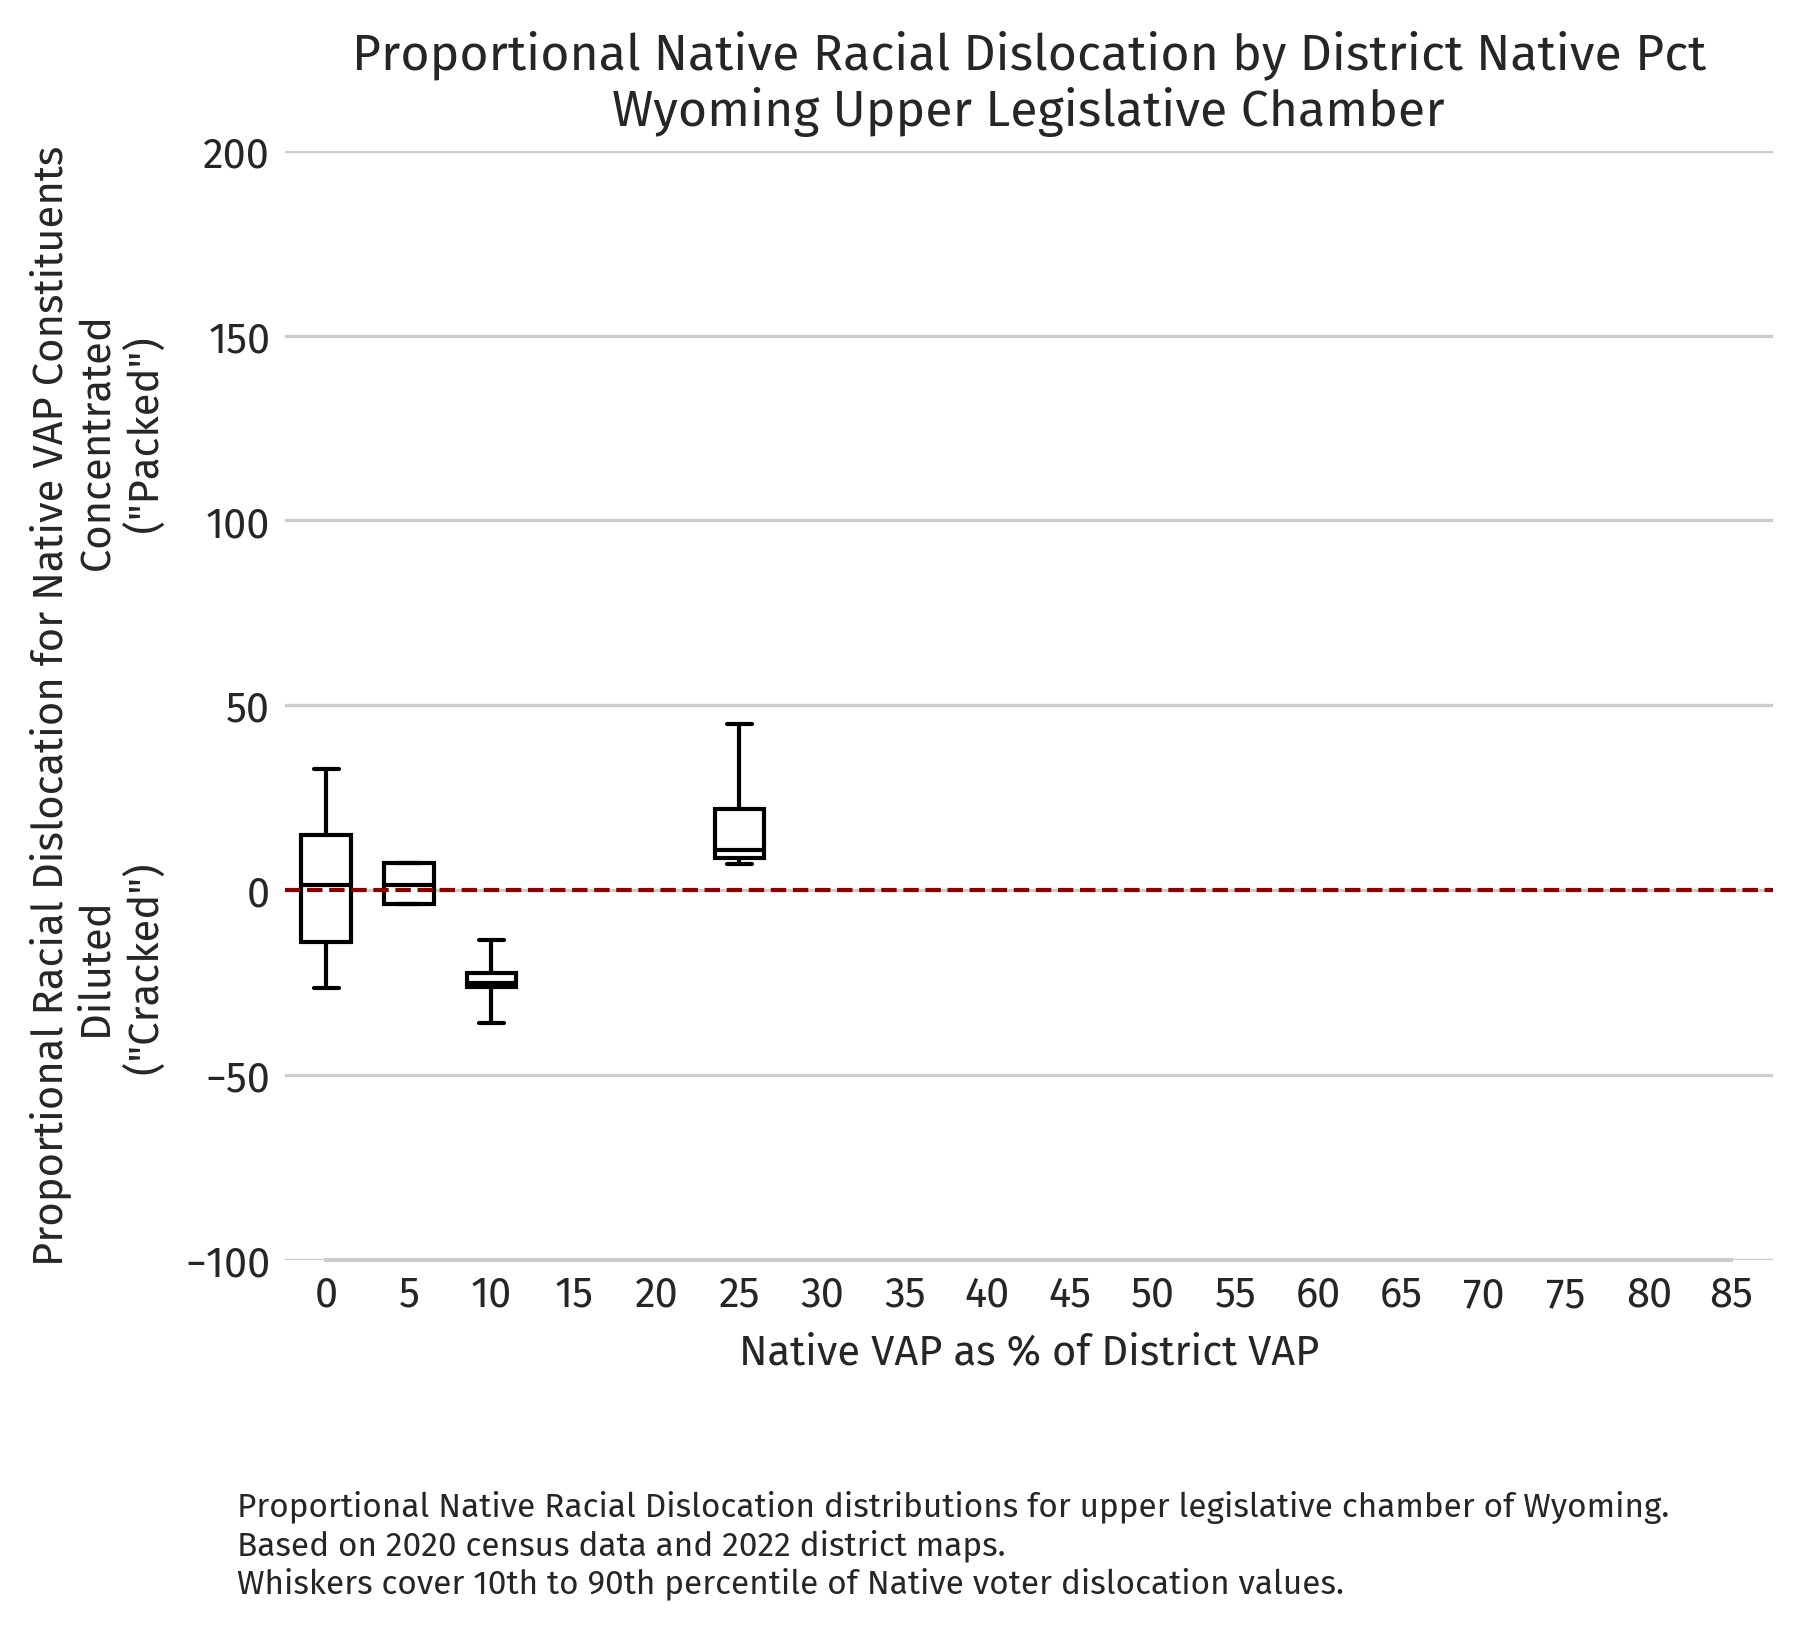
Alaska — Proportional dislocation by district NVAP (2020 redistricting cycle)Arizona — Proportional dislocation by district NVAP (2020 redistricting cycle)Montana — Proportional dislocation by district NVAP (2020 redistricting cycle)North Dakota — Proportional dislocation by district NVAP (2020 redistricting cycle)New Mexico — Proportional dislocation by district NVAP (2020 redistricting cycle)South Dakota — Proportional dislocation by district NVAP (2020 redistricting cycle)Wyoming — Proportional dislocation by district NVAP (2020 redistricting cycle)
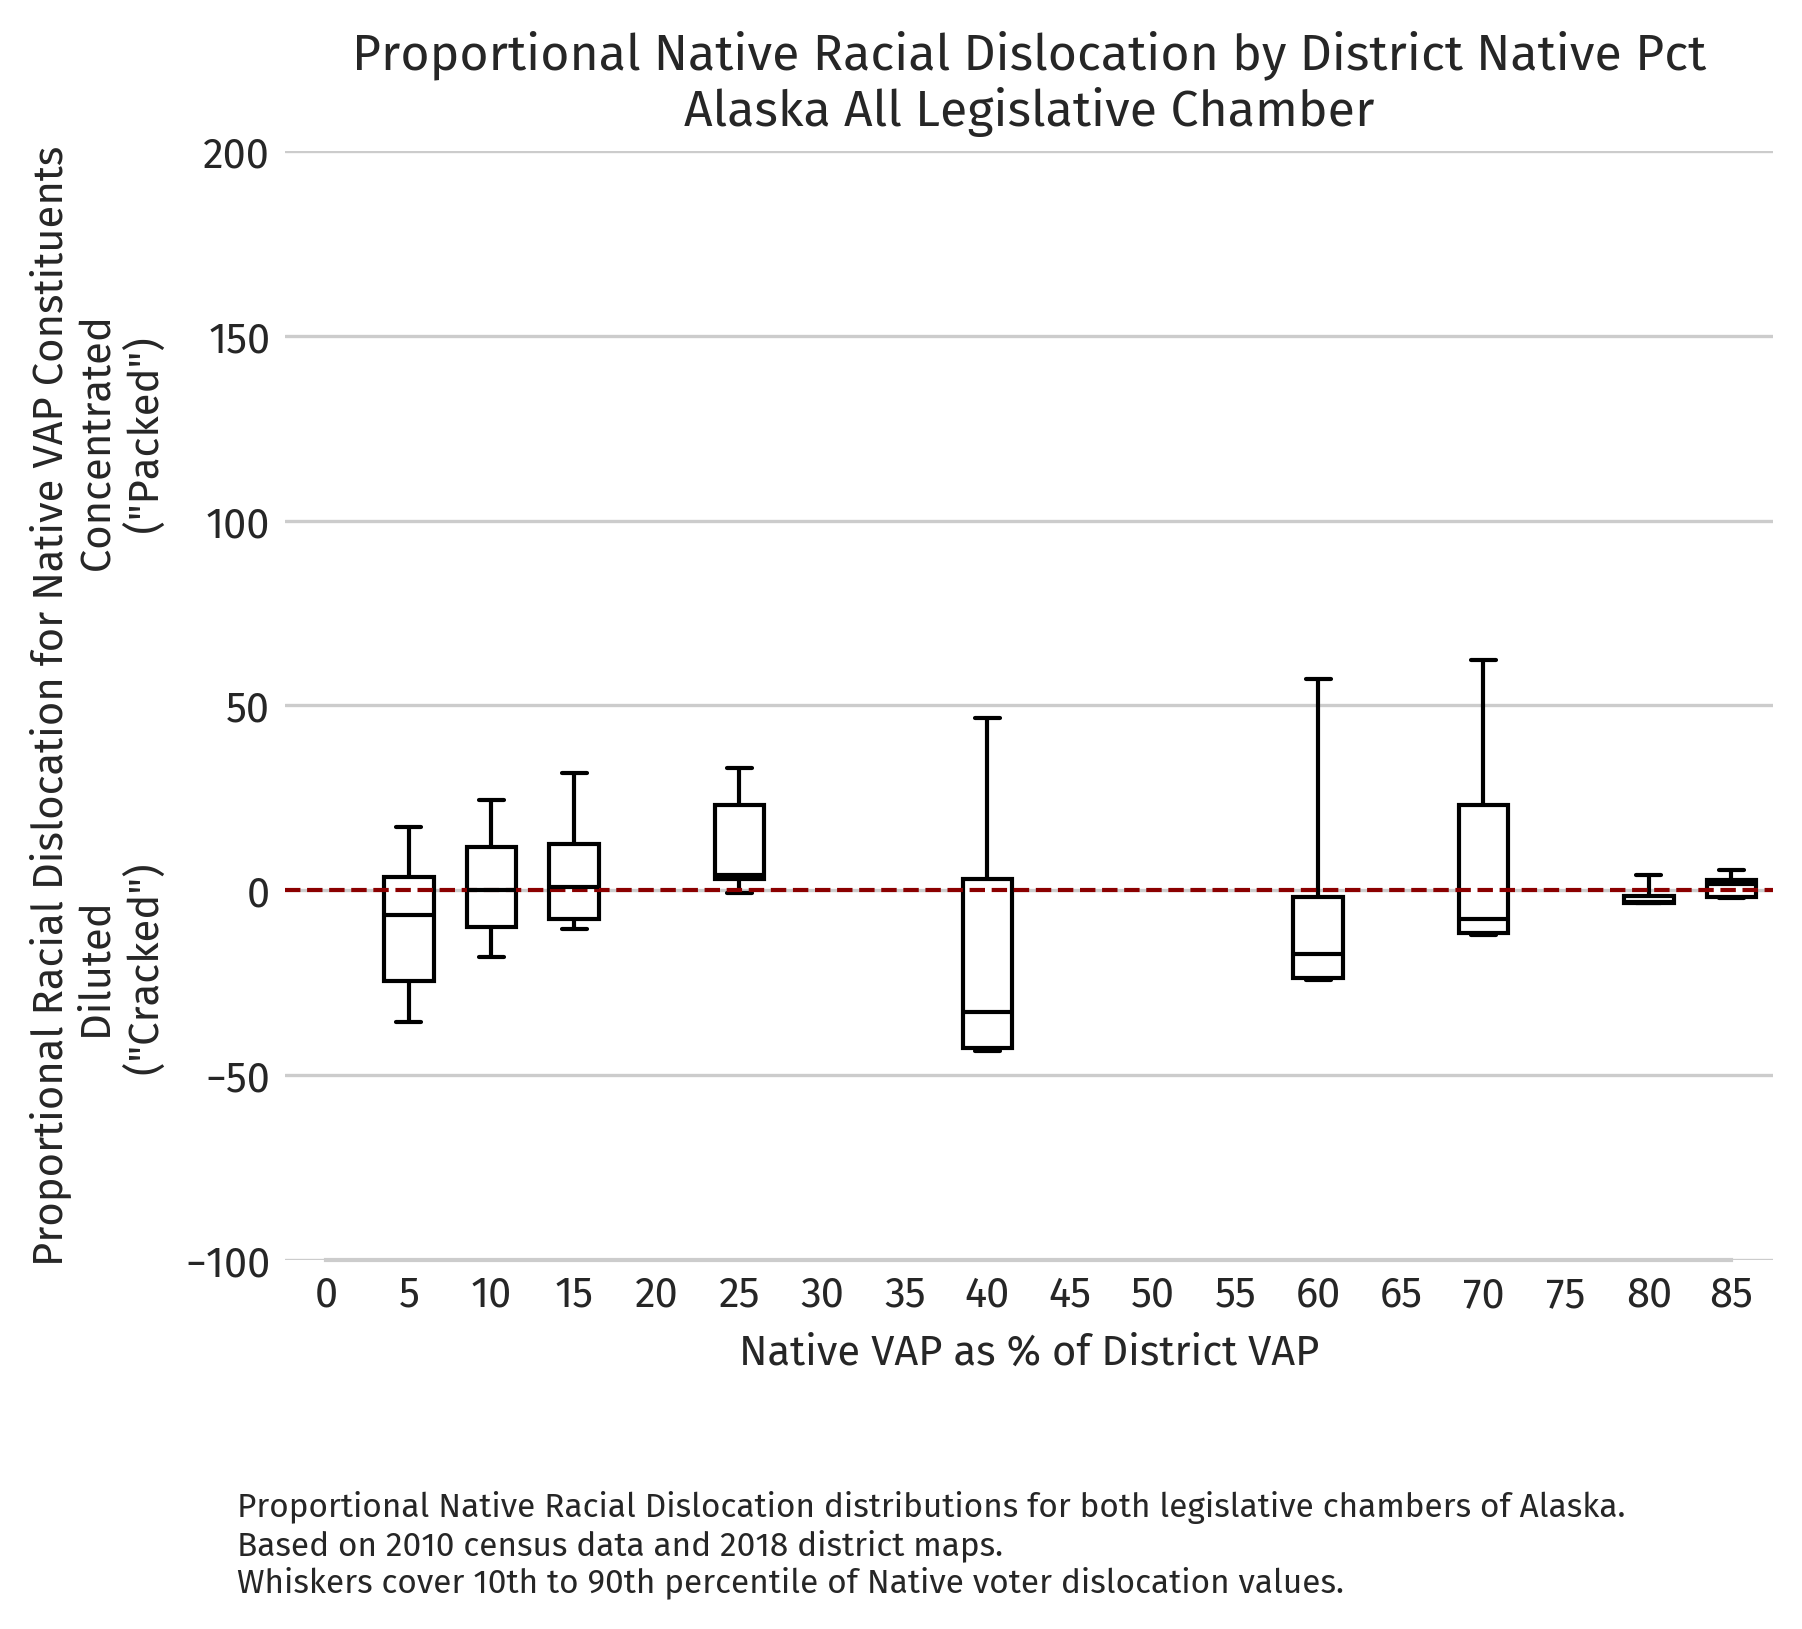
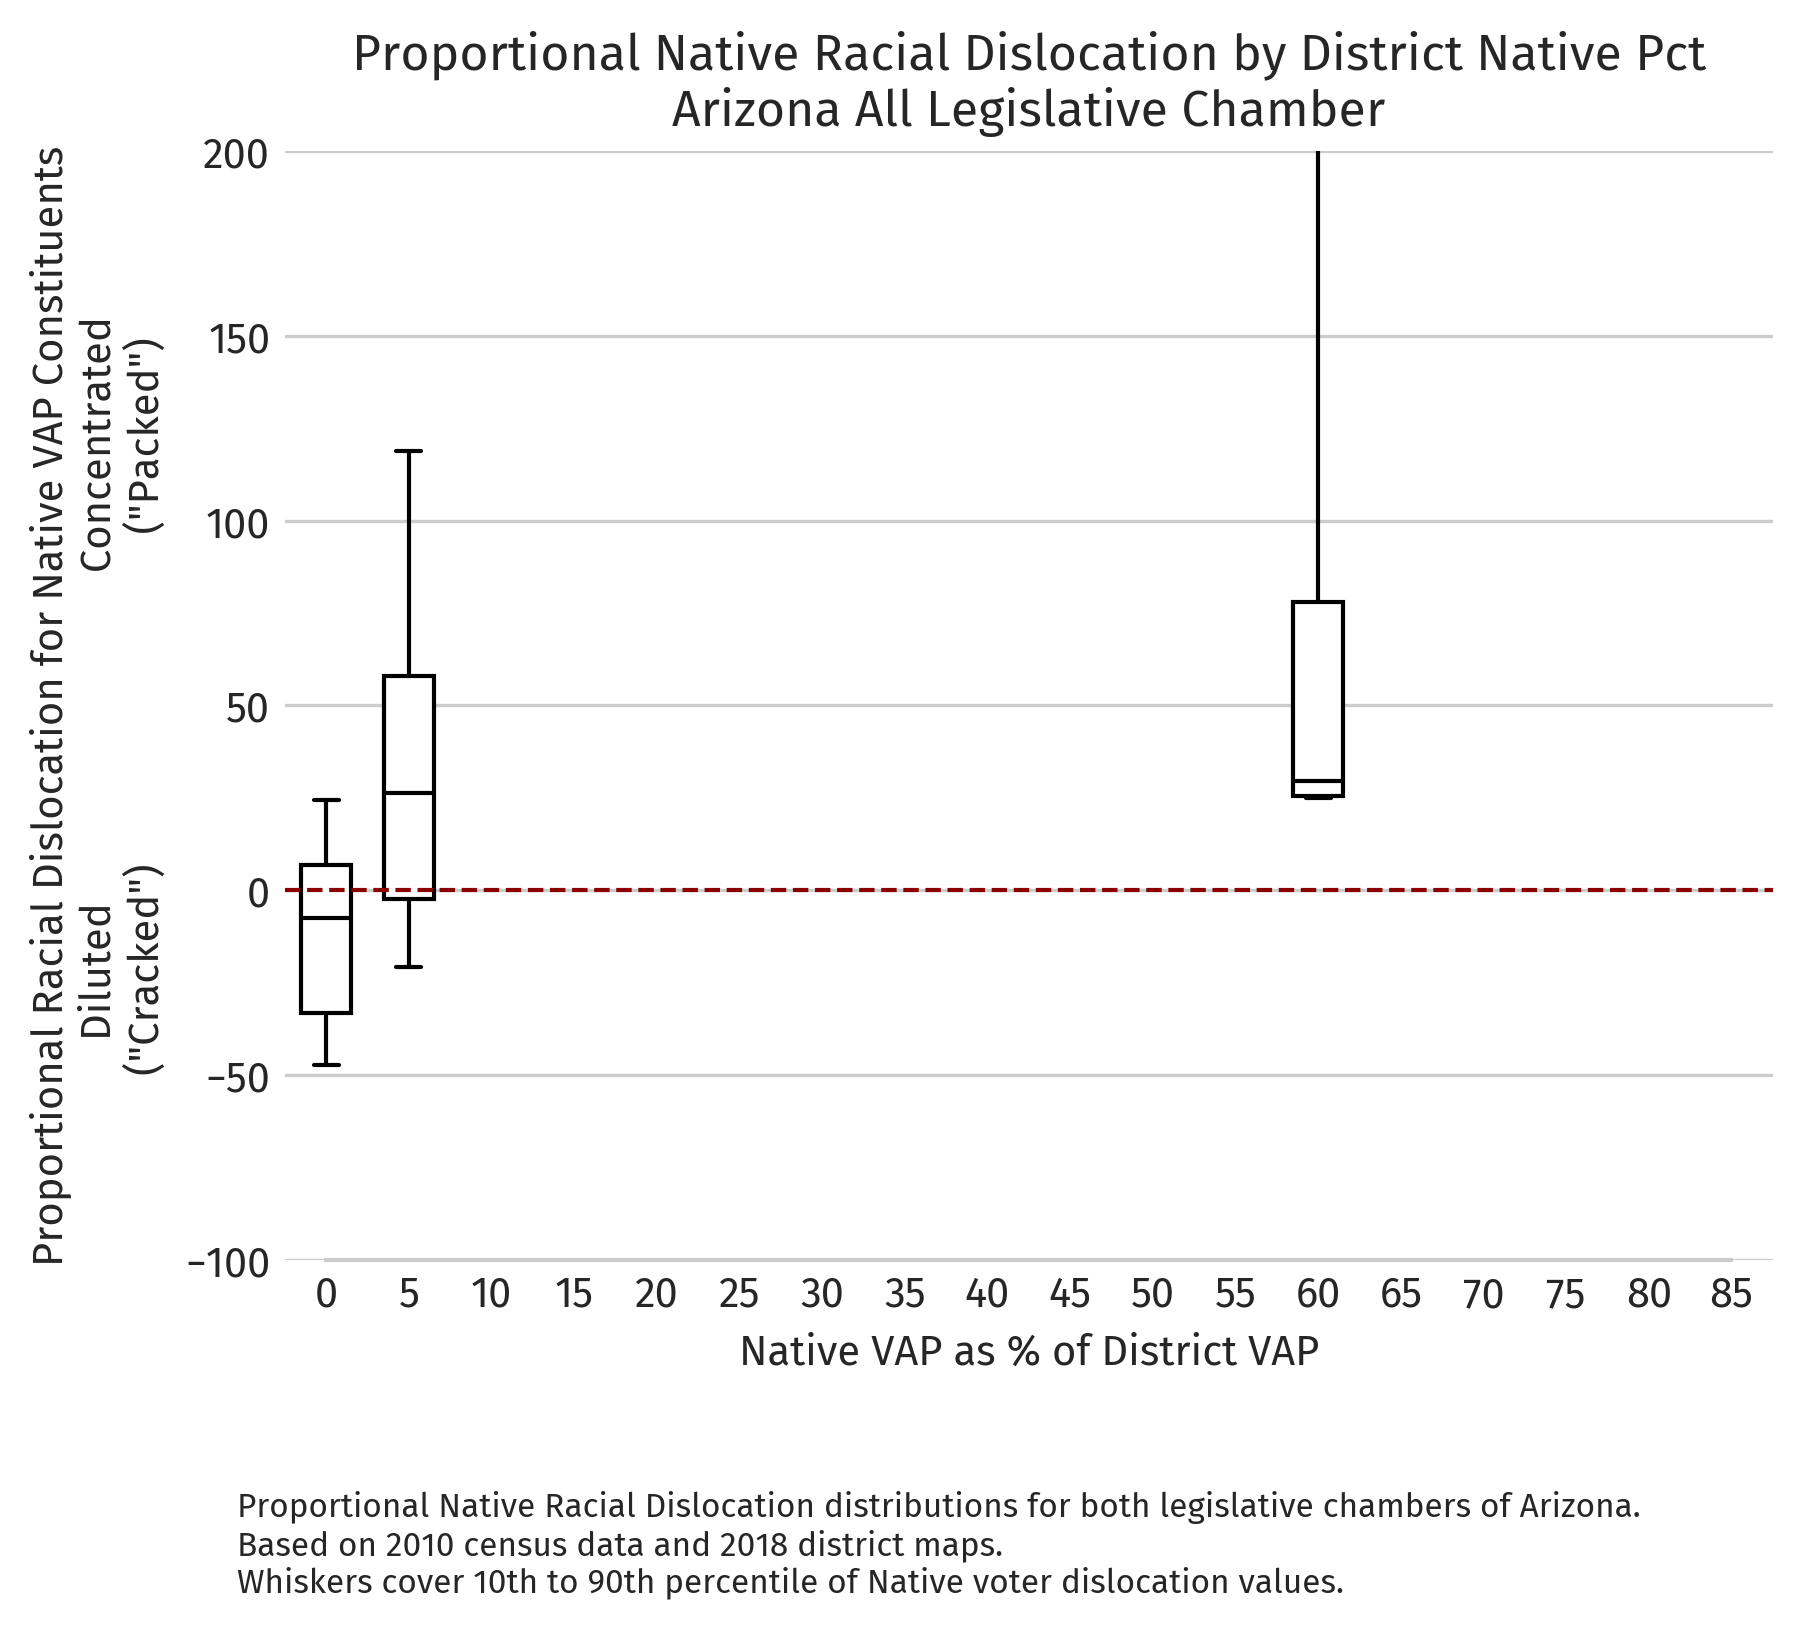
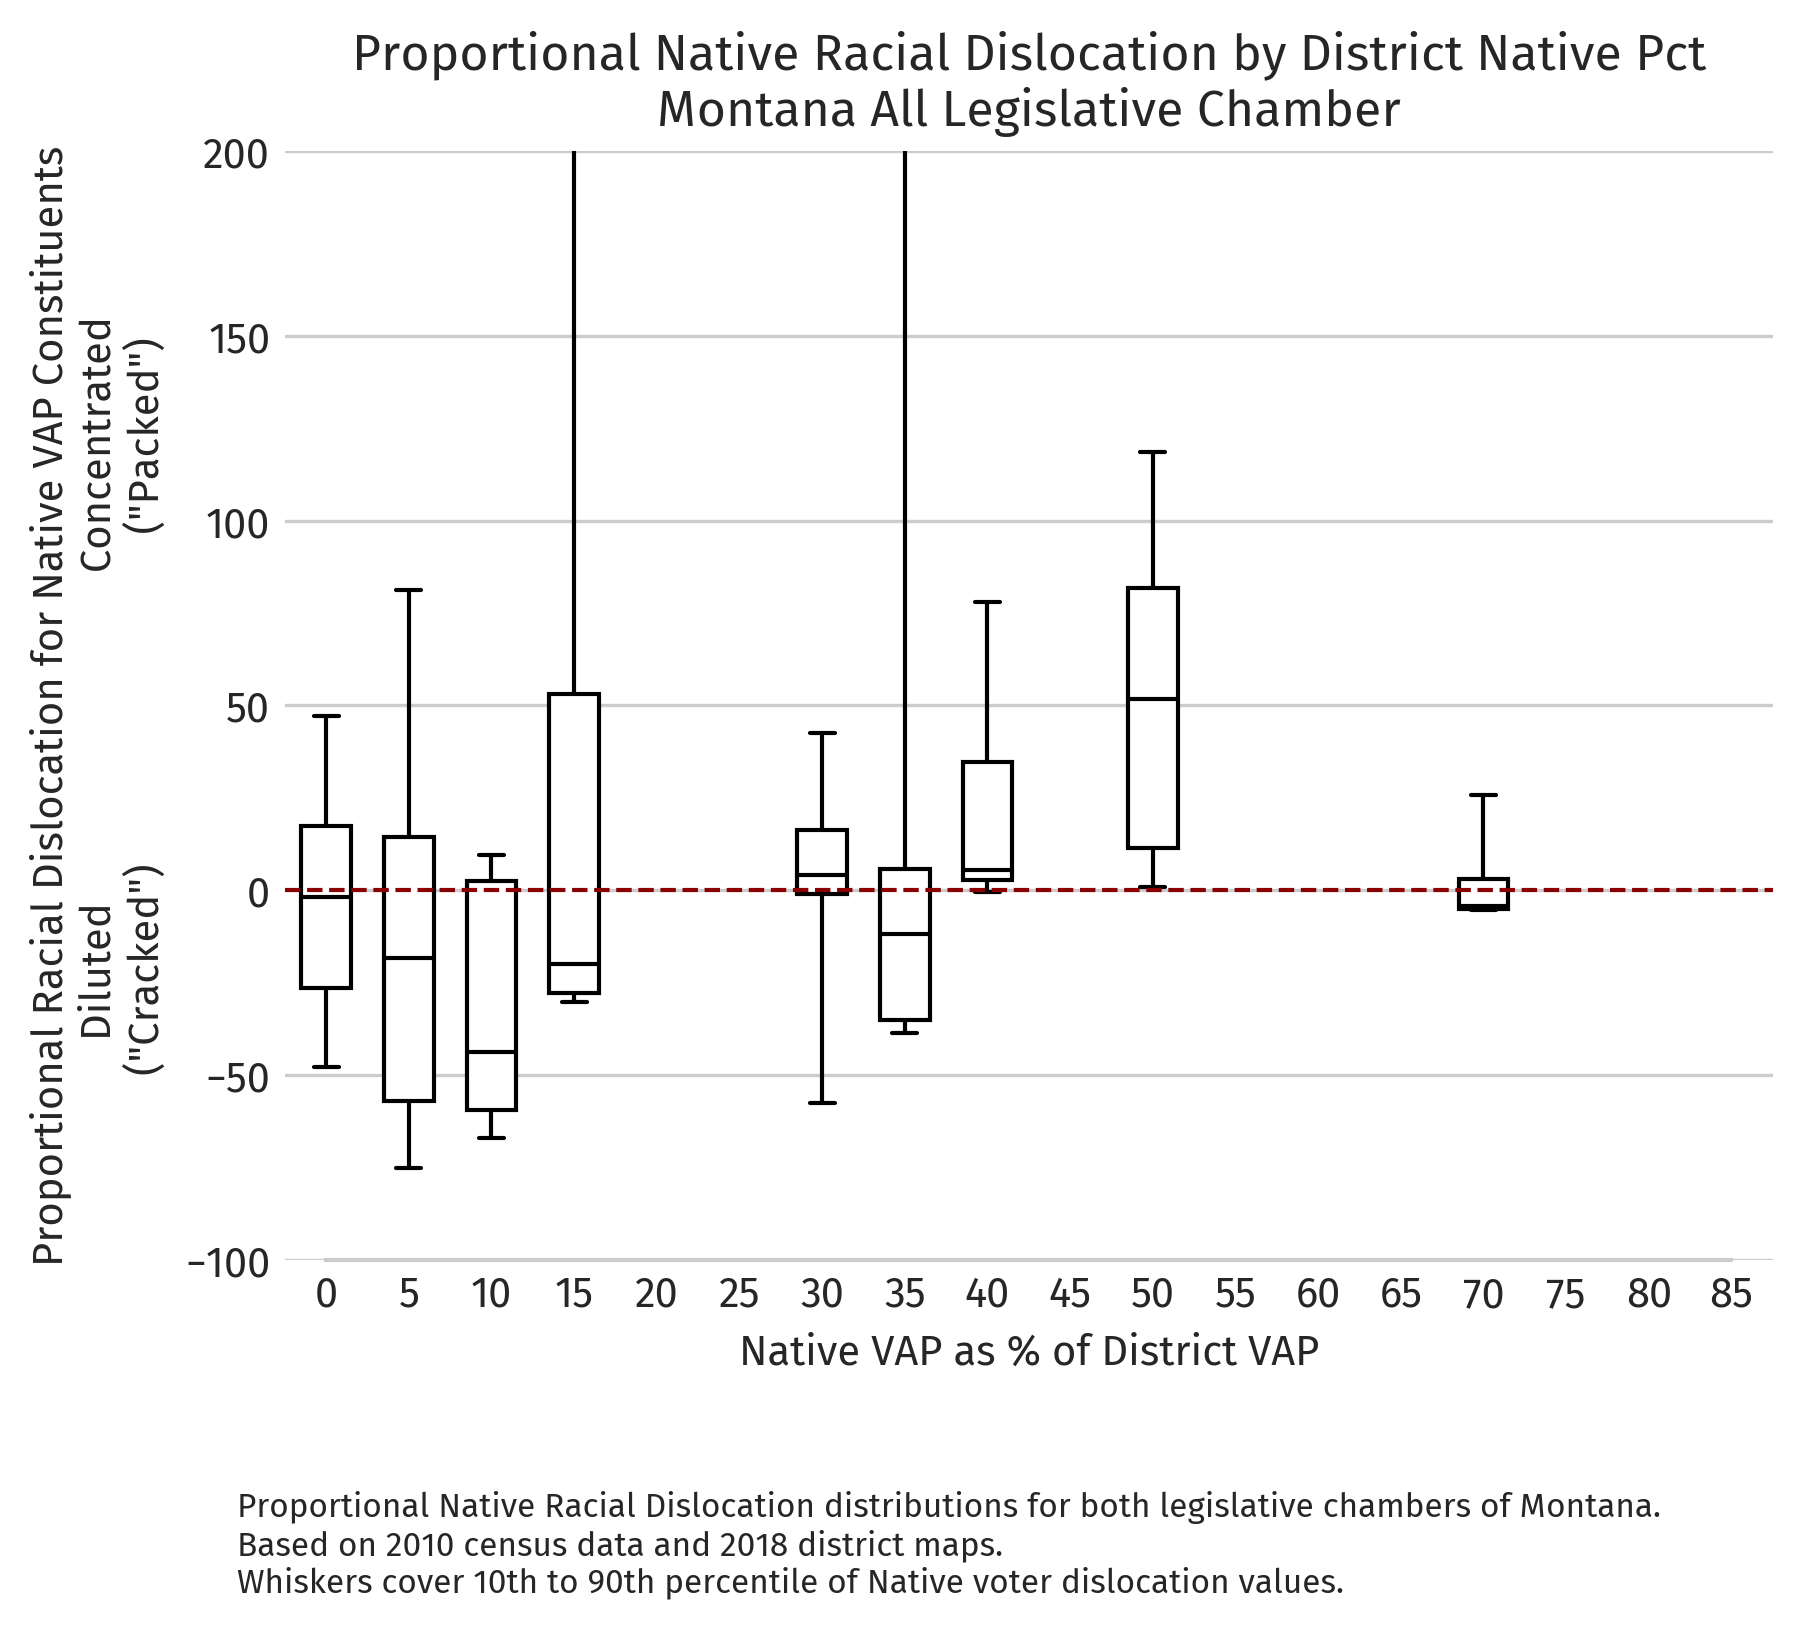
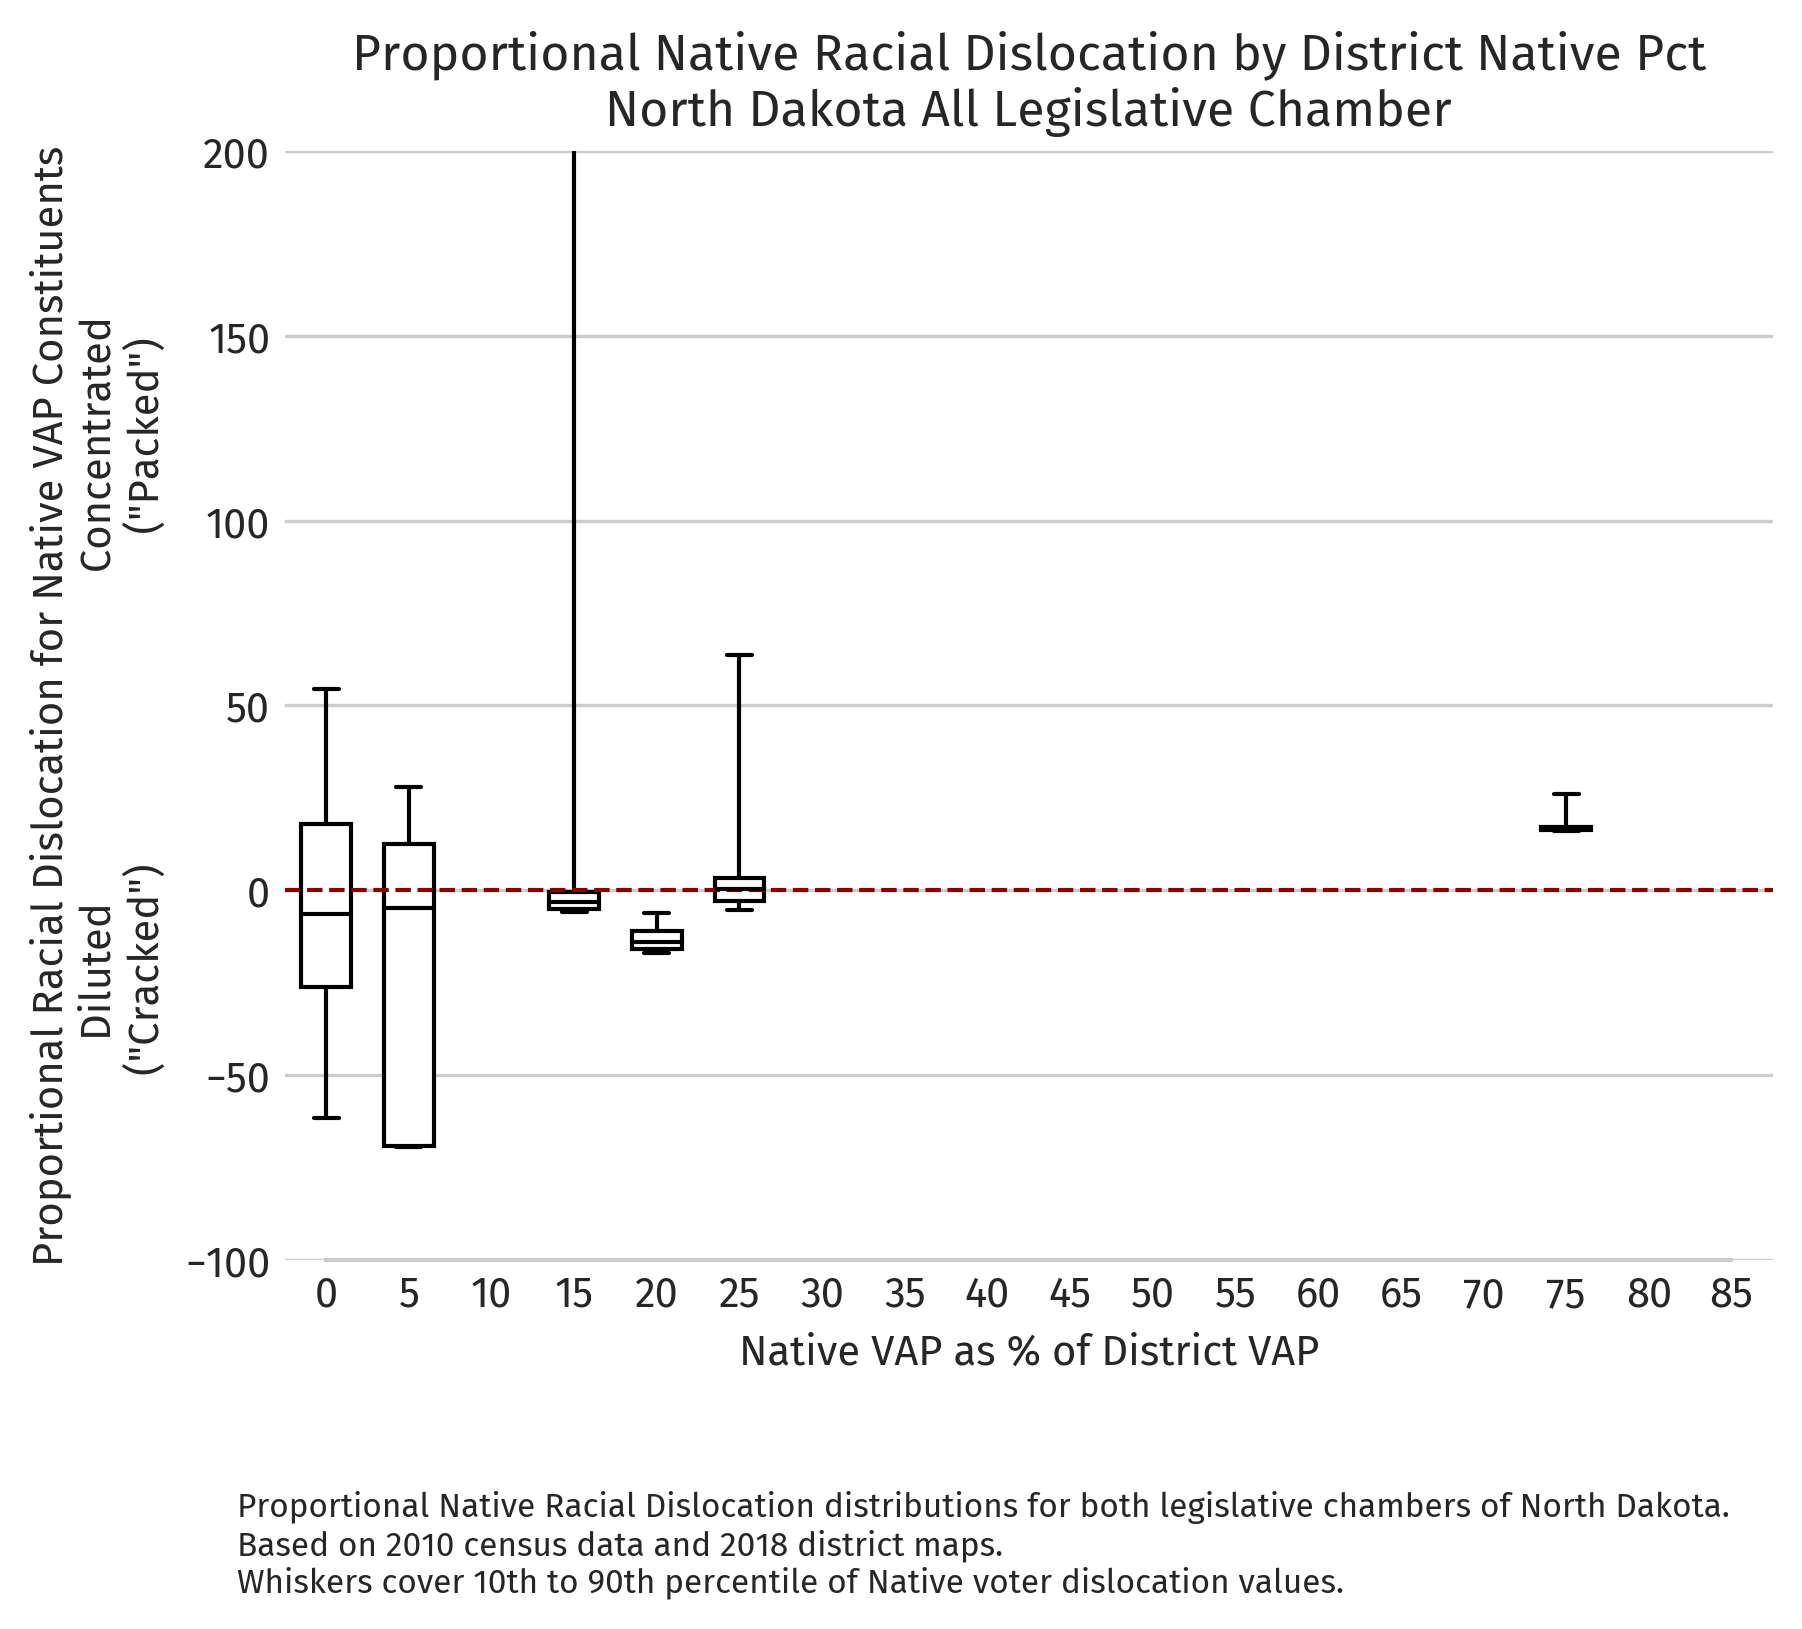
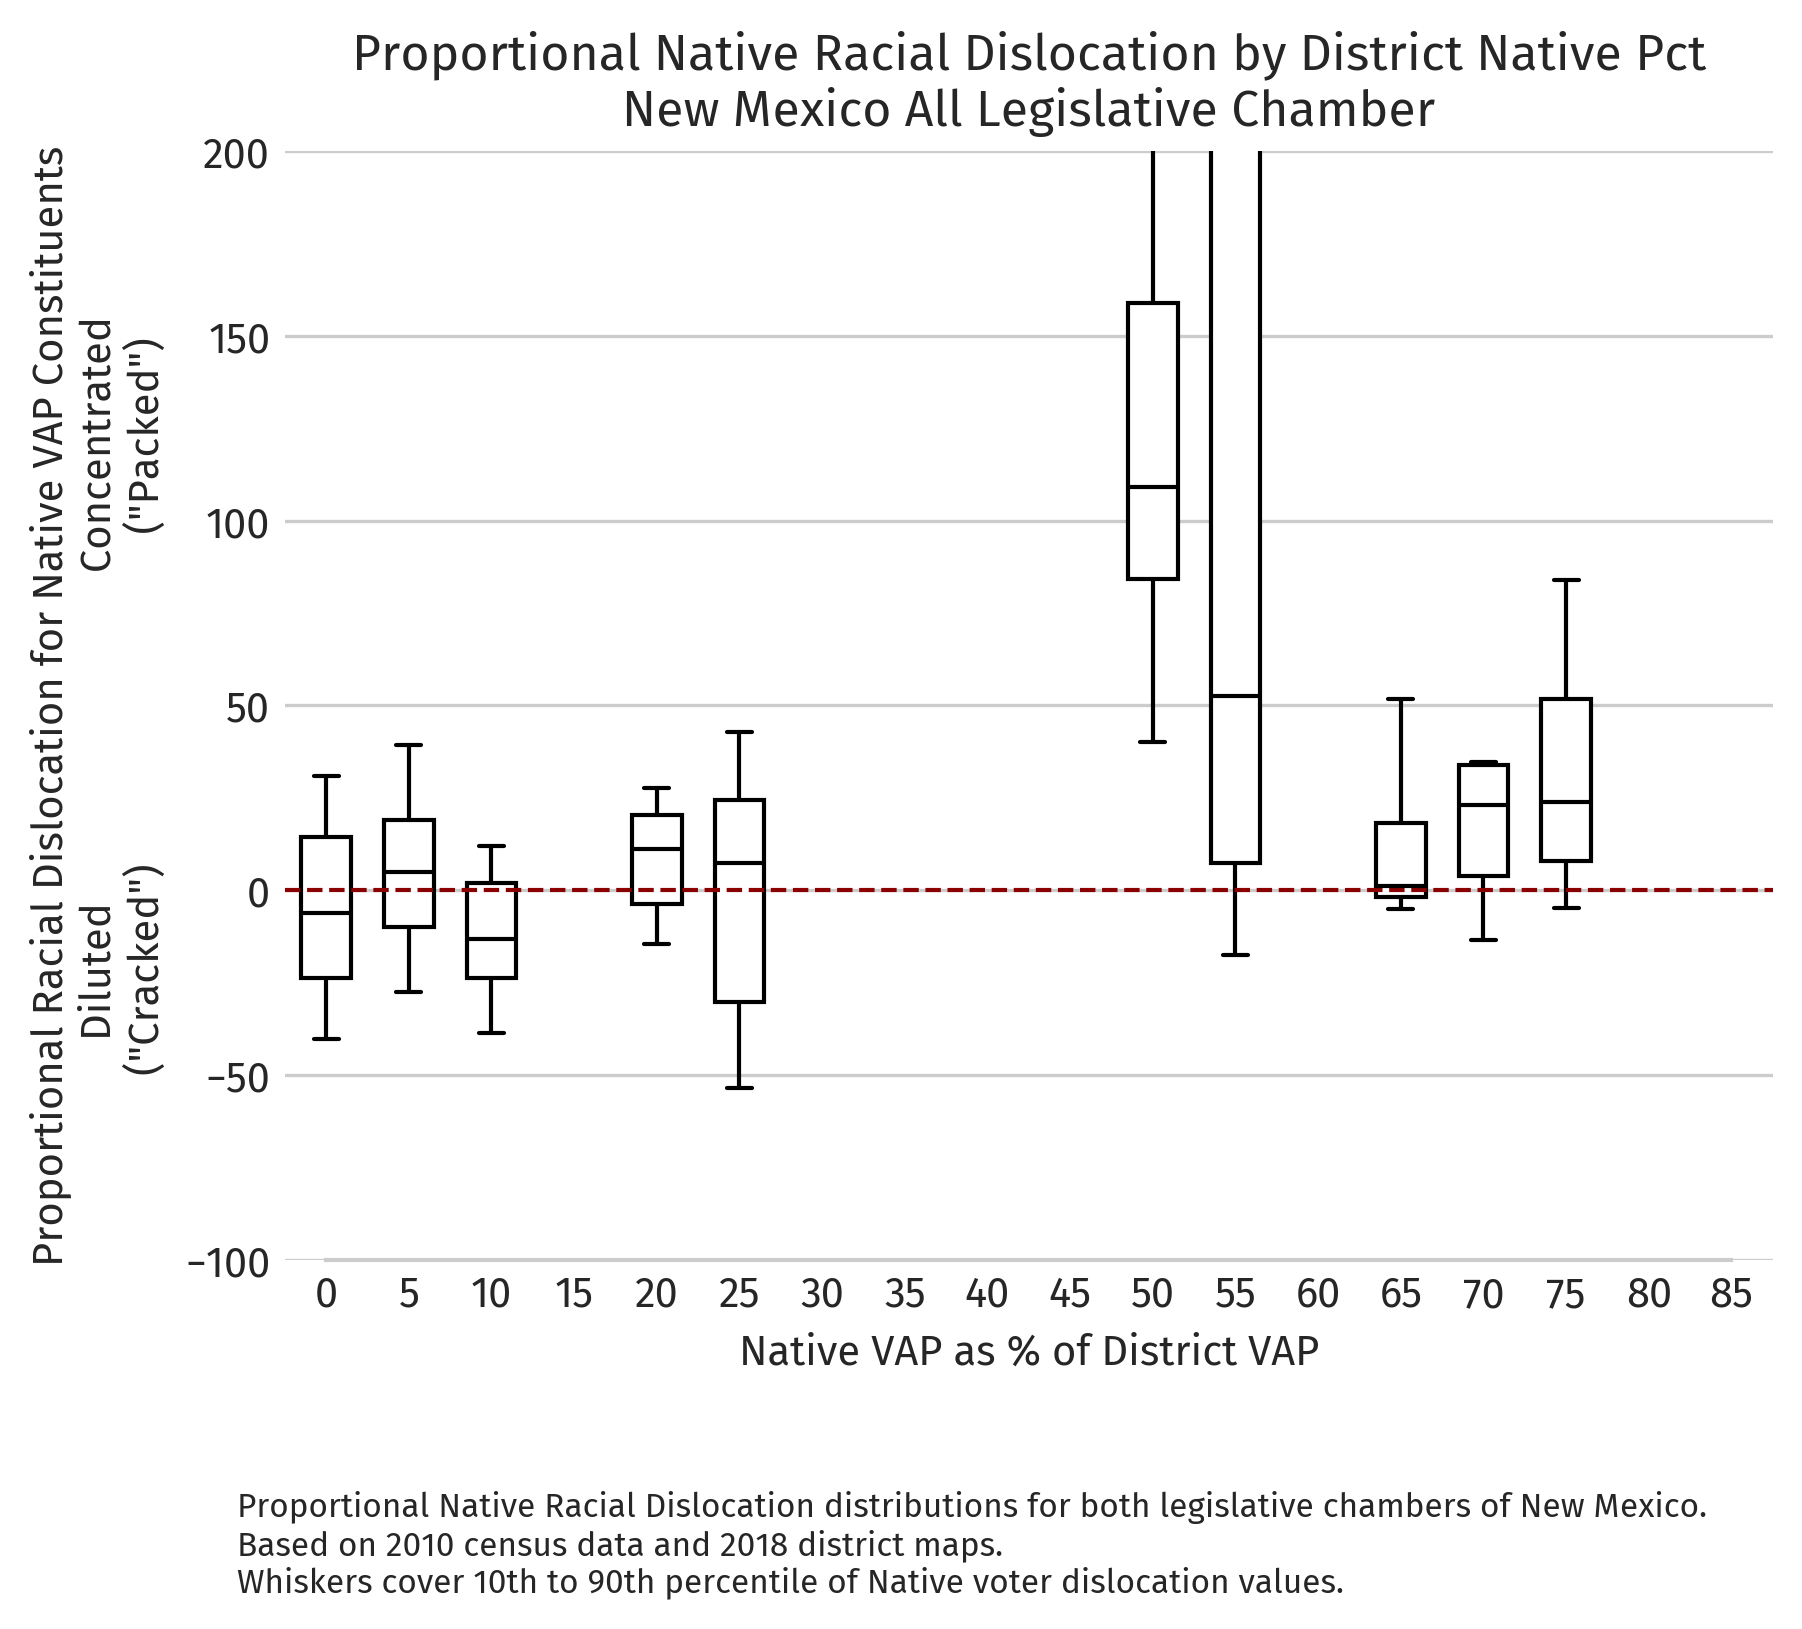
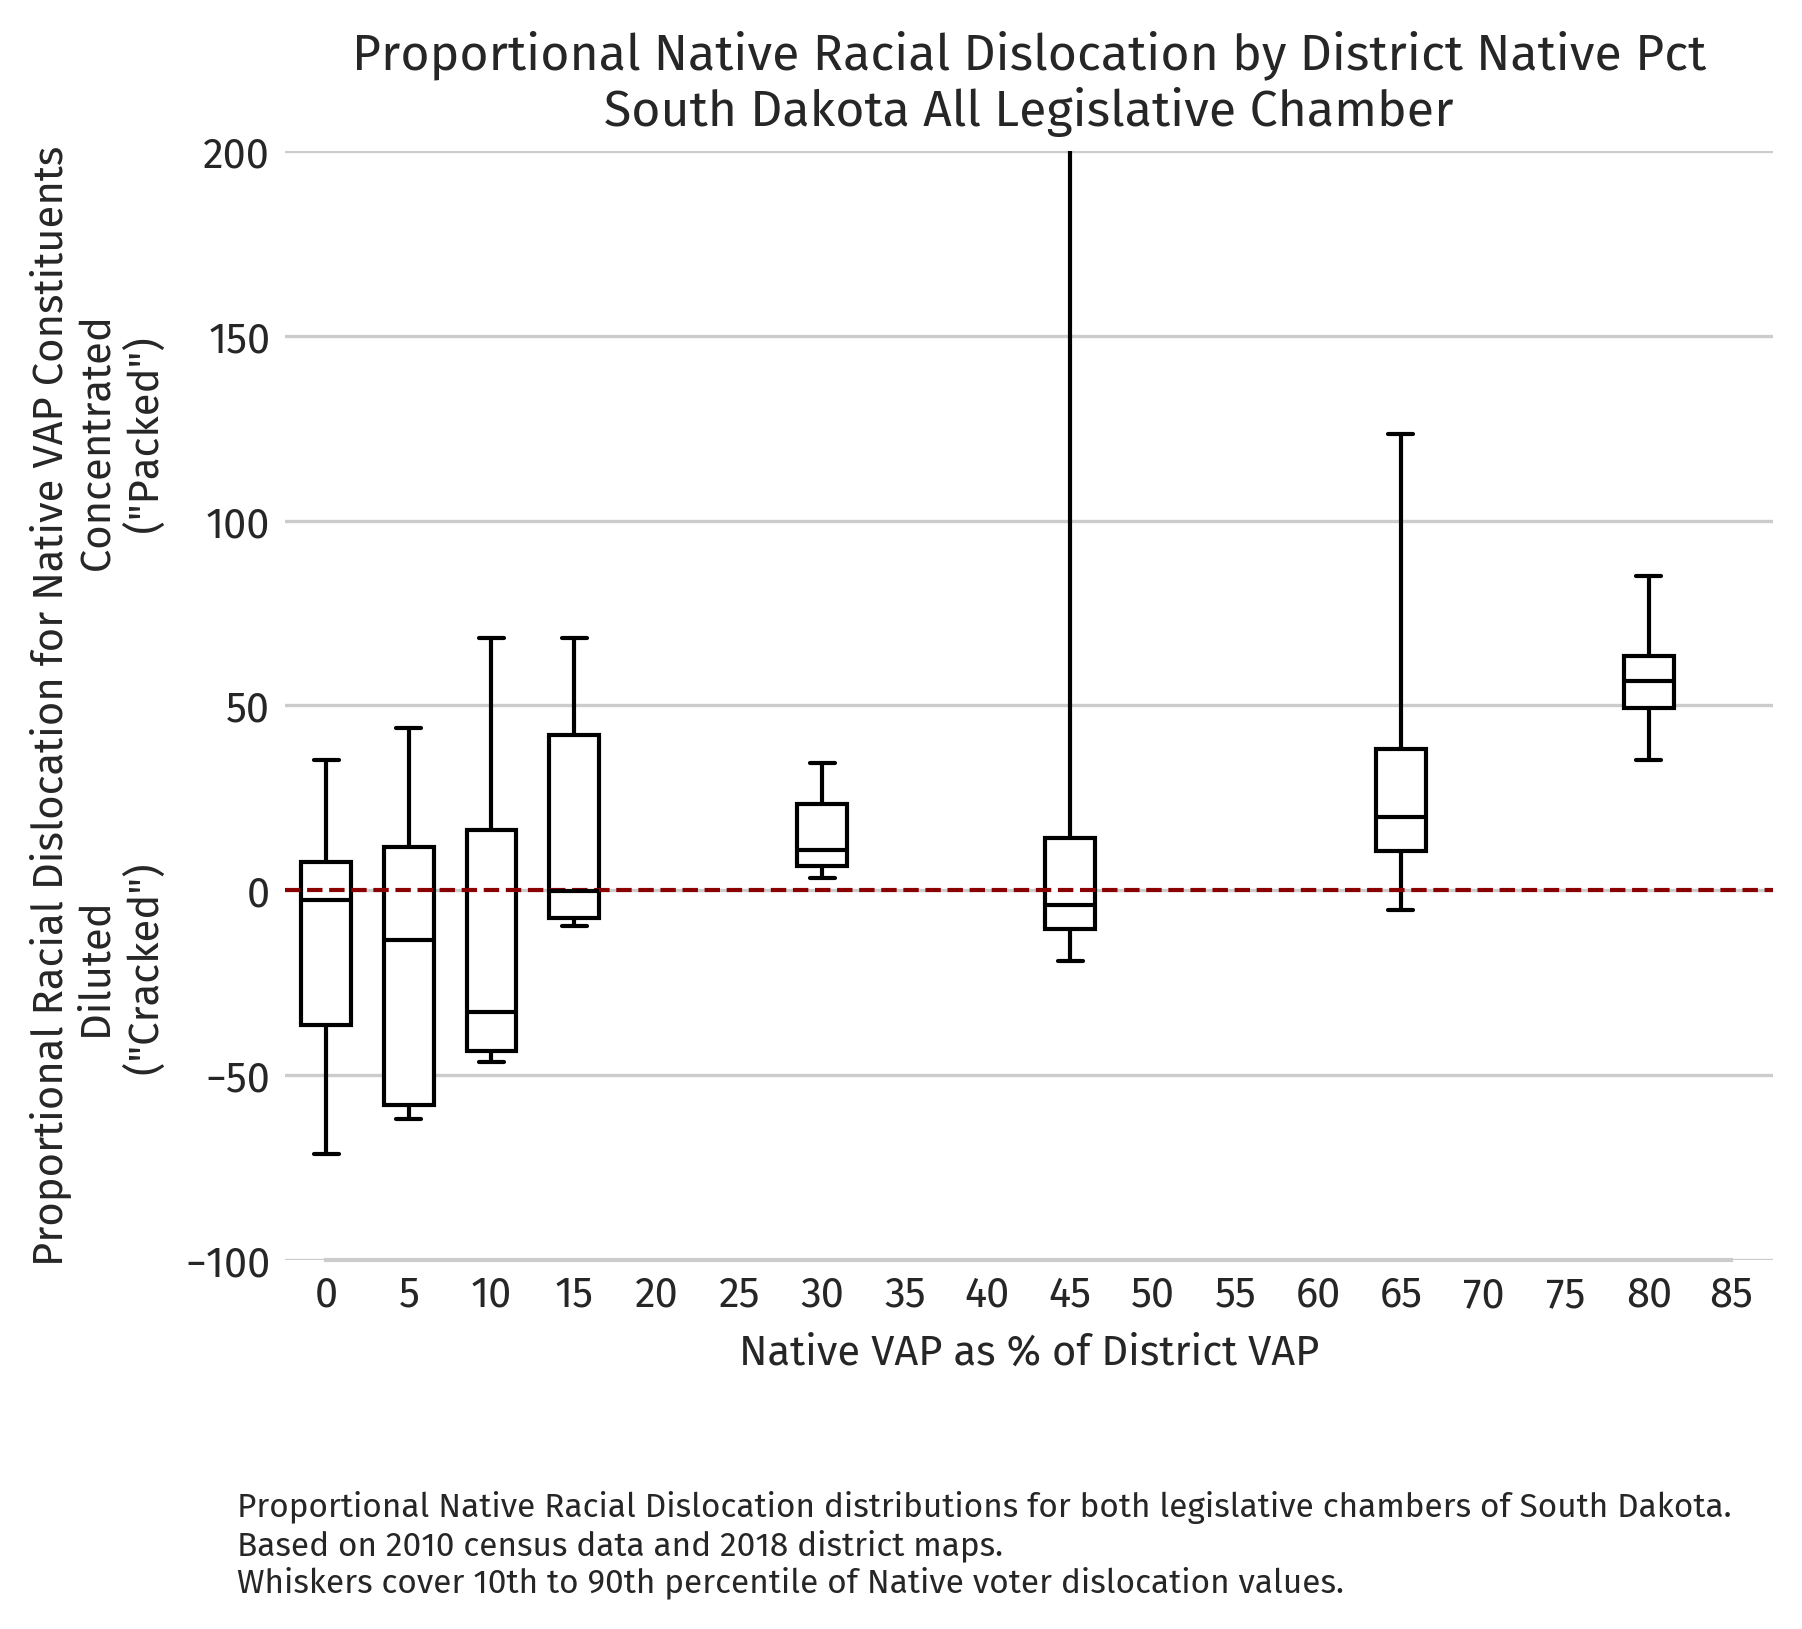
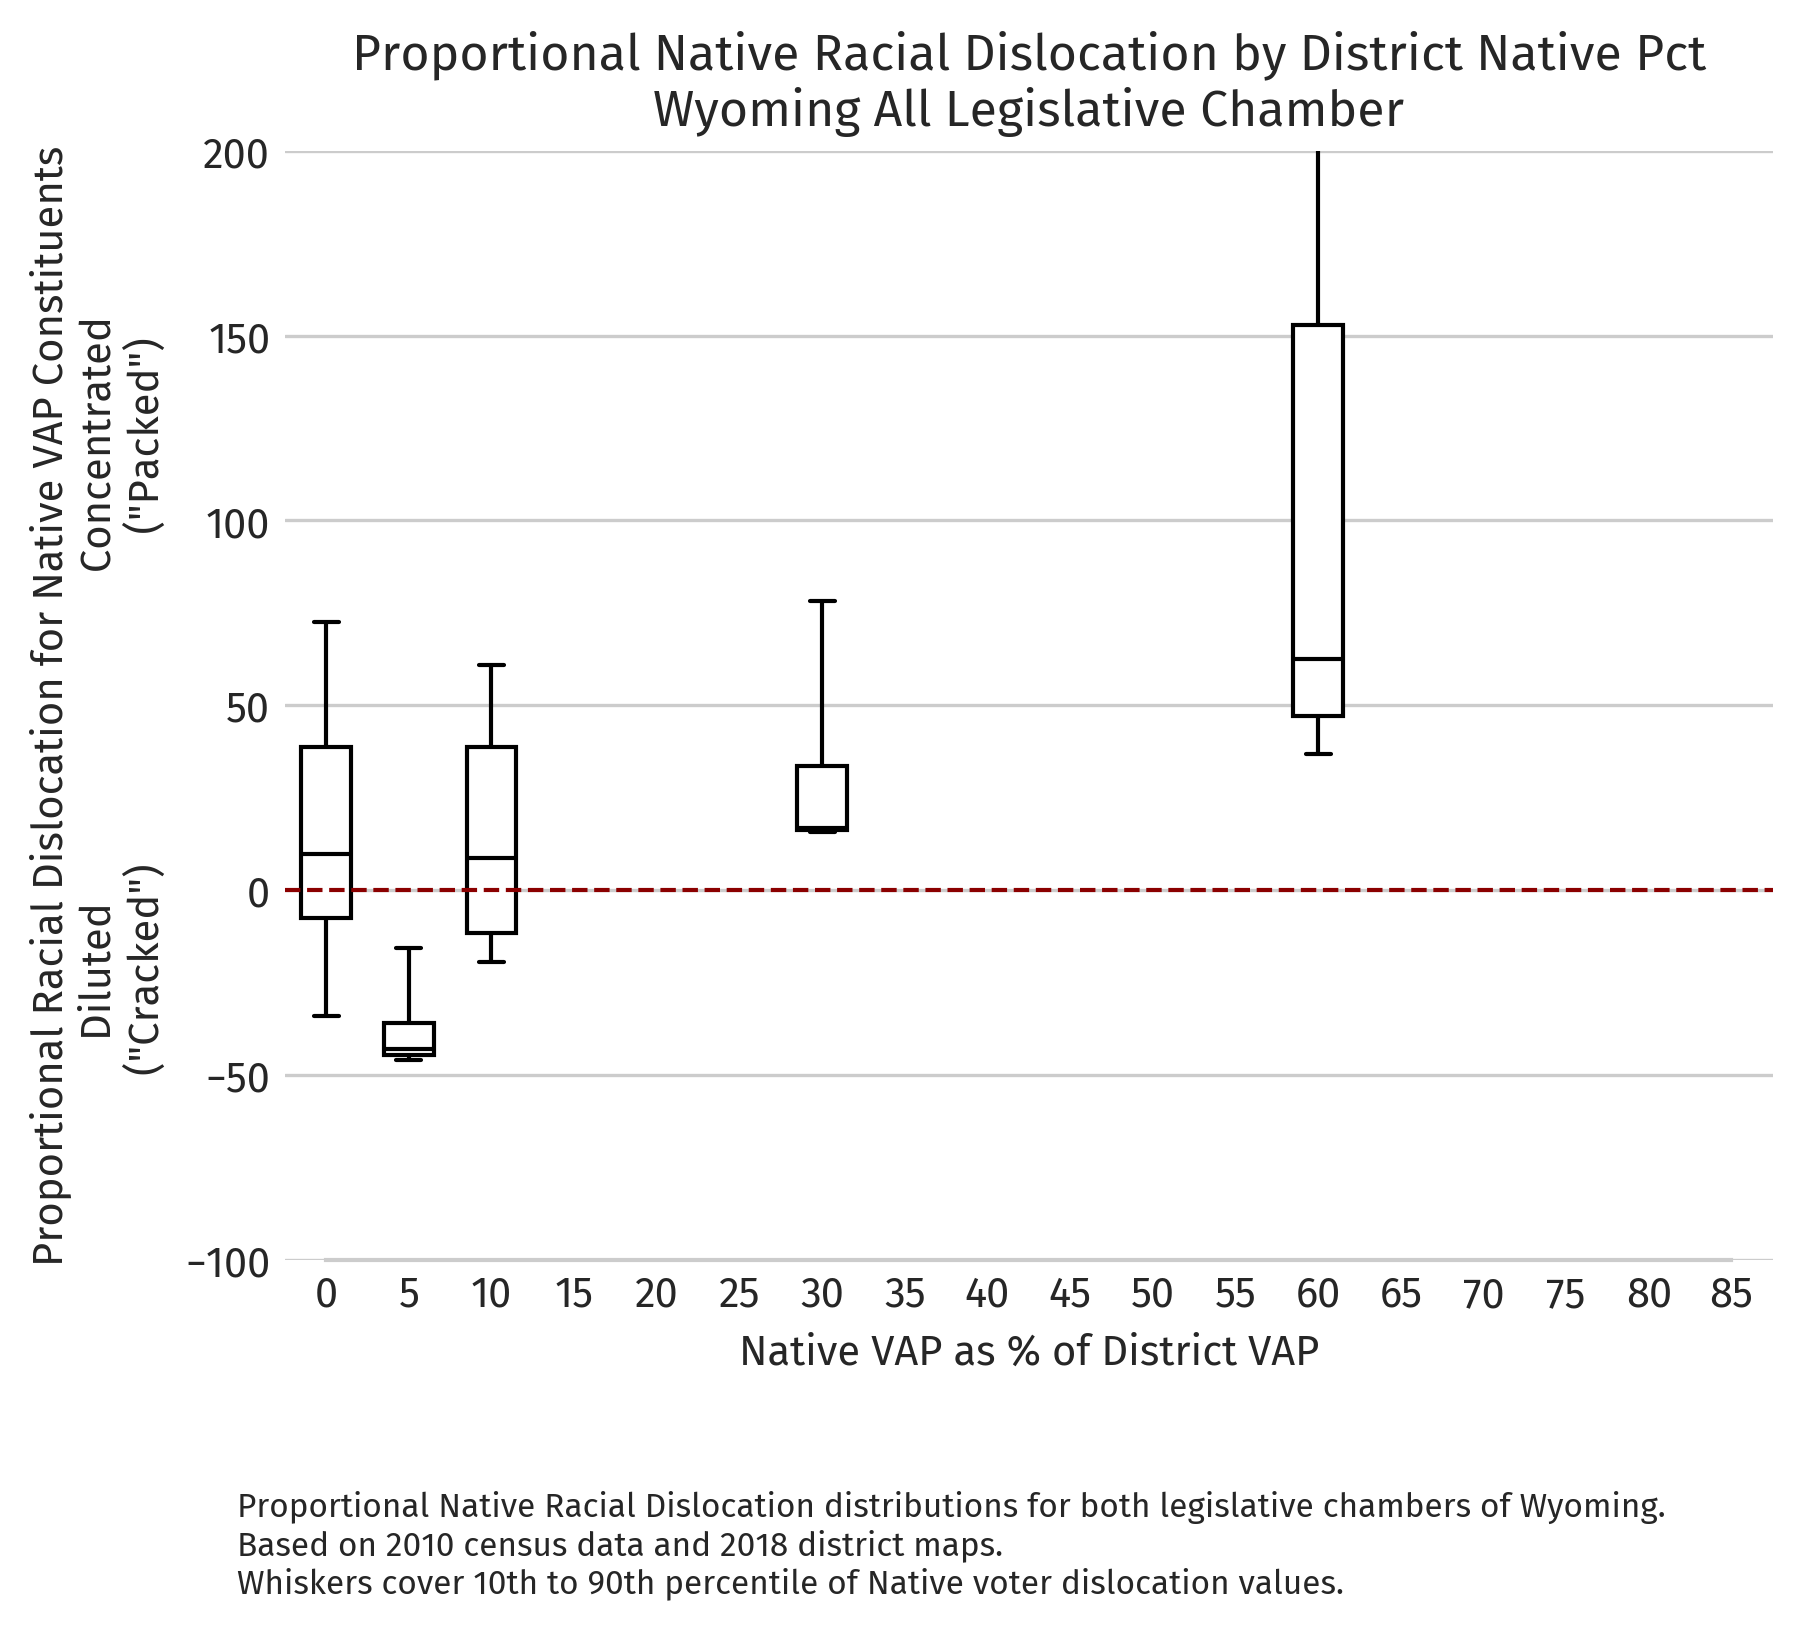
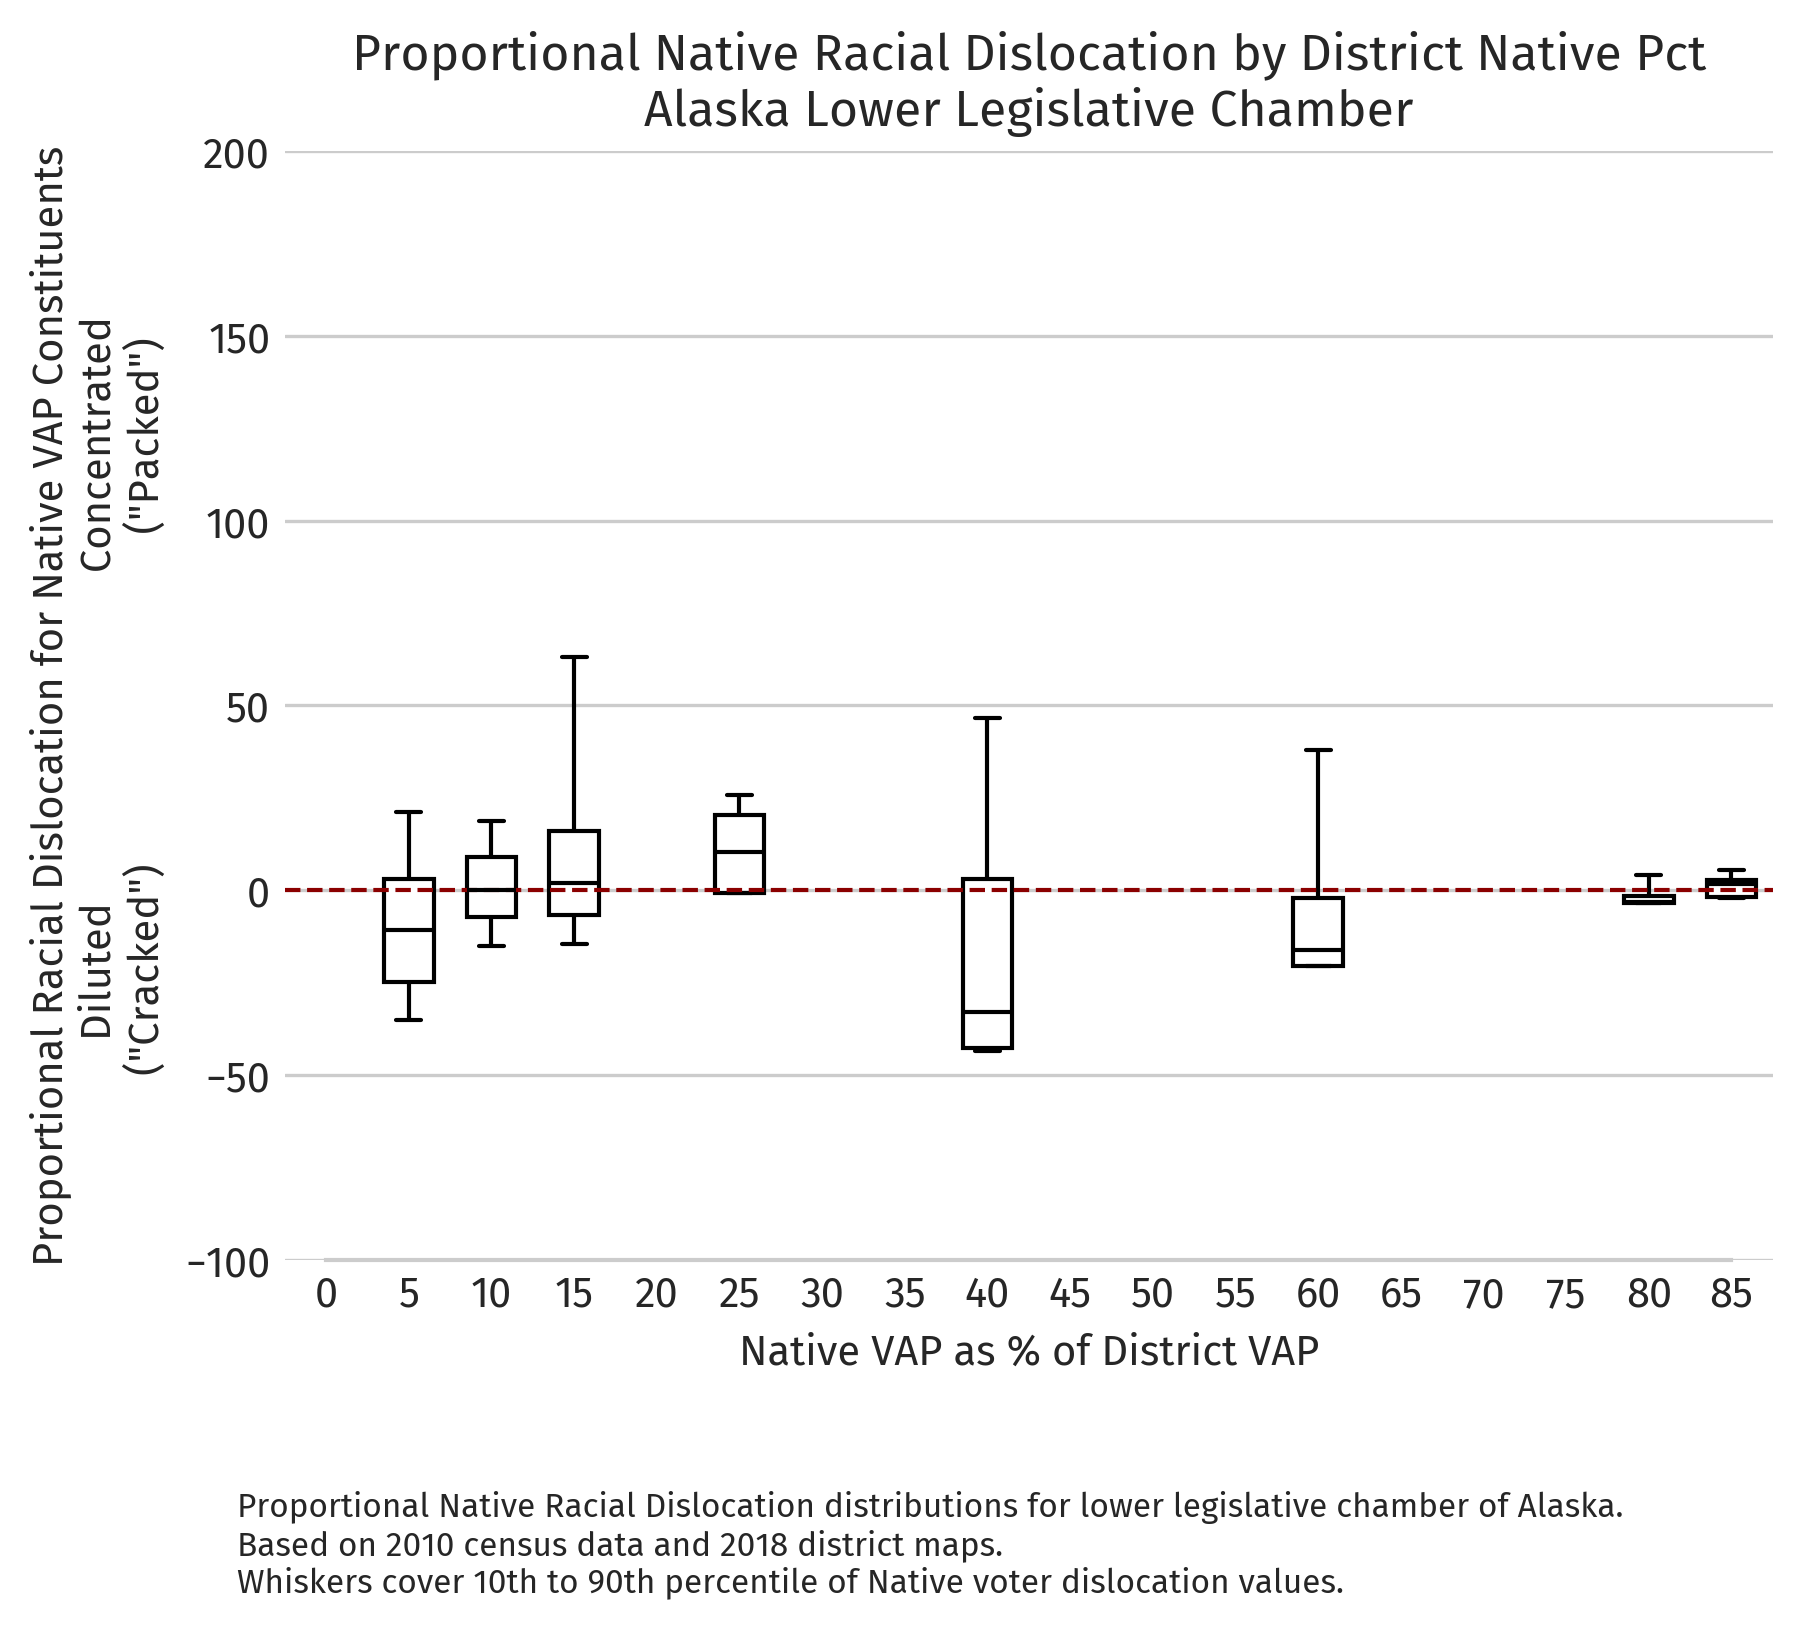
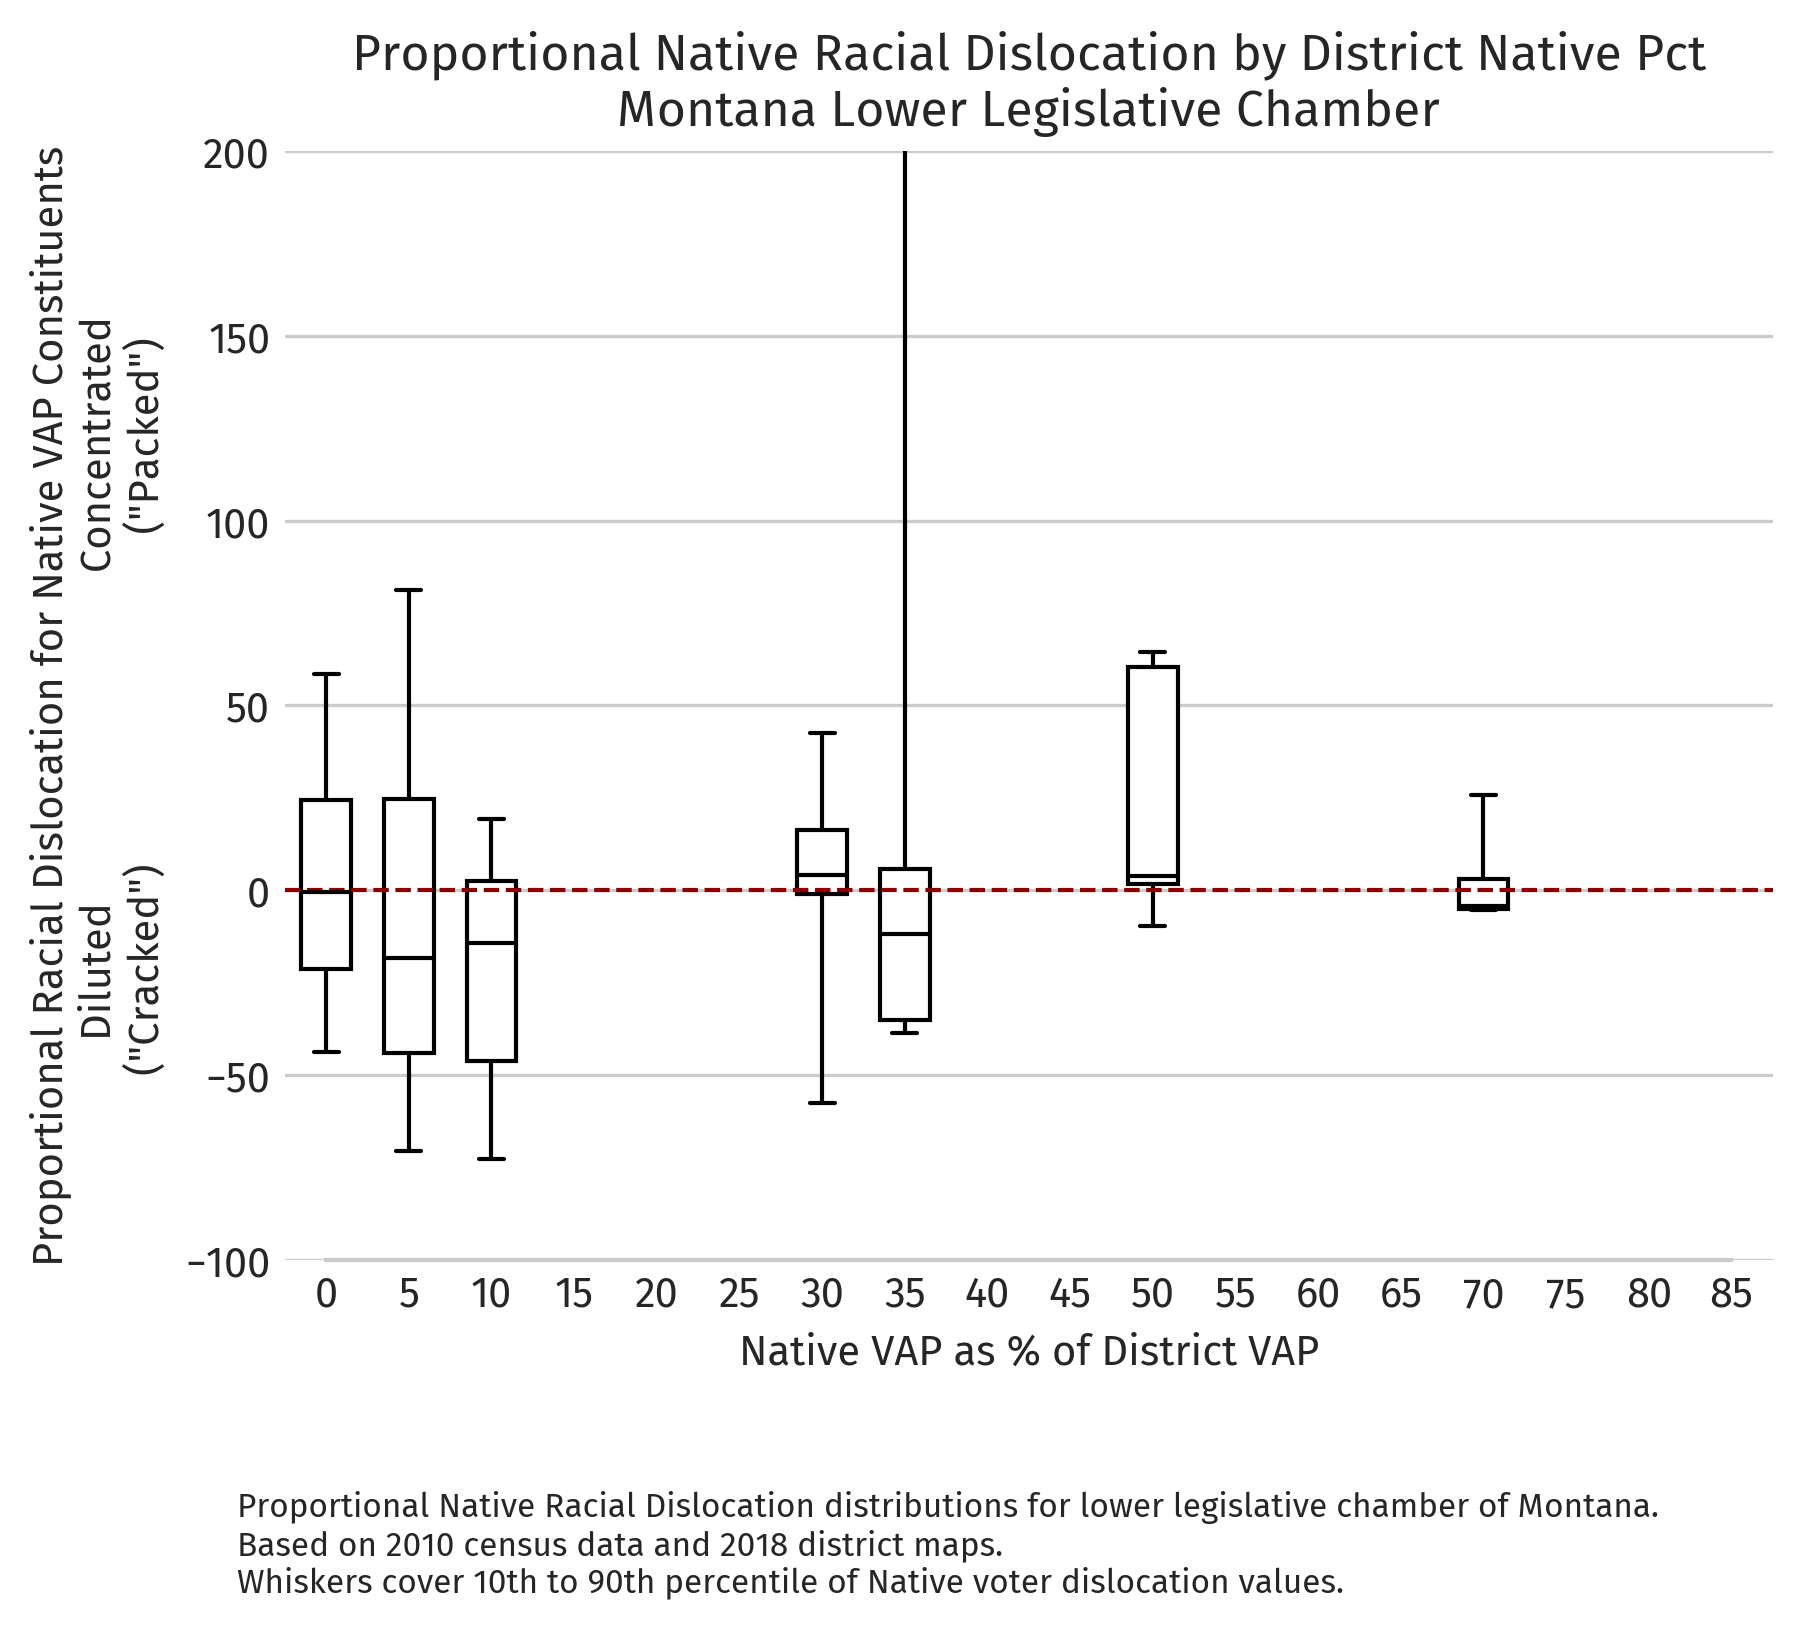
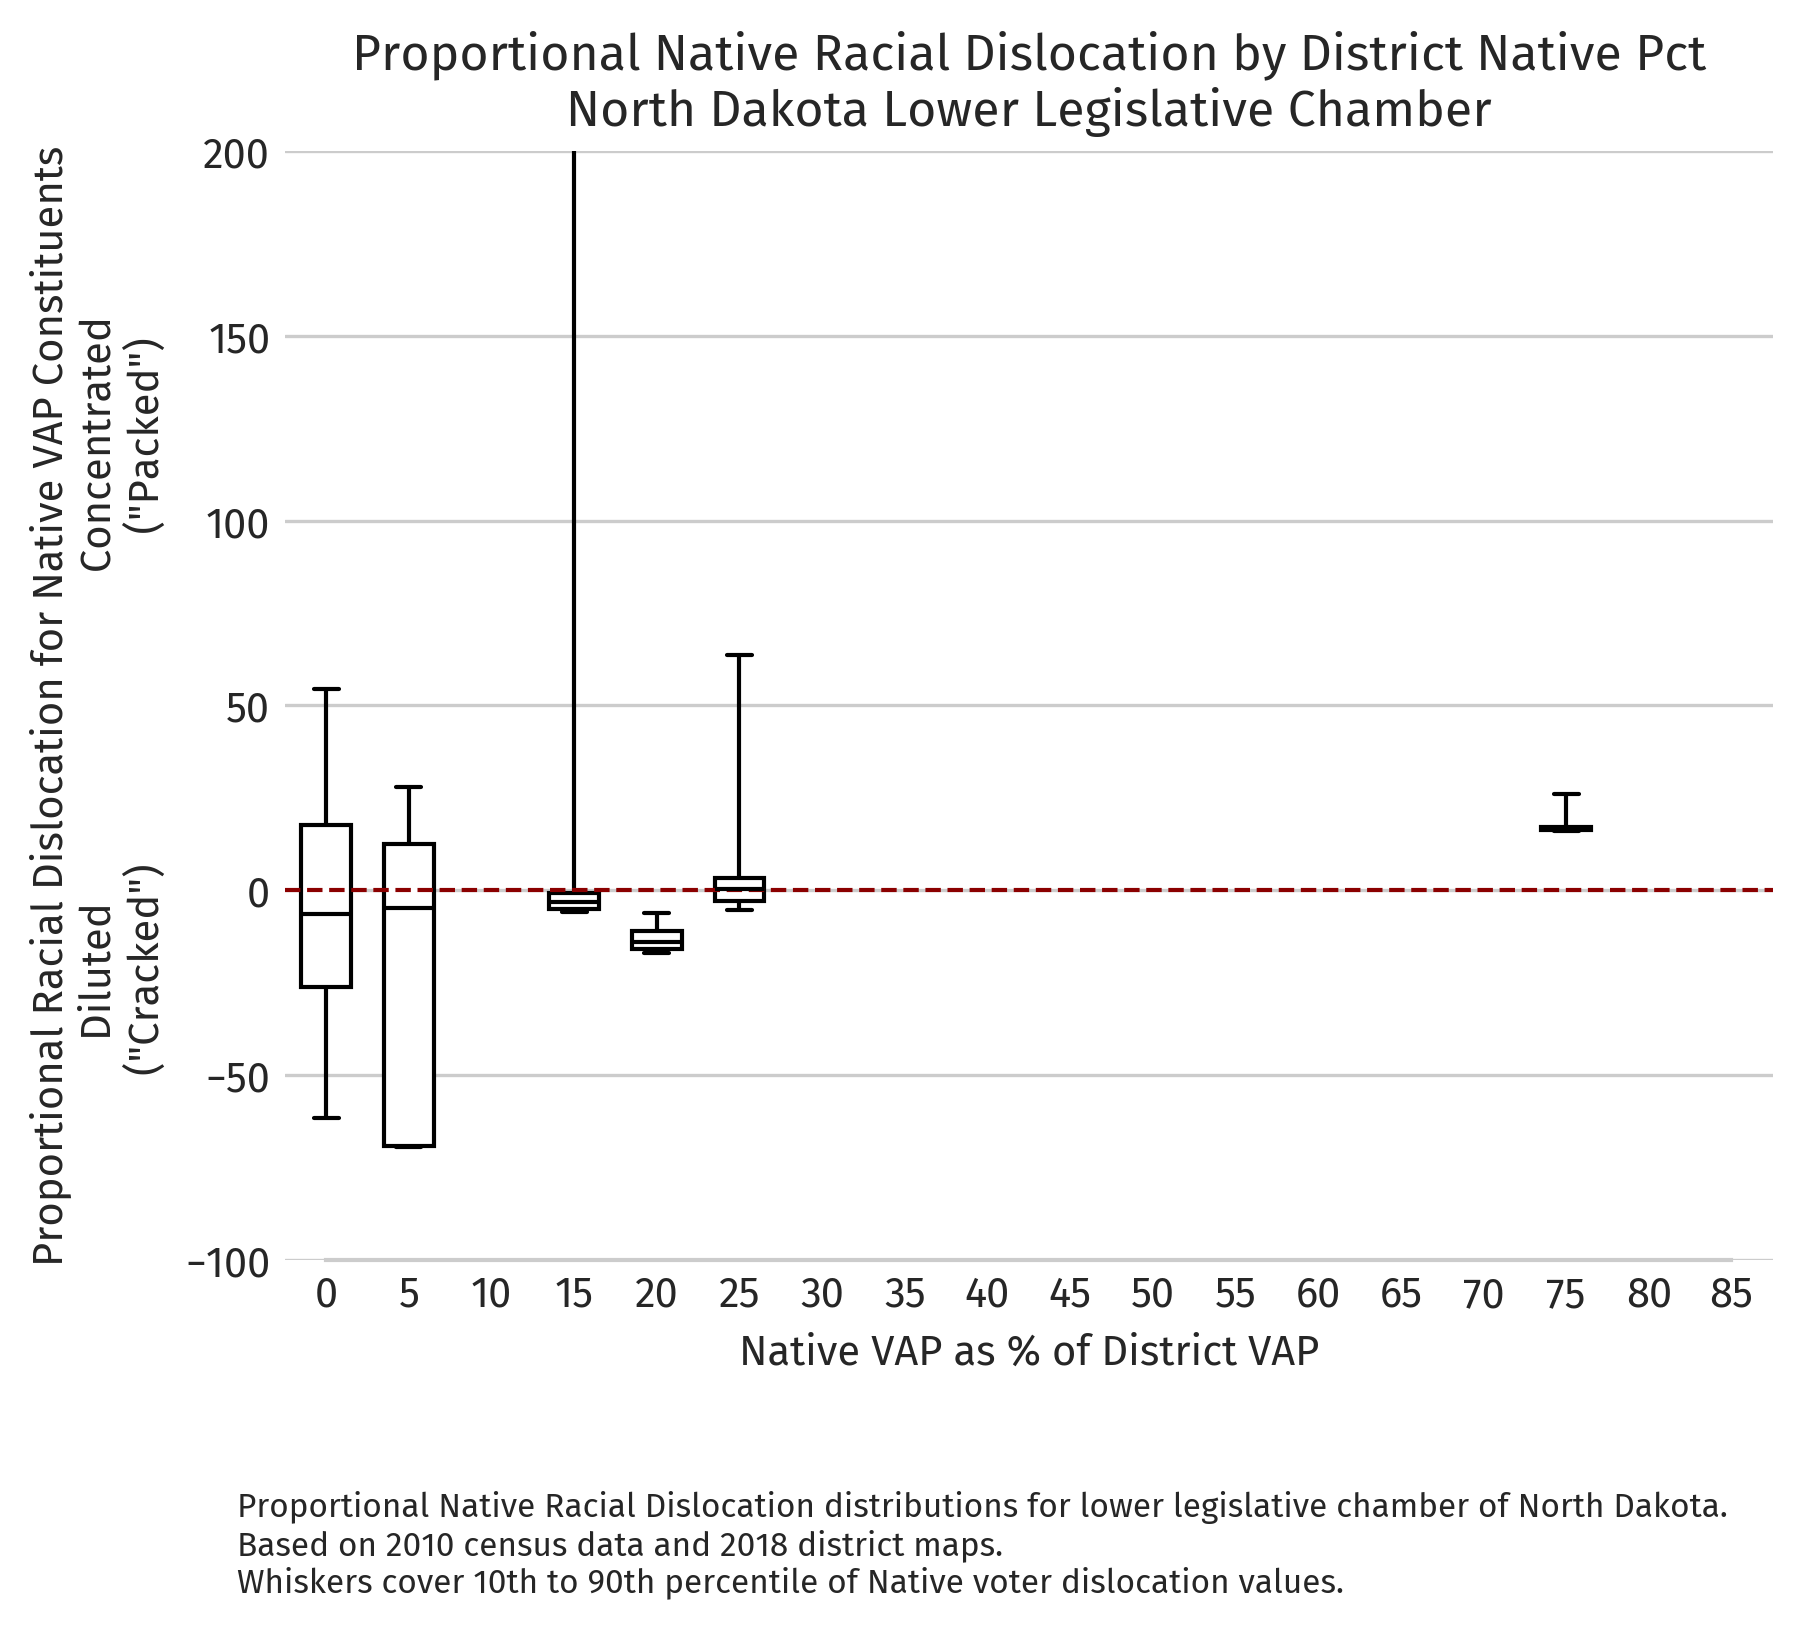
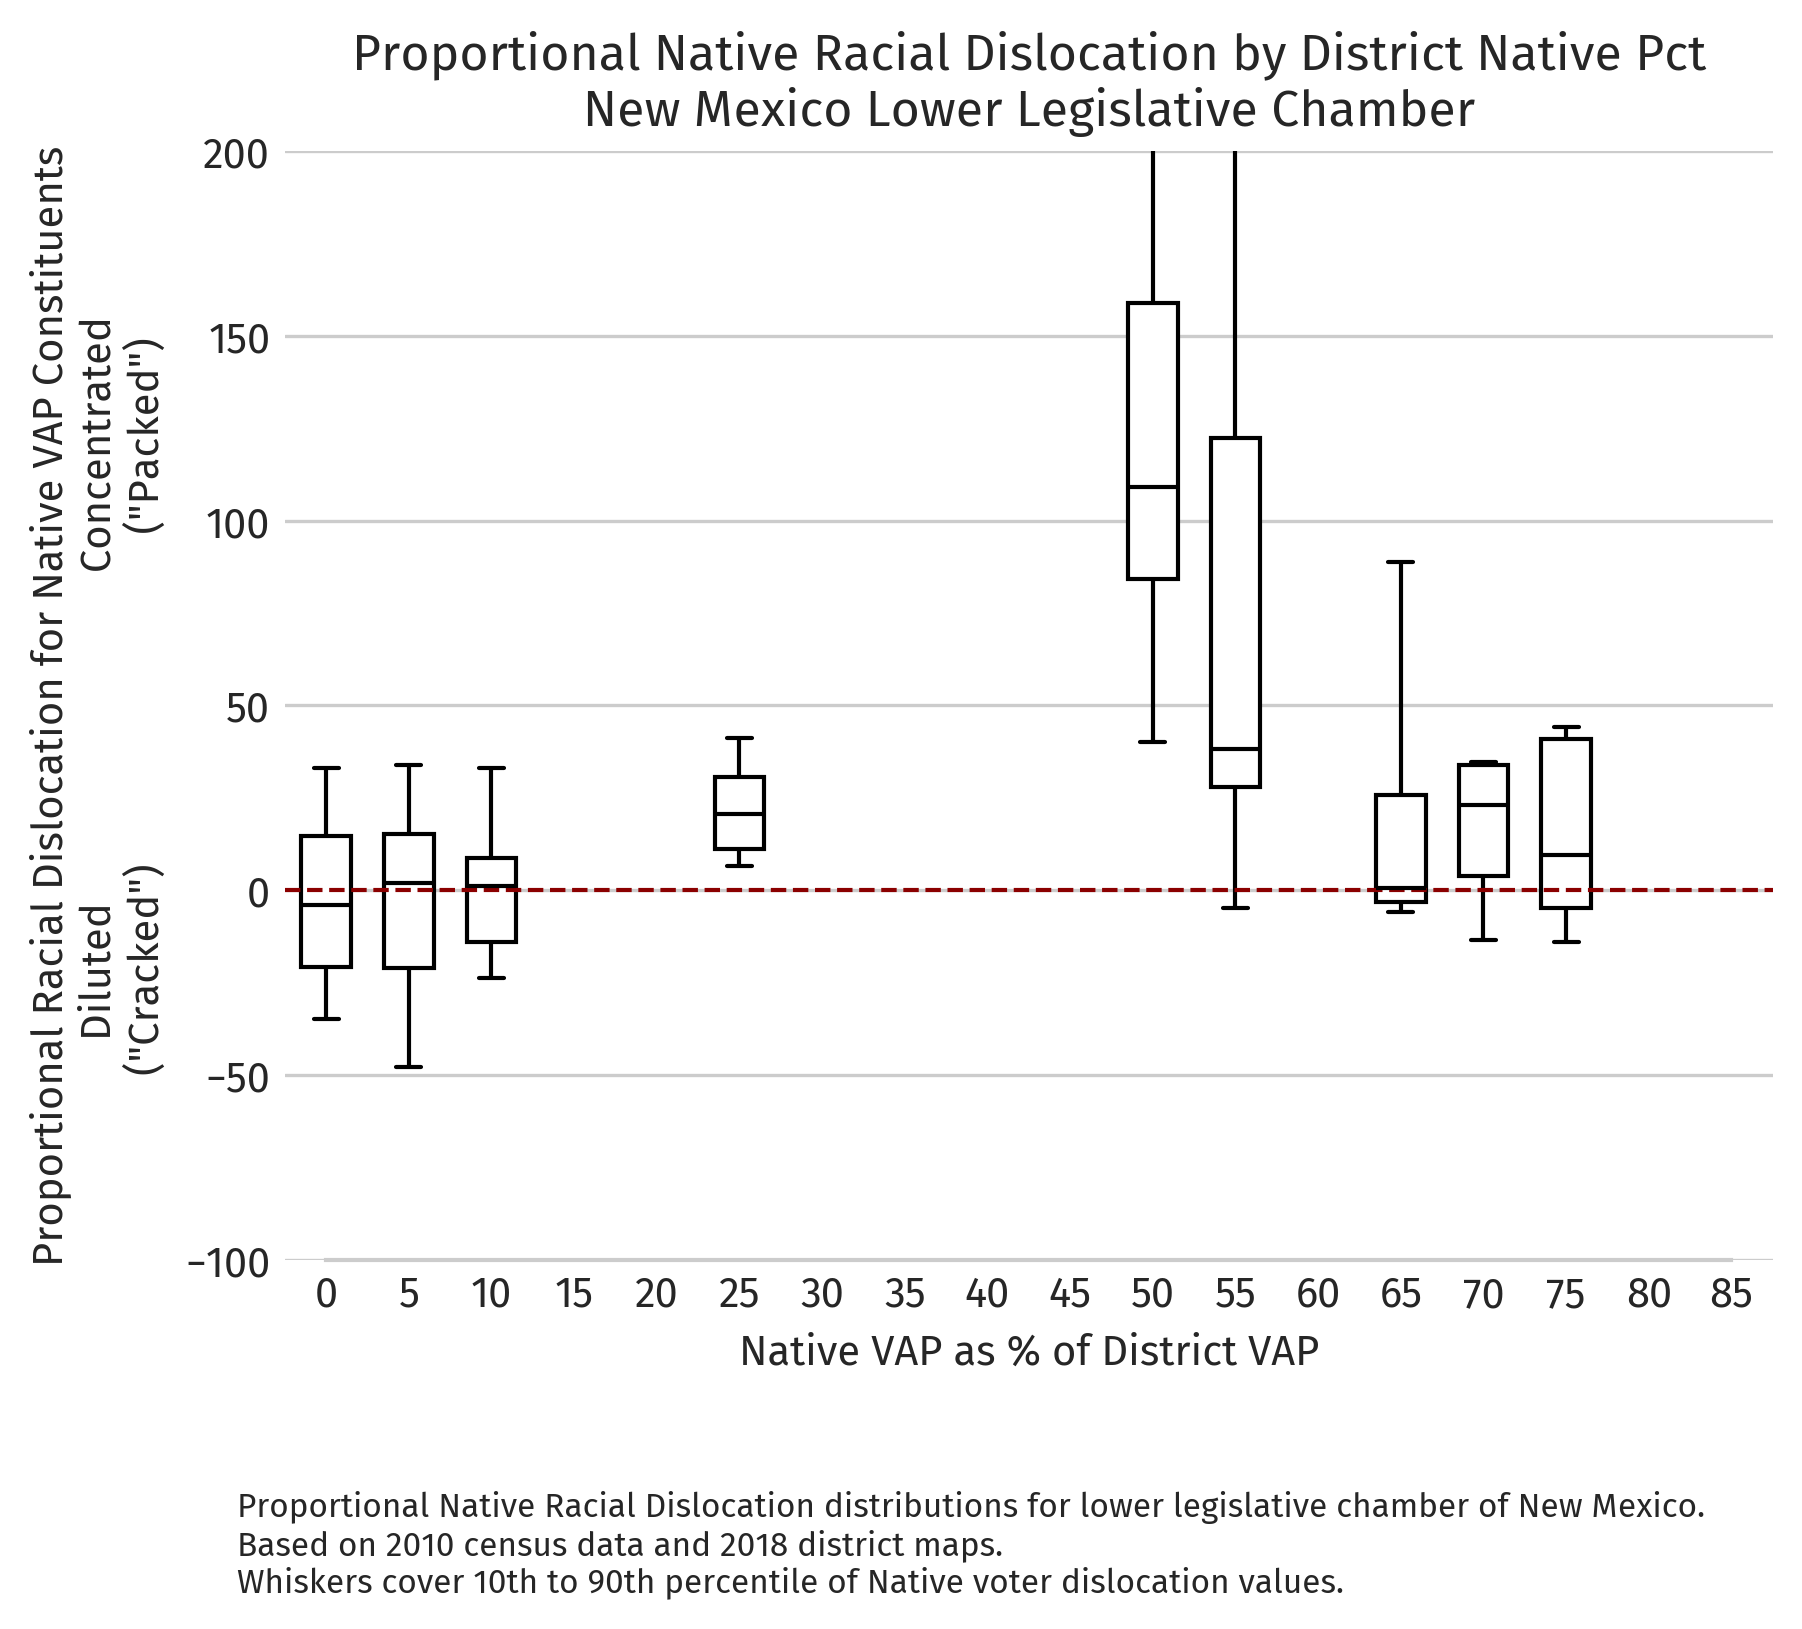
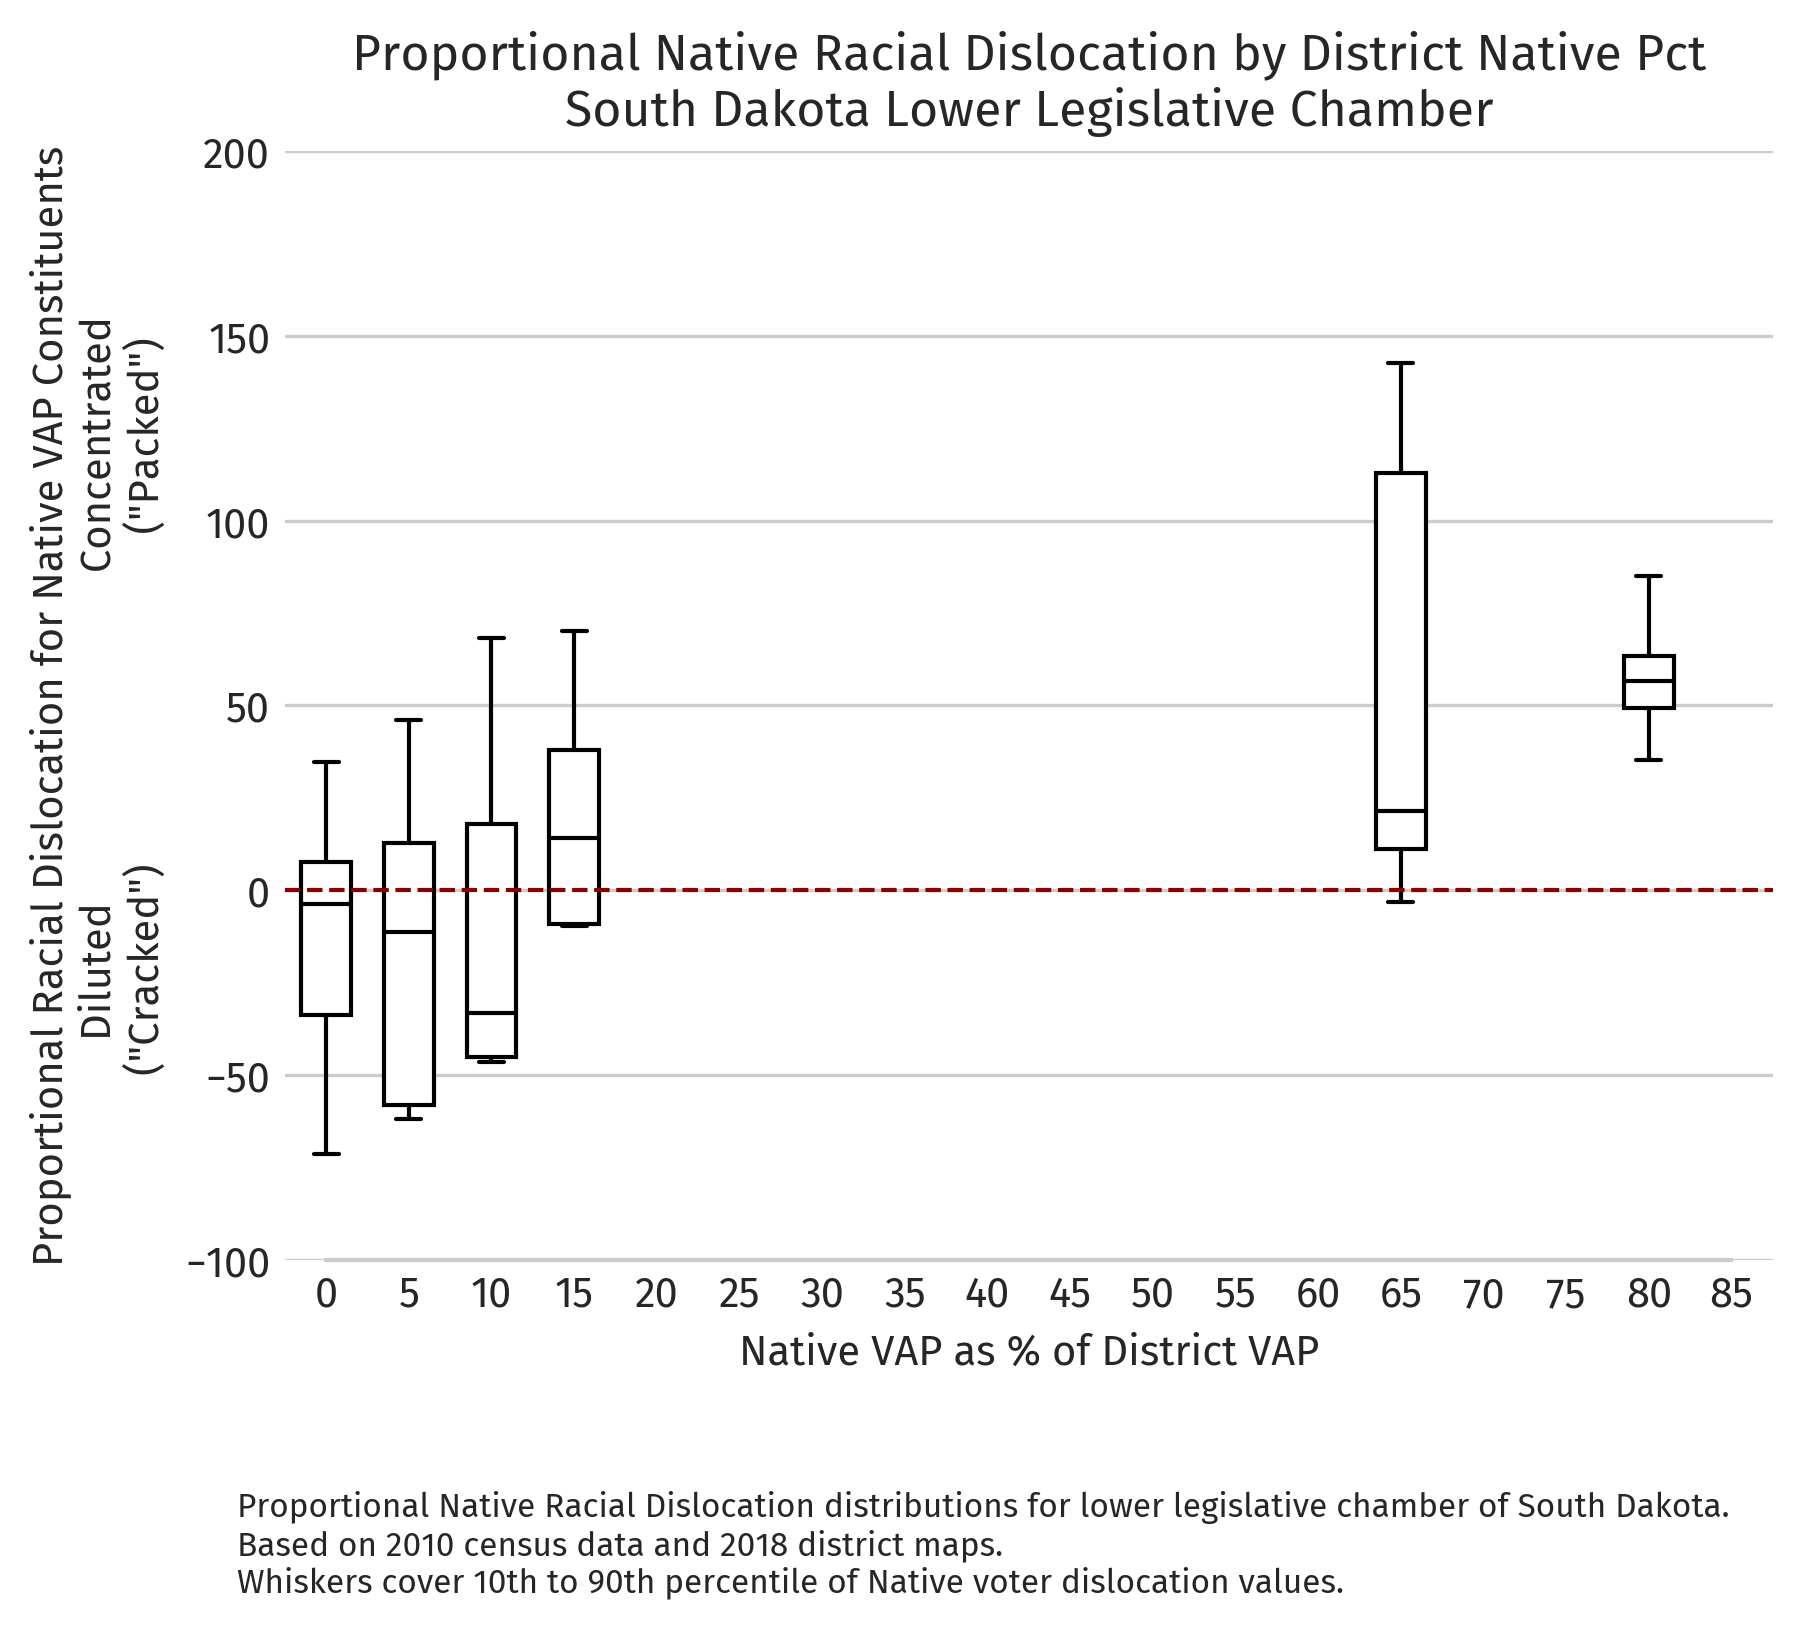
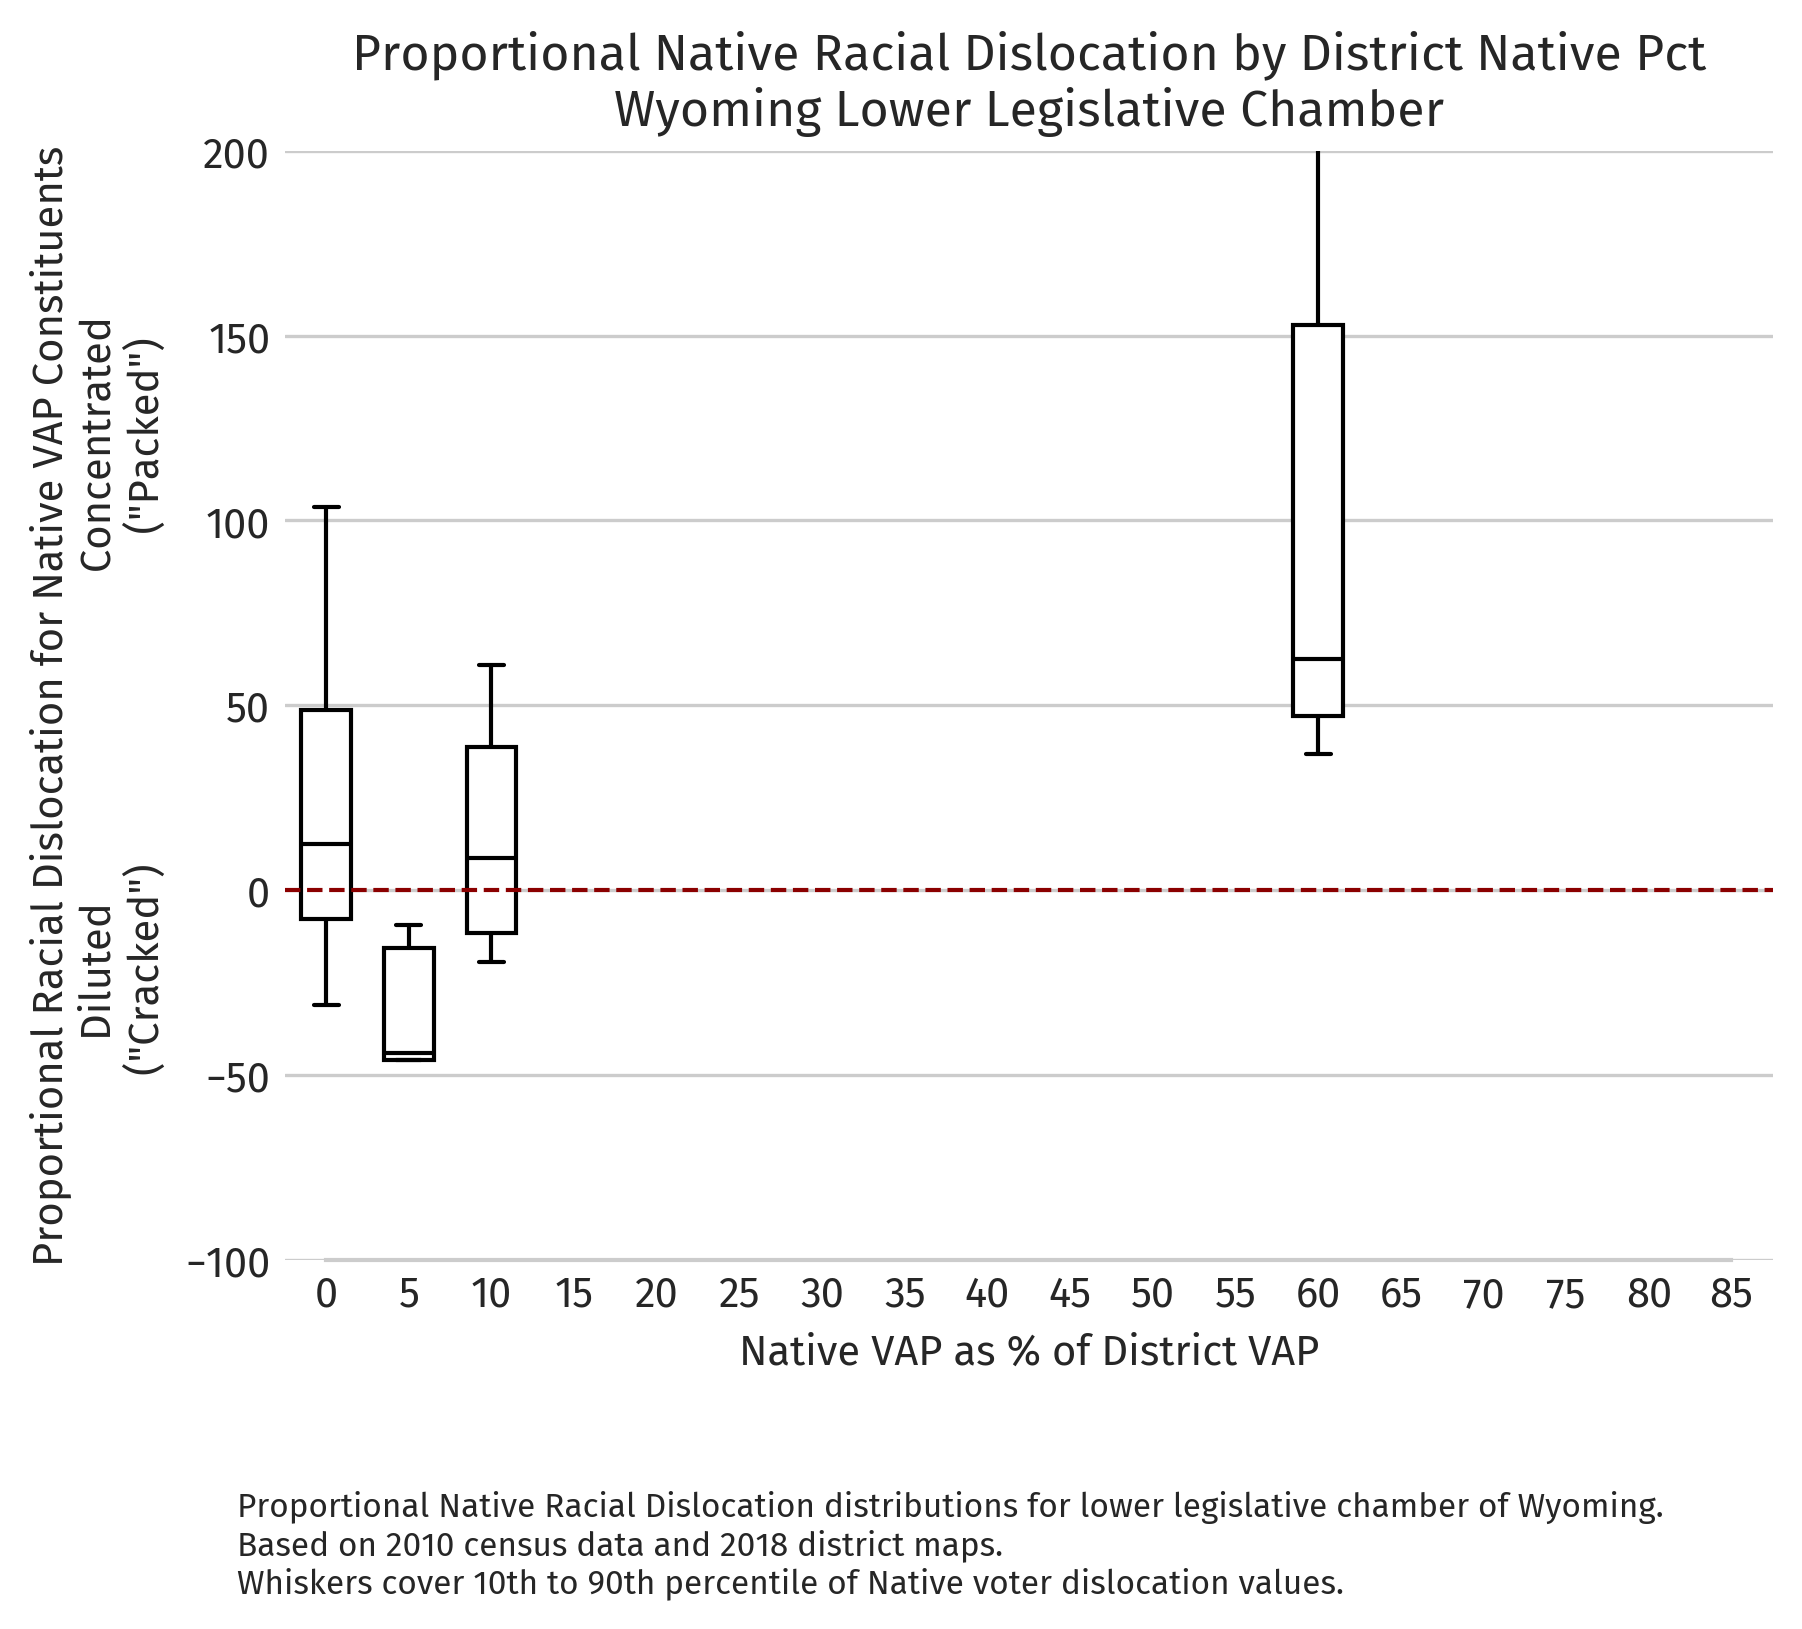
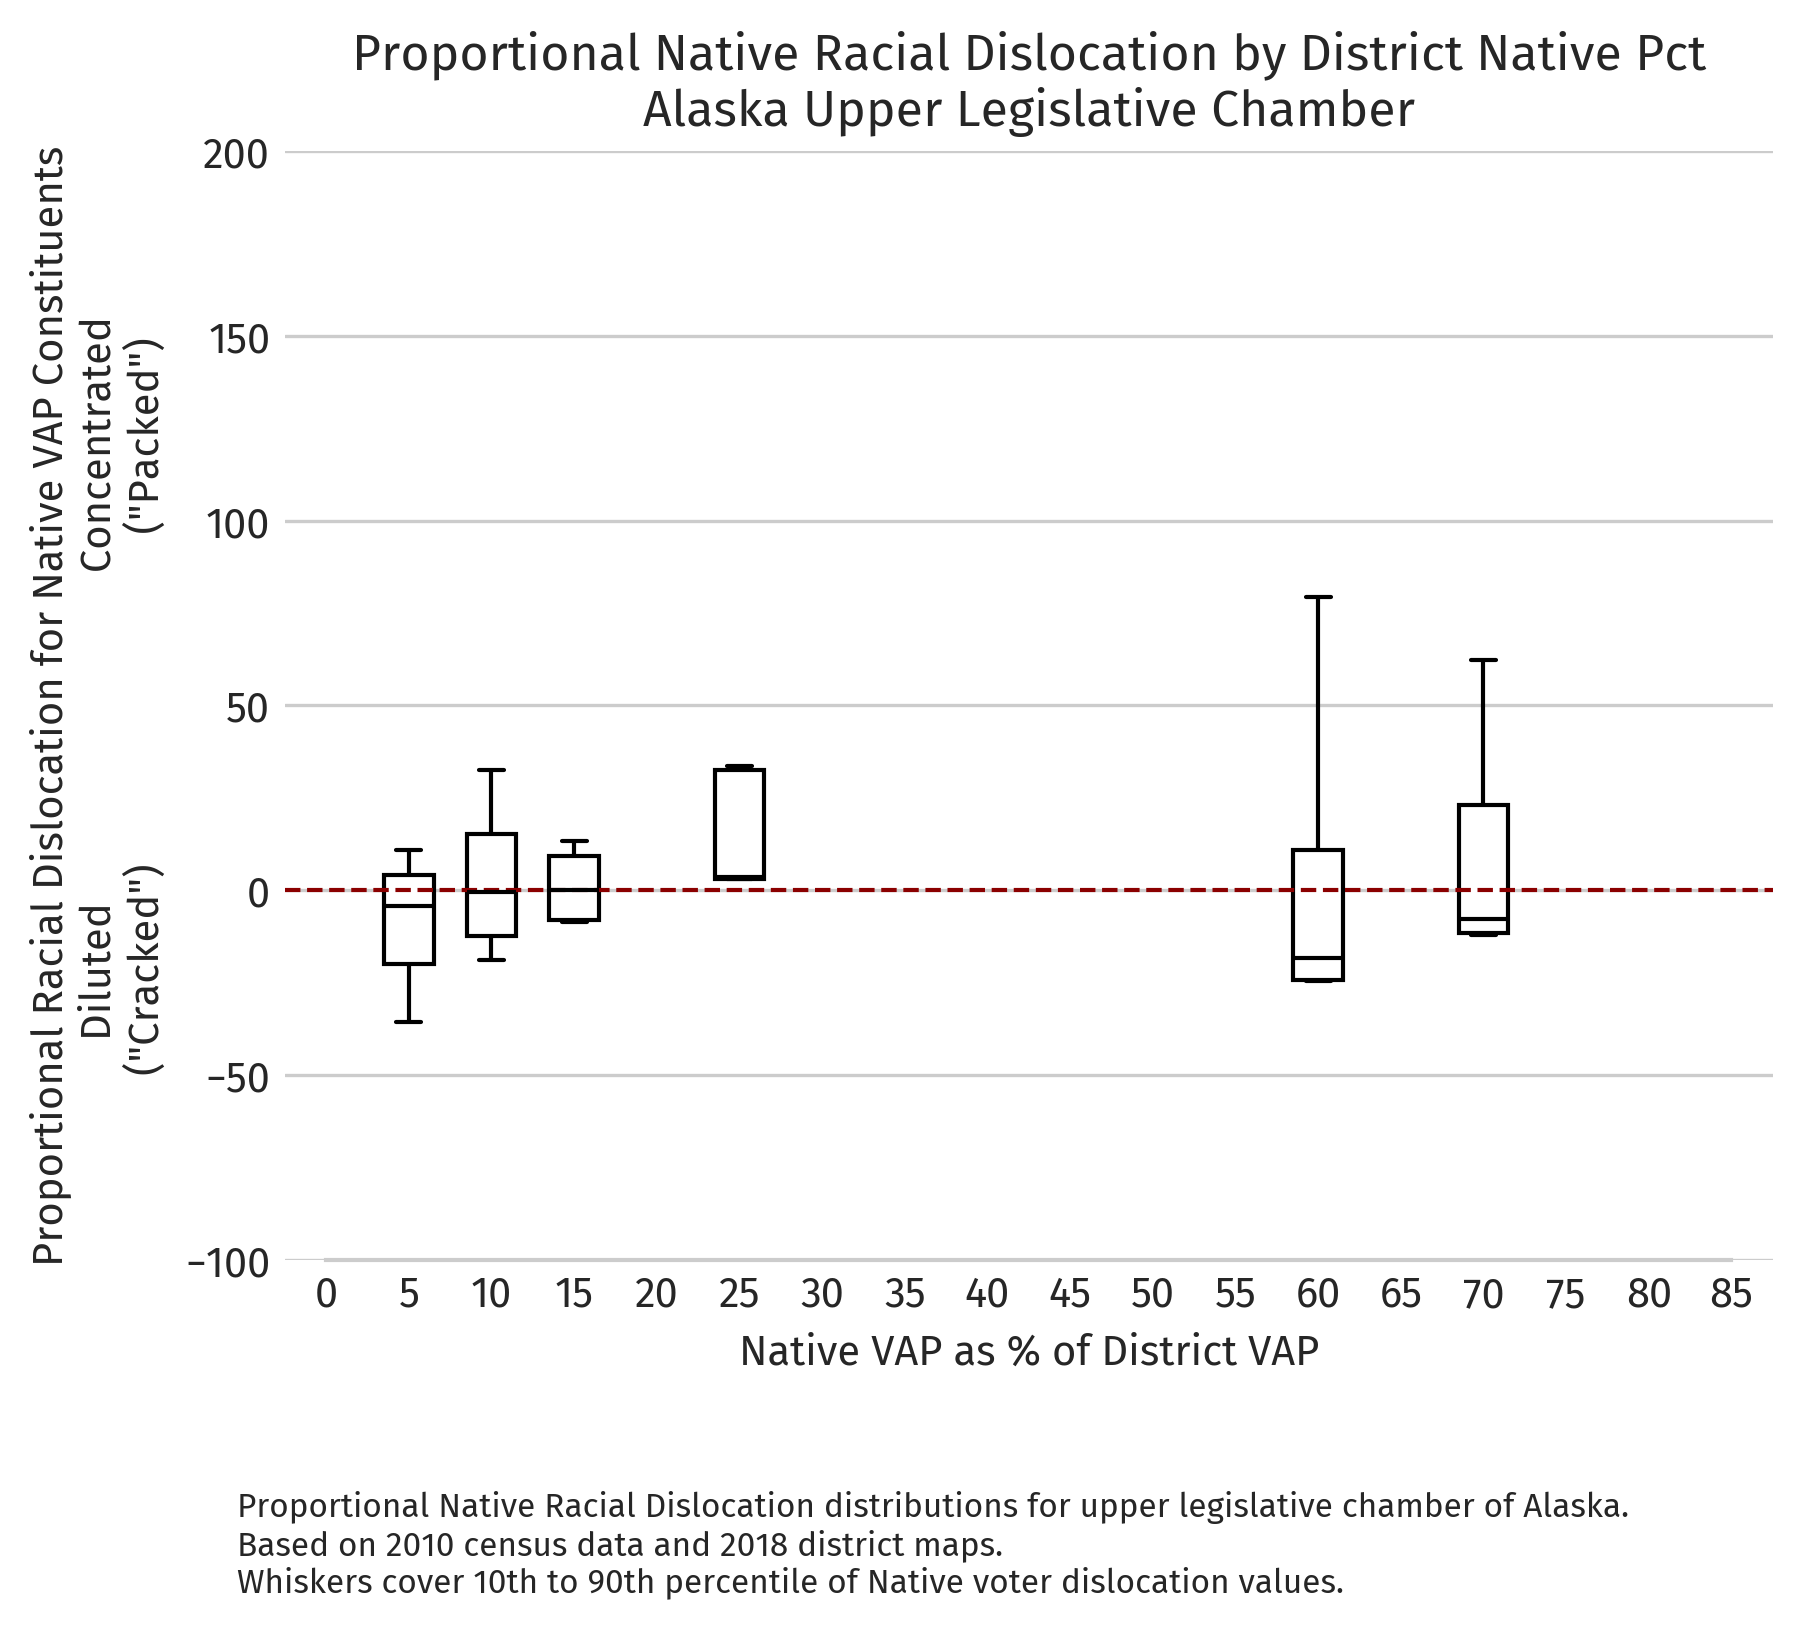
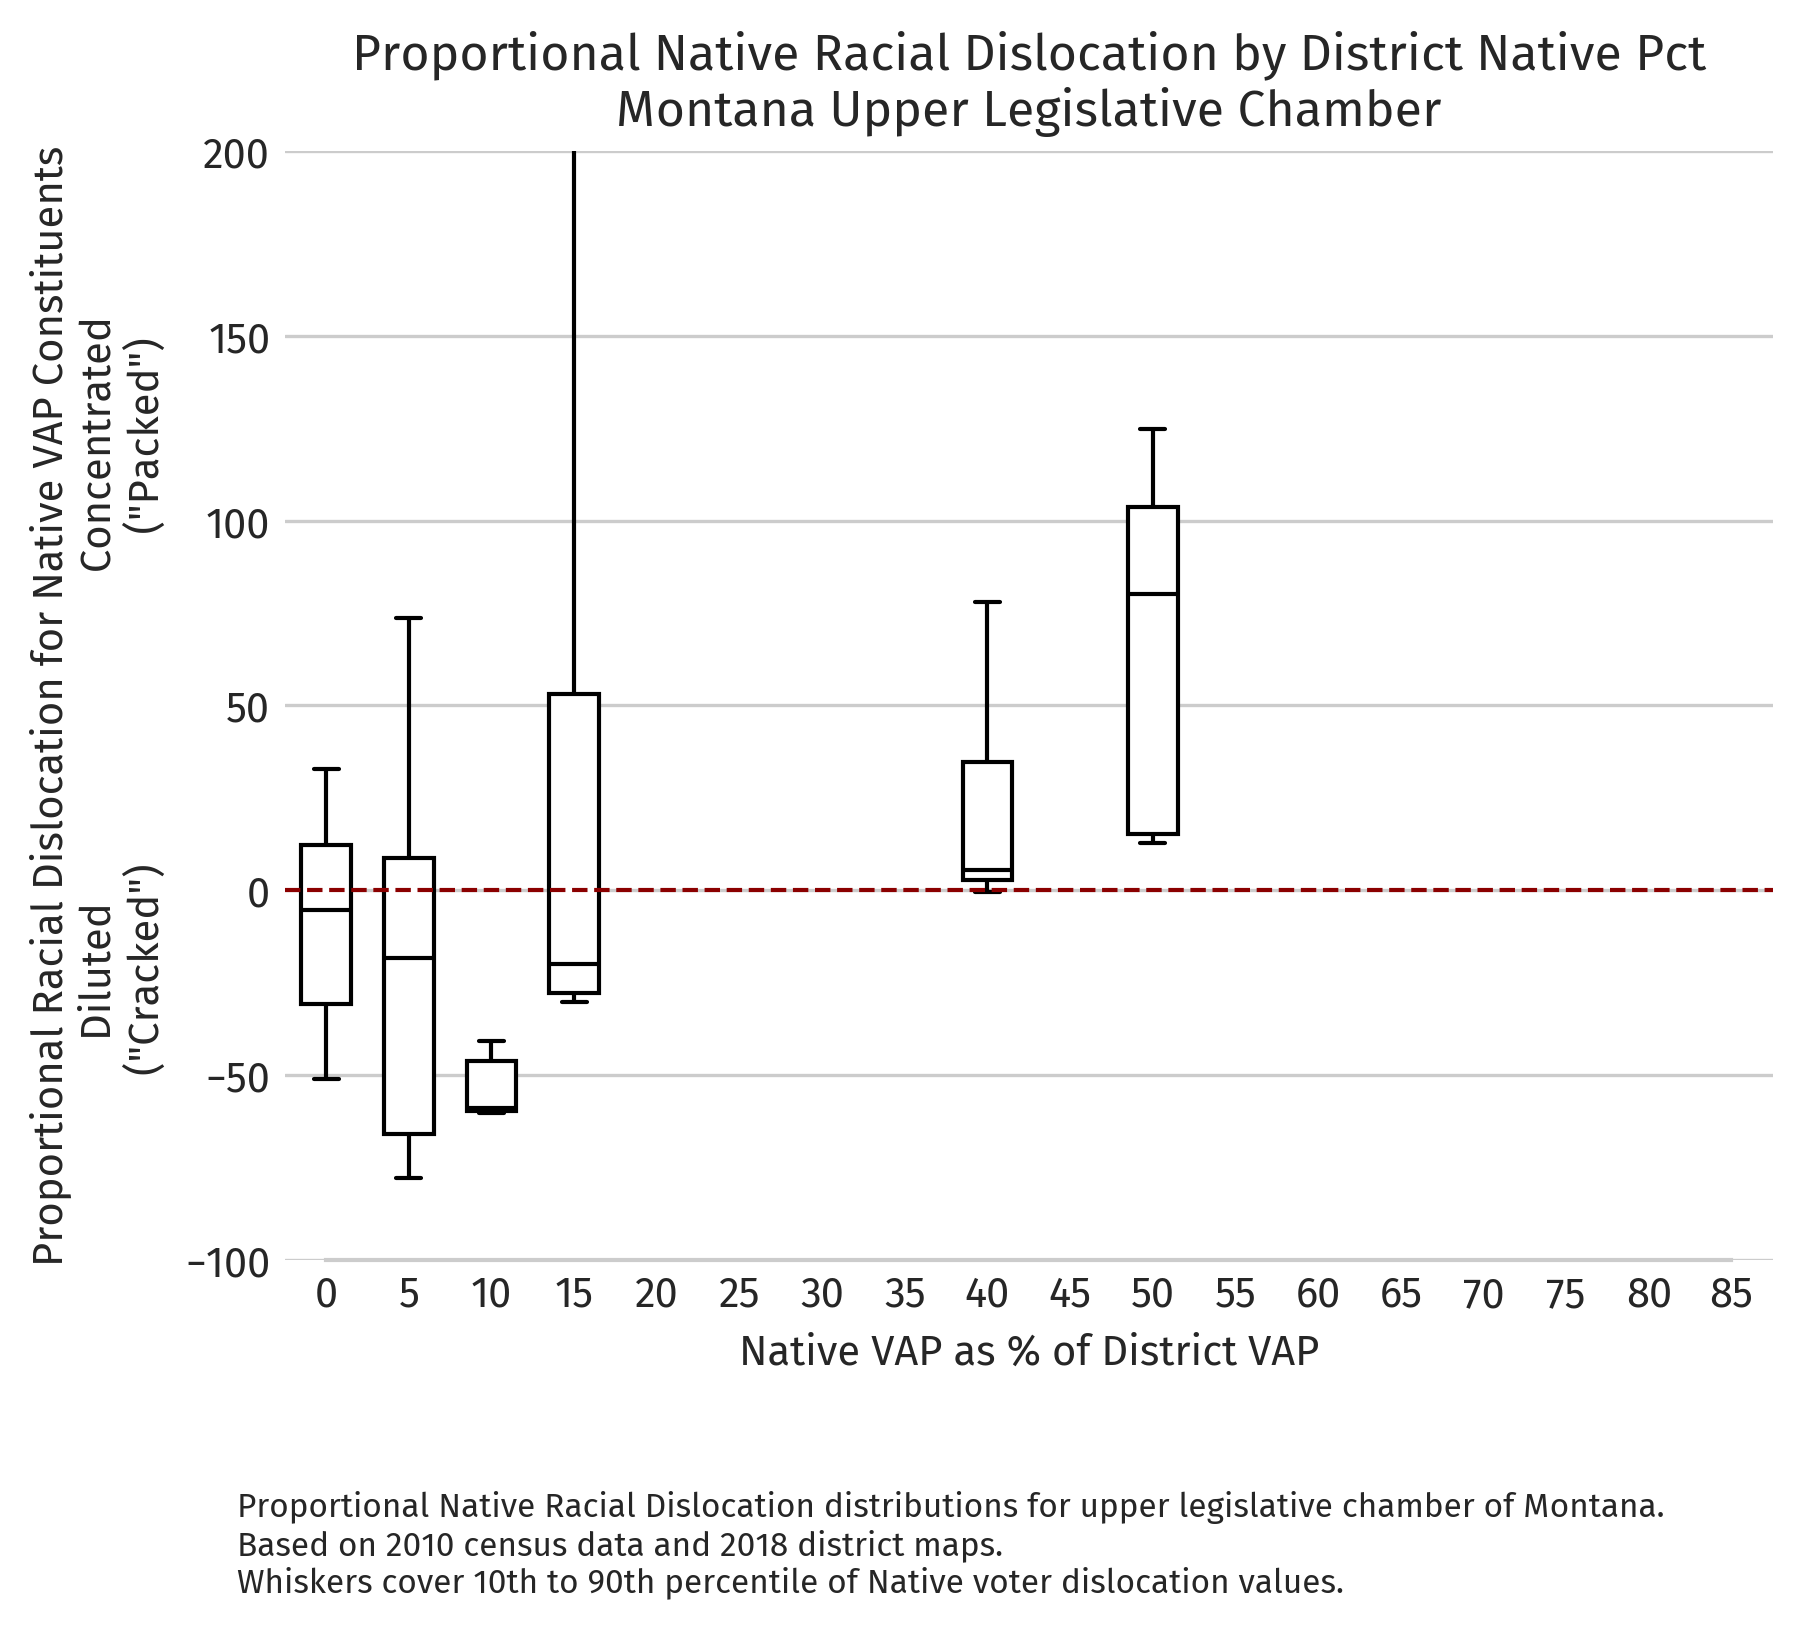
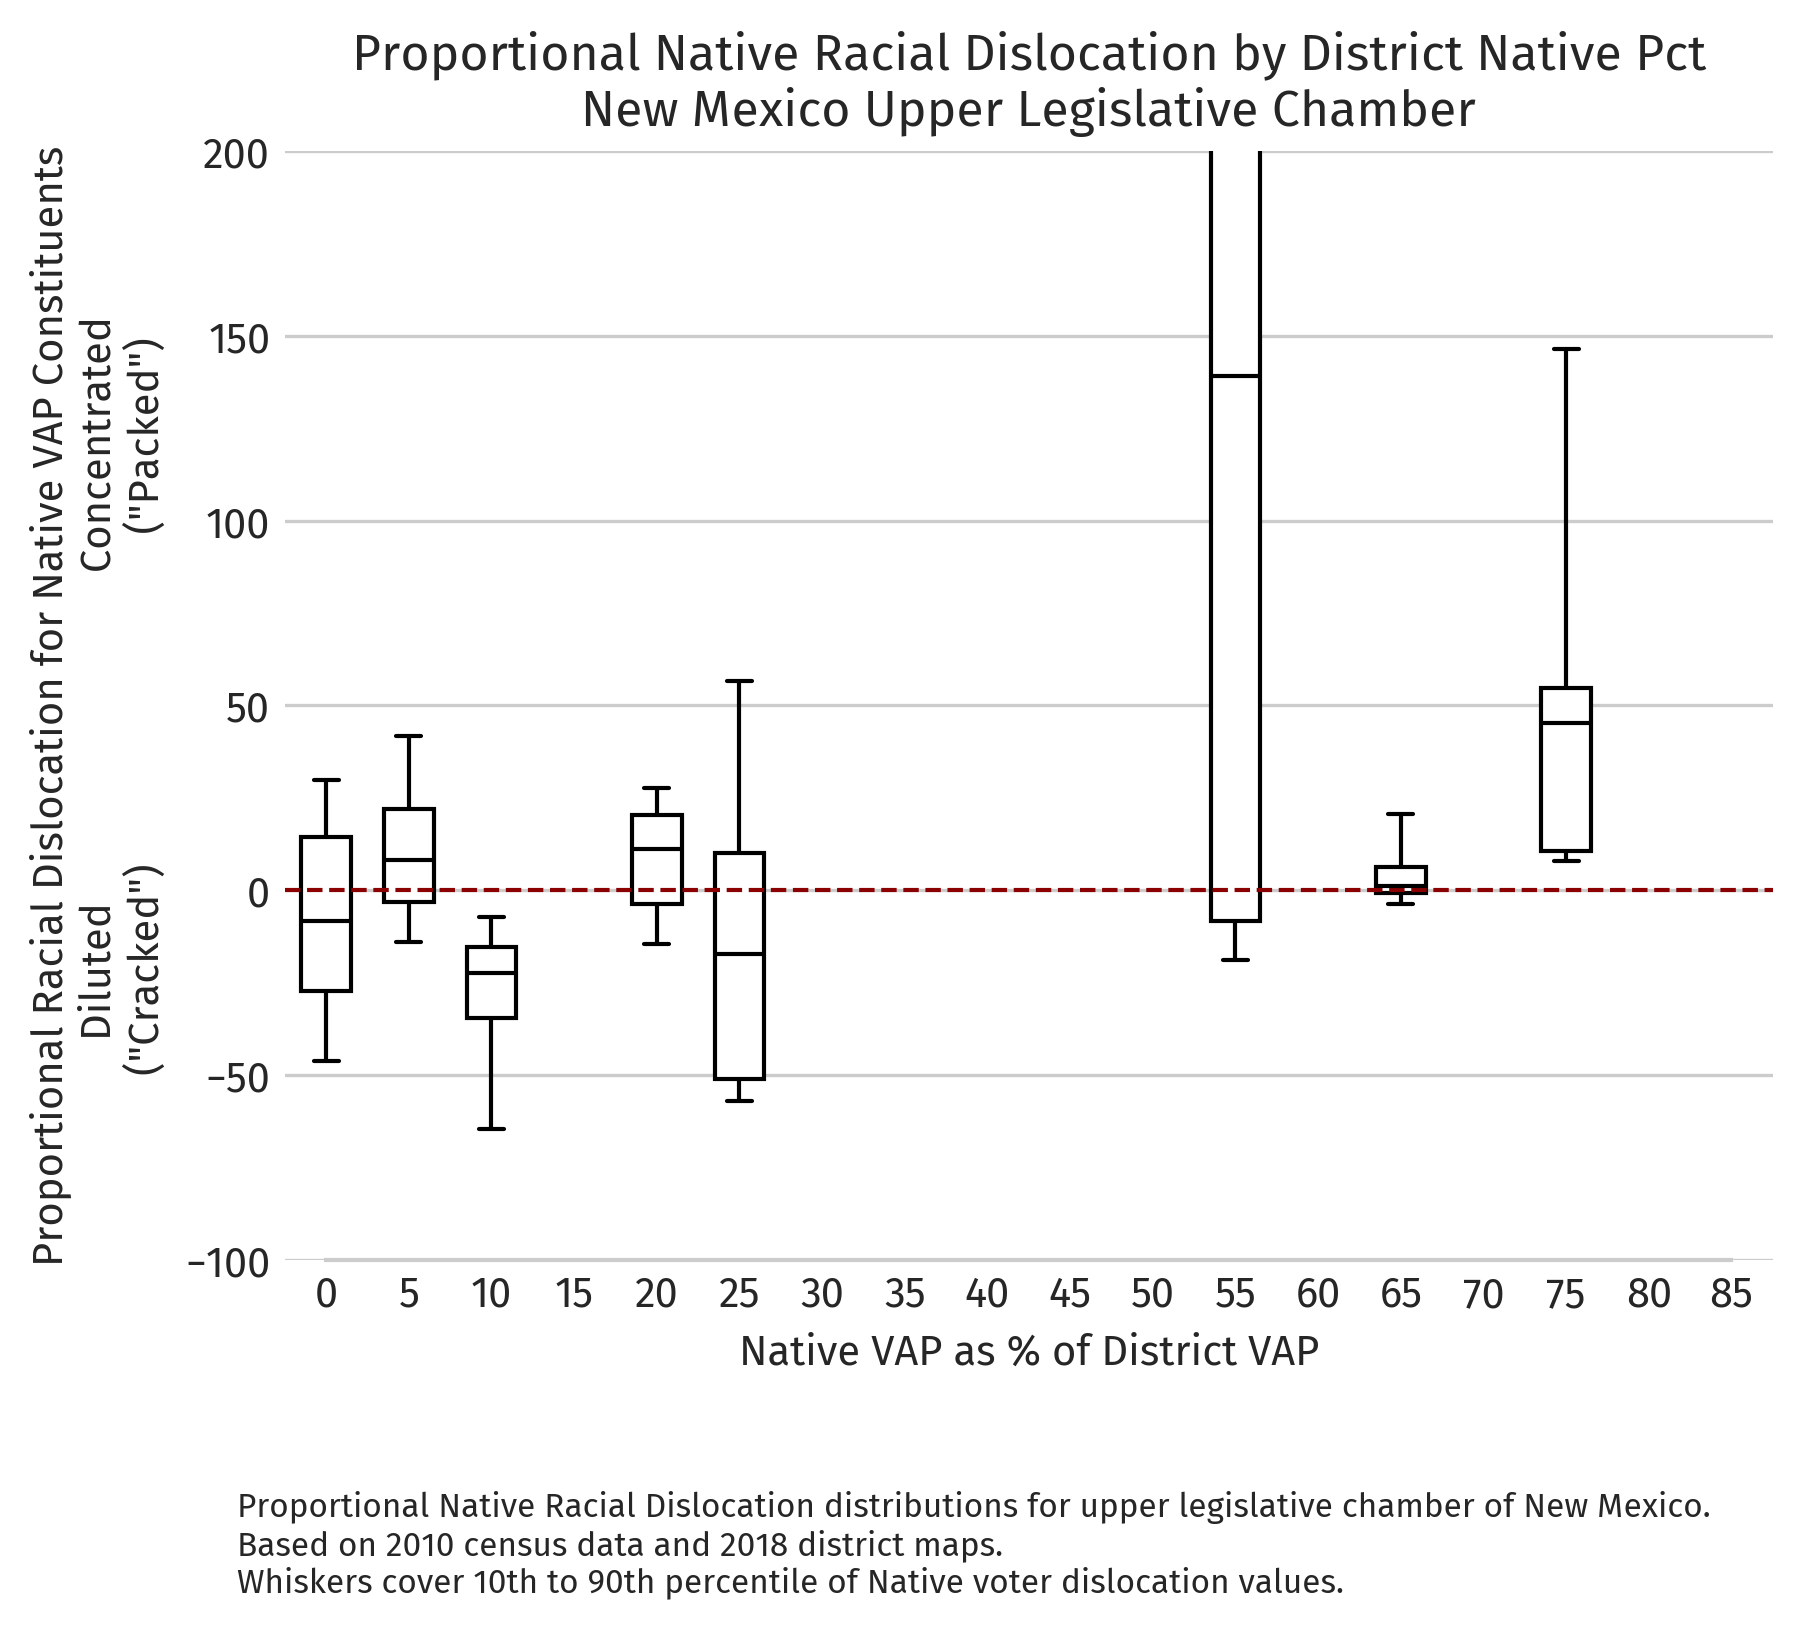
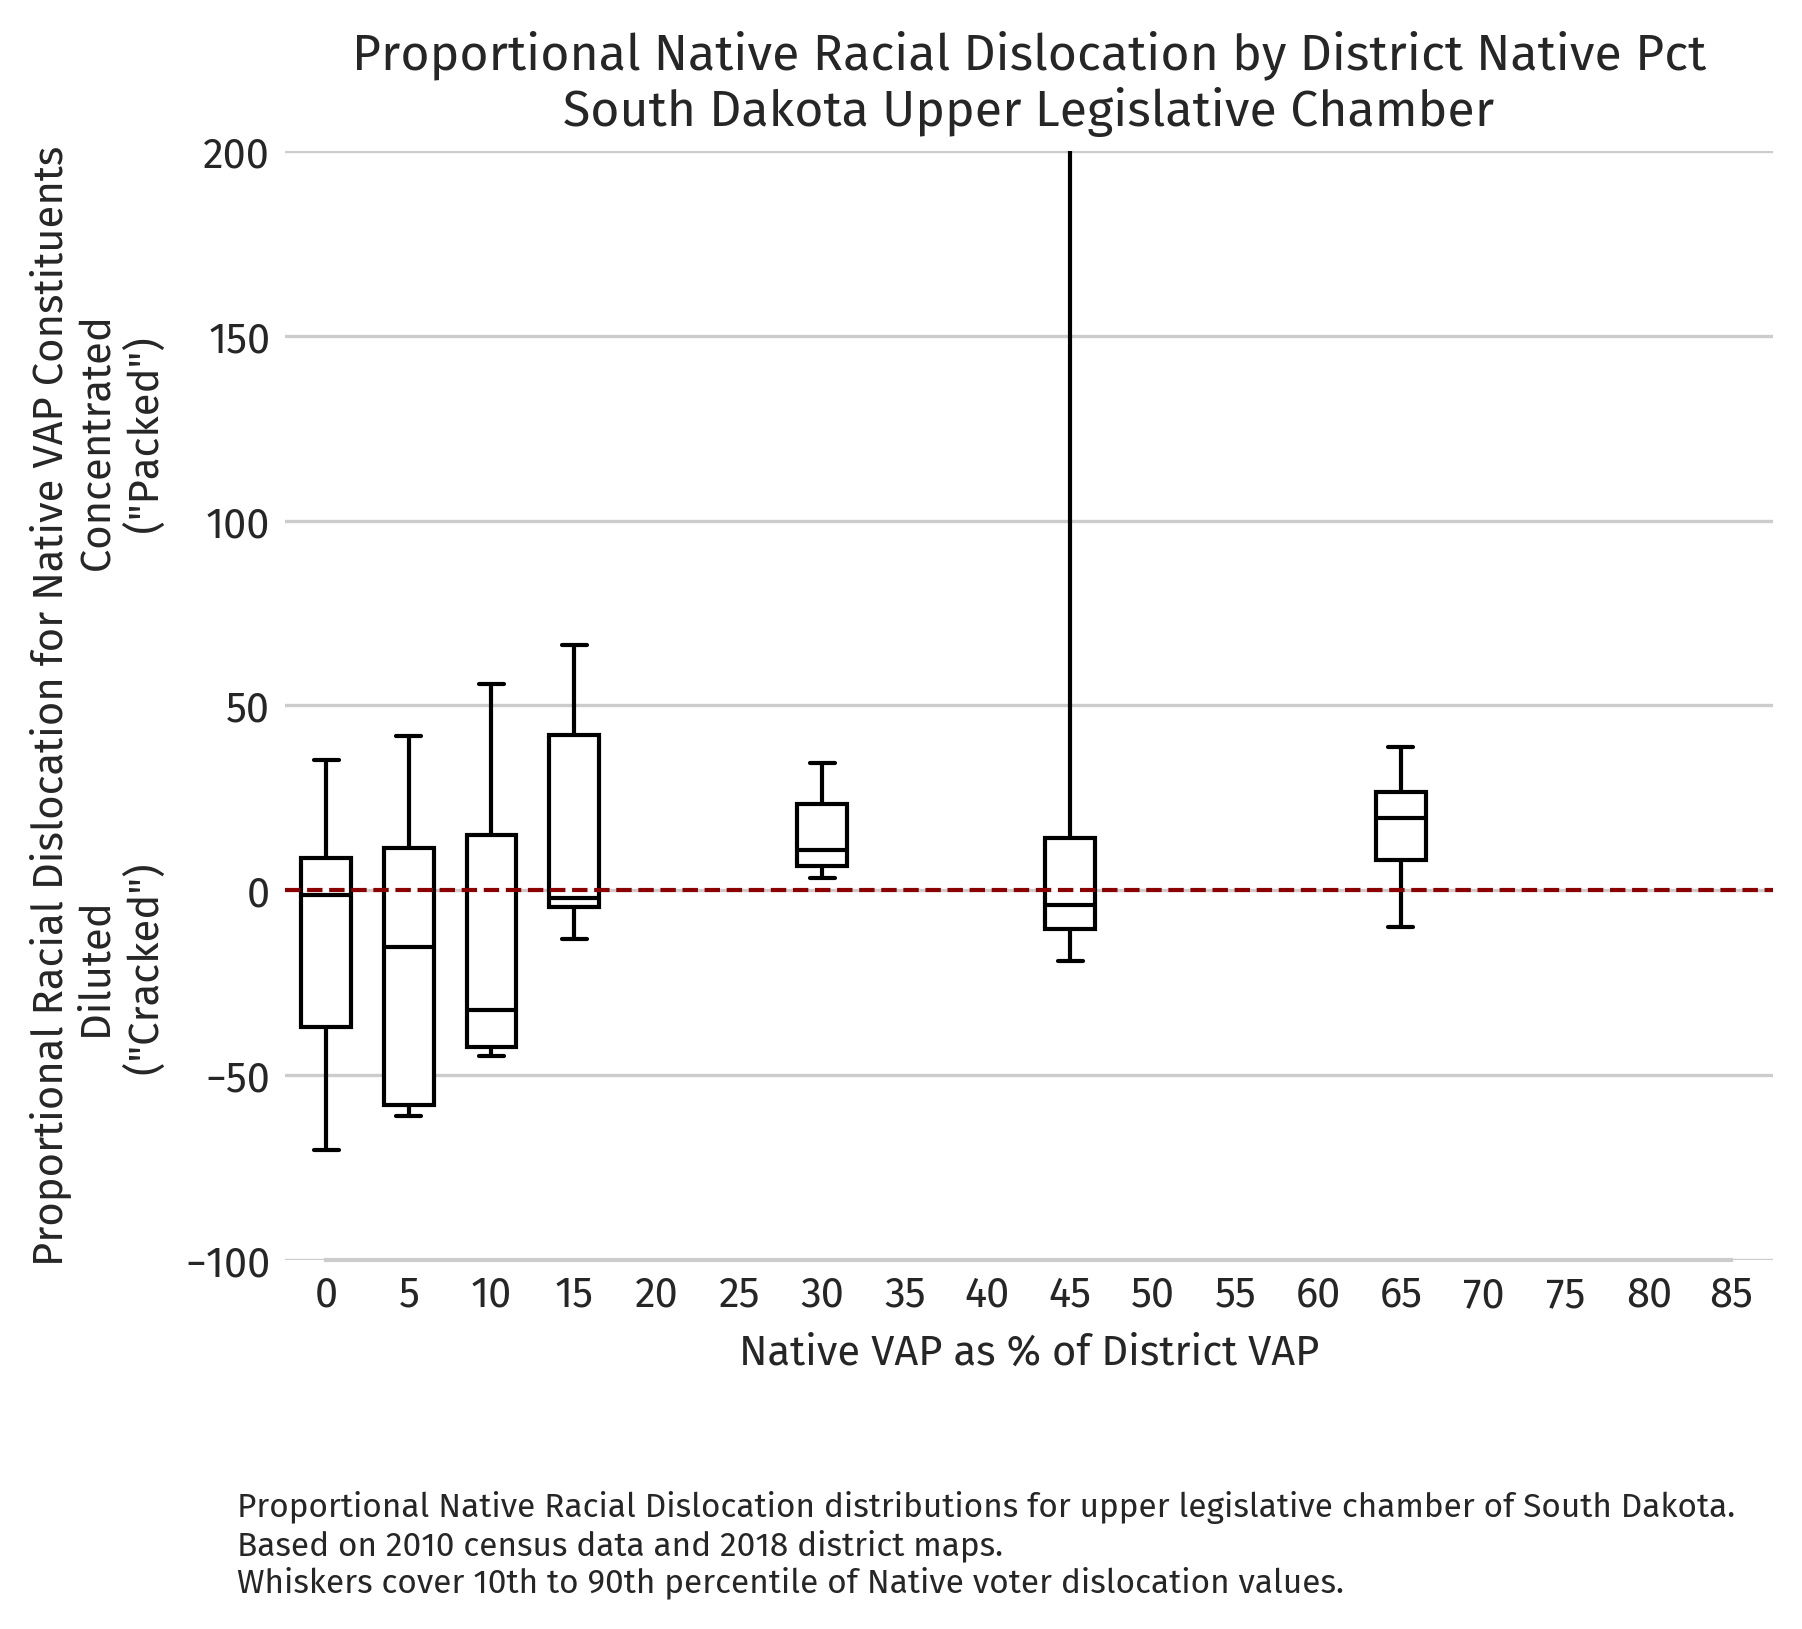
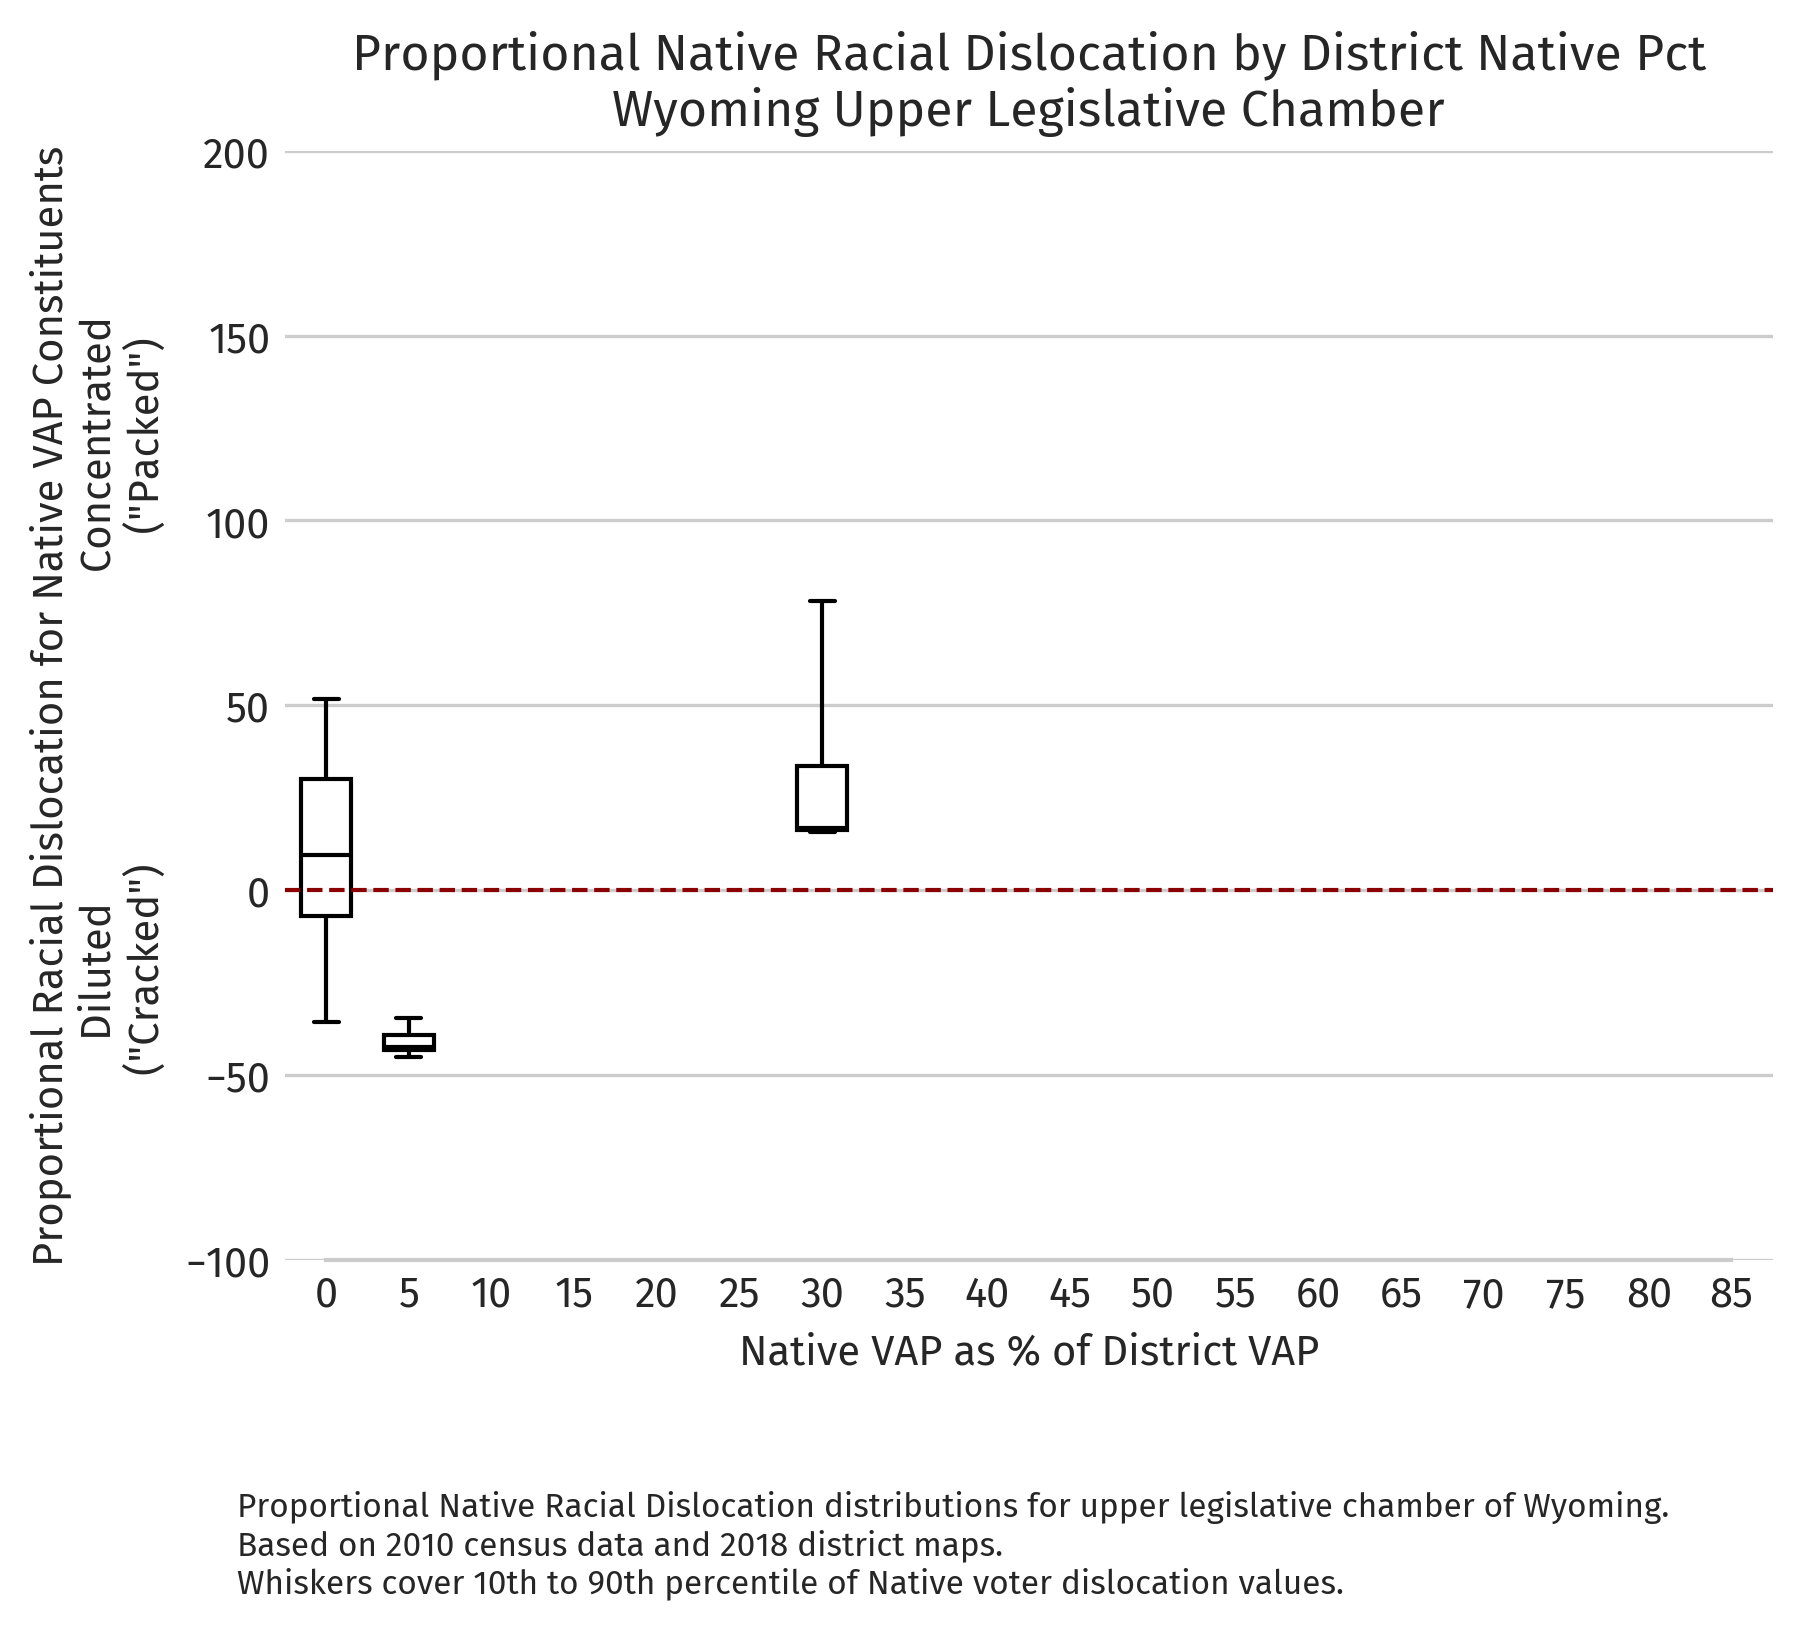
Alaska — Proportional dislocation by district NVAP (2010 redistricting cycle)Arizona — Proportional dislocation by district NVAP (2010 redistricting cycle)Montana — Proportional dislocation by district NVAP (2010 redistricting cycle)North Dakota — Proportional dislocation by district NVAP (2010 redistricting cycle)New Mexico — Proportional dislocation by district NVAP (2010 redistricting cycle)South Dakota — Proportional dislocation by district NVAP (2010 redistricting cycle)Wyoming — Proportional dislocation by district NVAP (2010 redistricting cycle)