District Native Share Histograms
·1 min
These figures show the distribution of state legislative districts by their Native voting-age population (NVAP) share, distinguishing between districts that did and did not elect a Native representative.
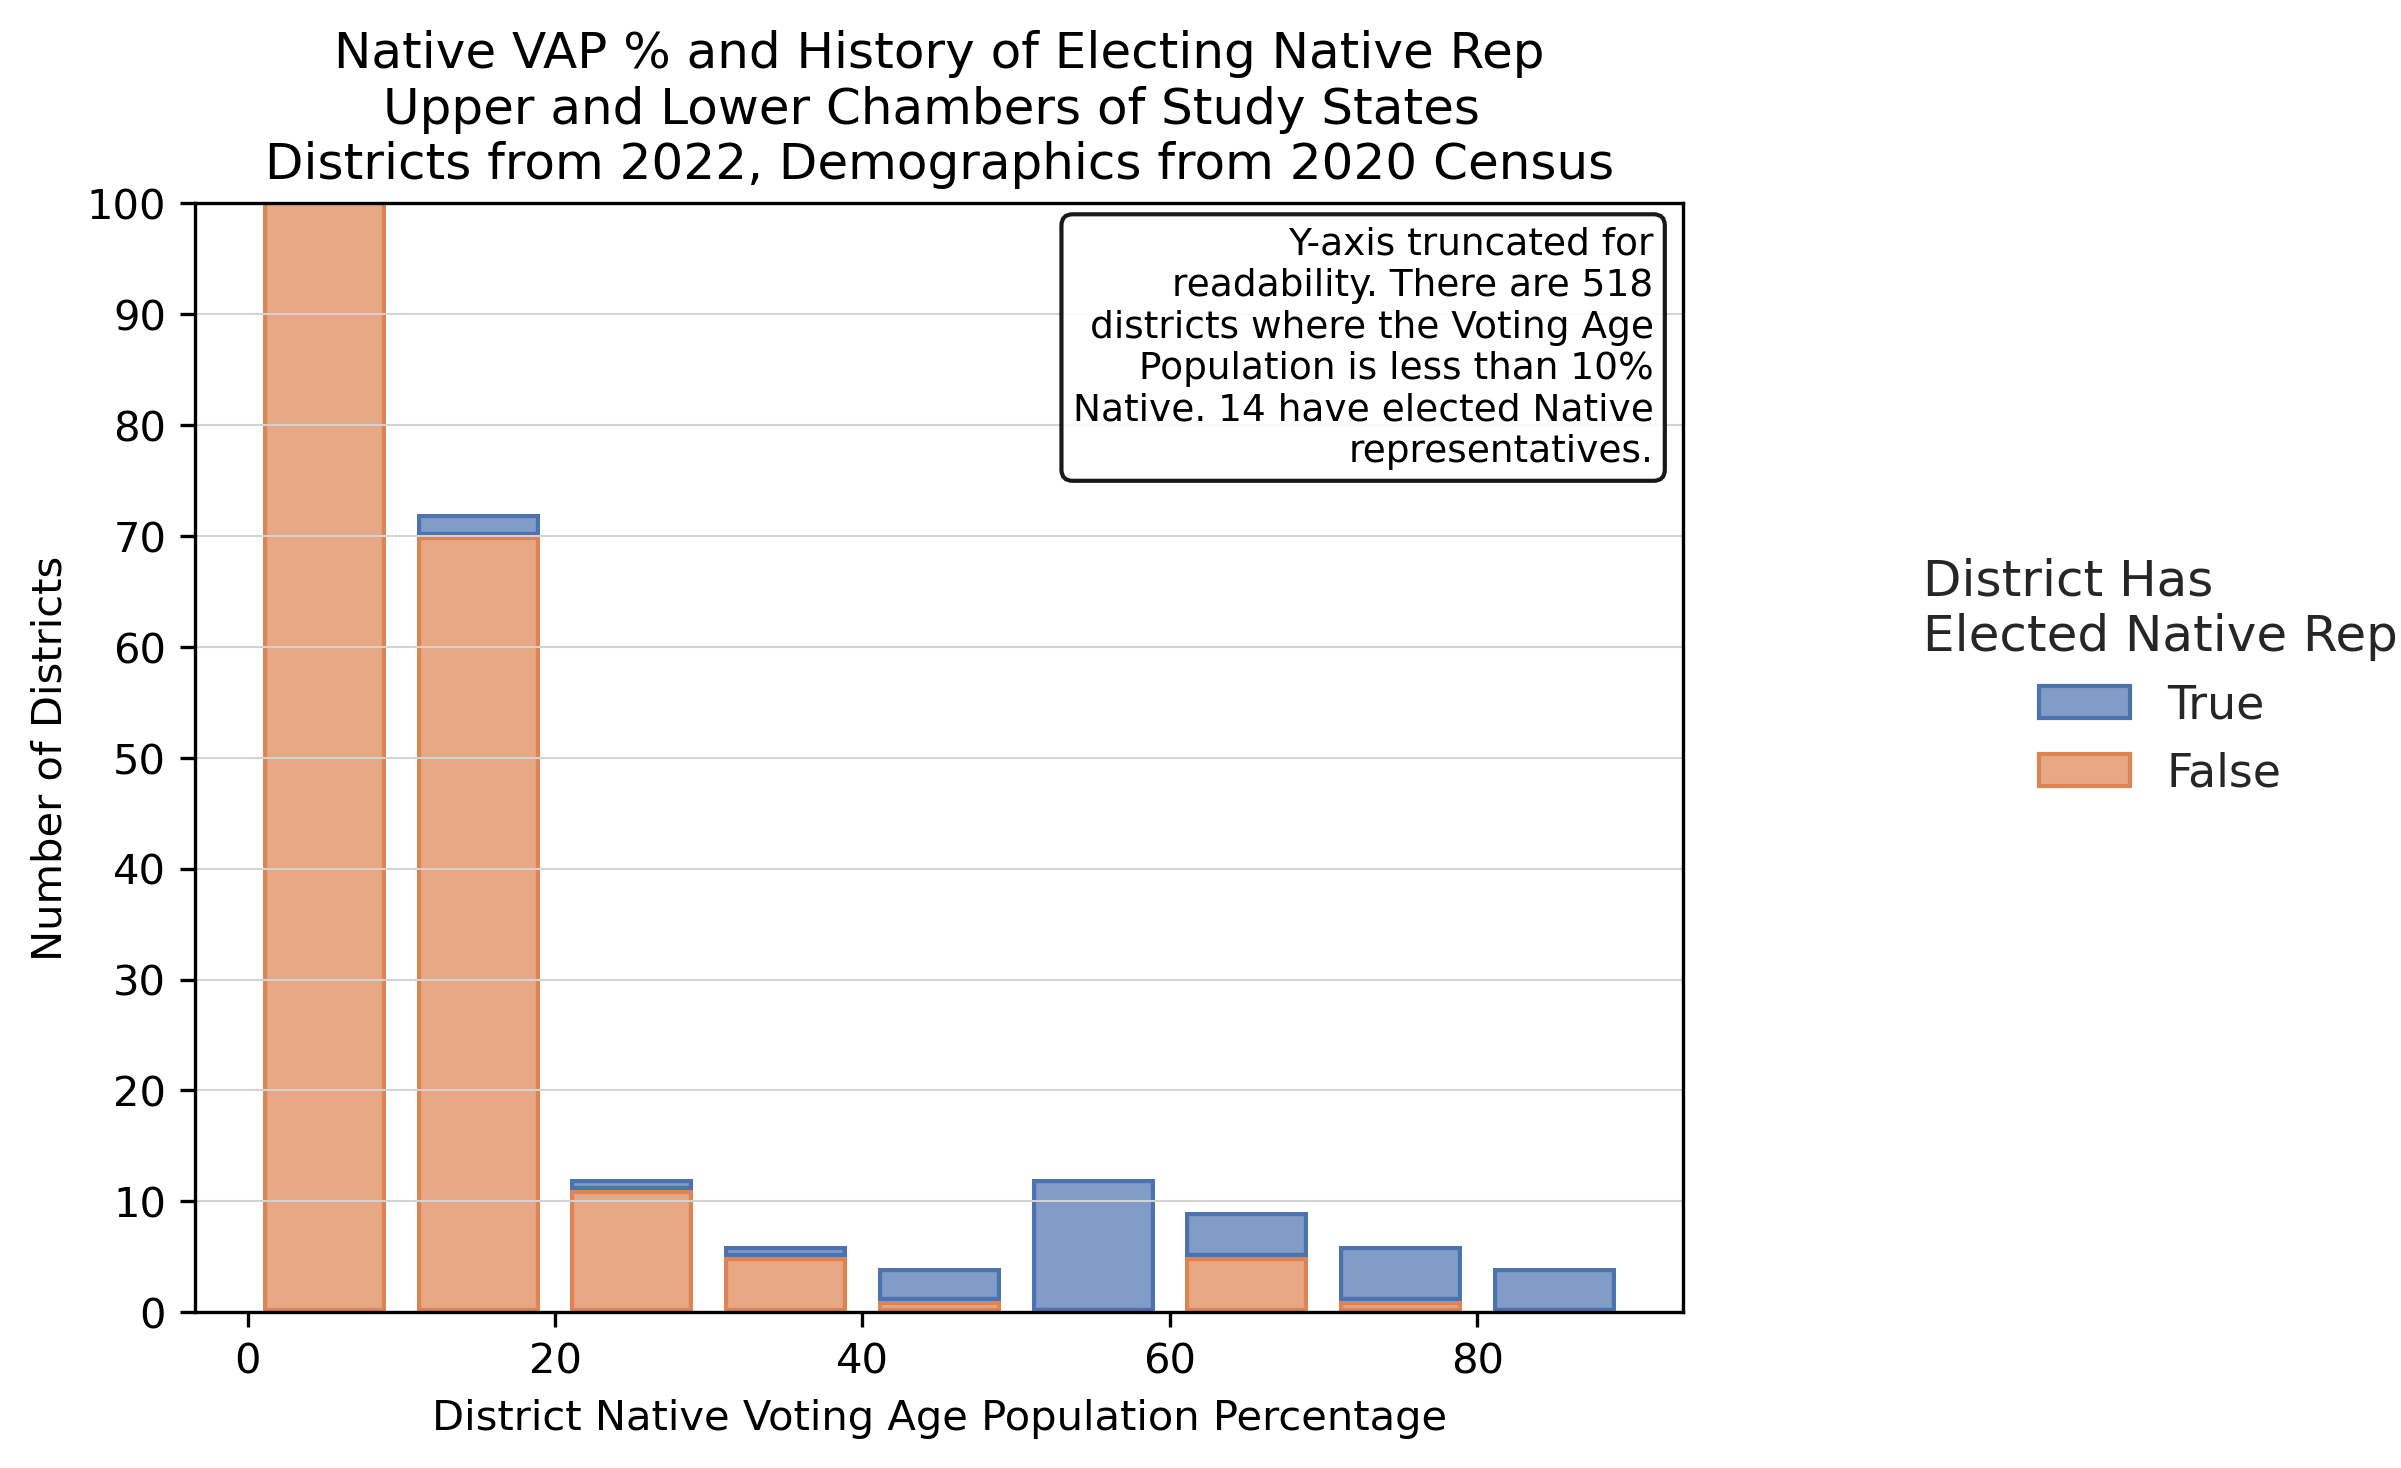
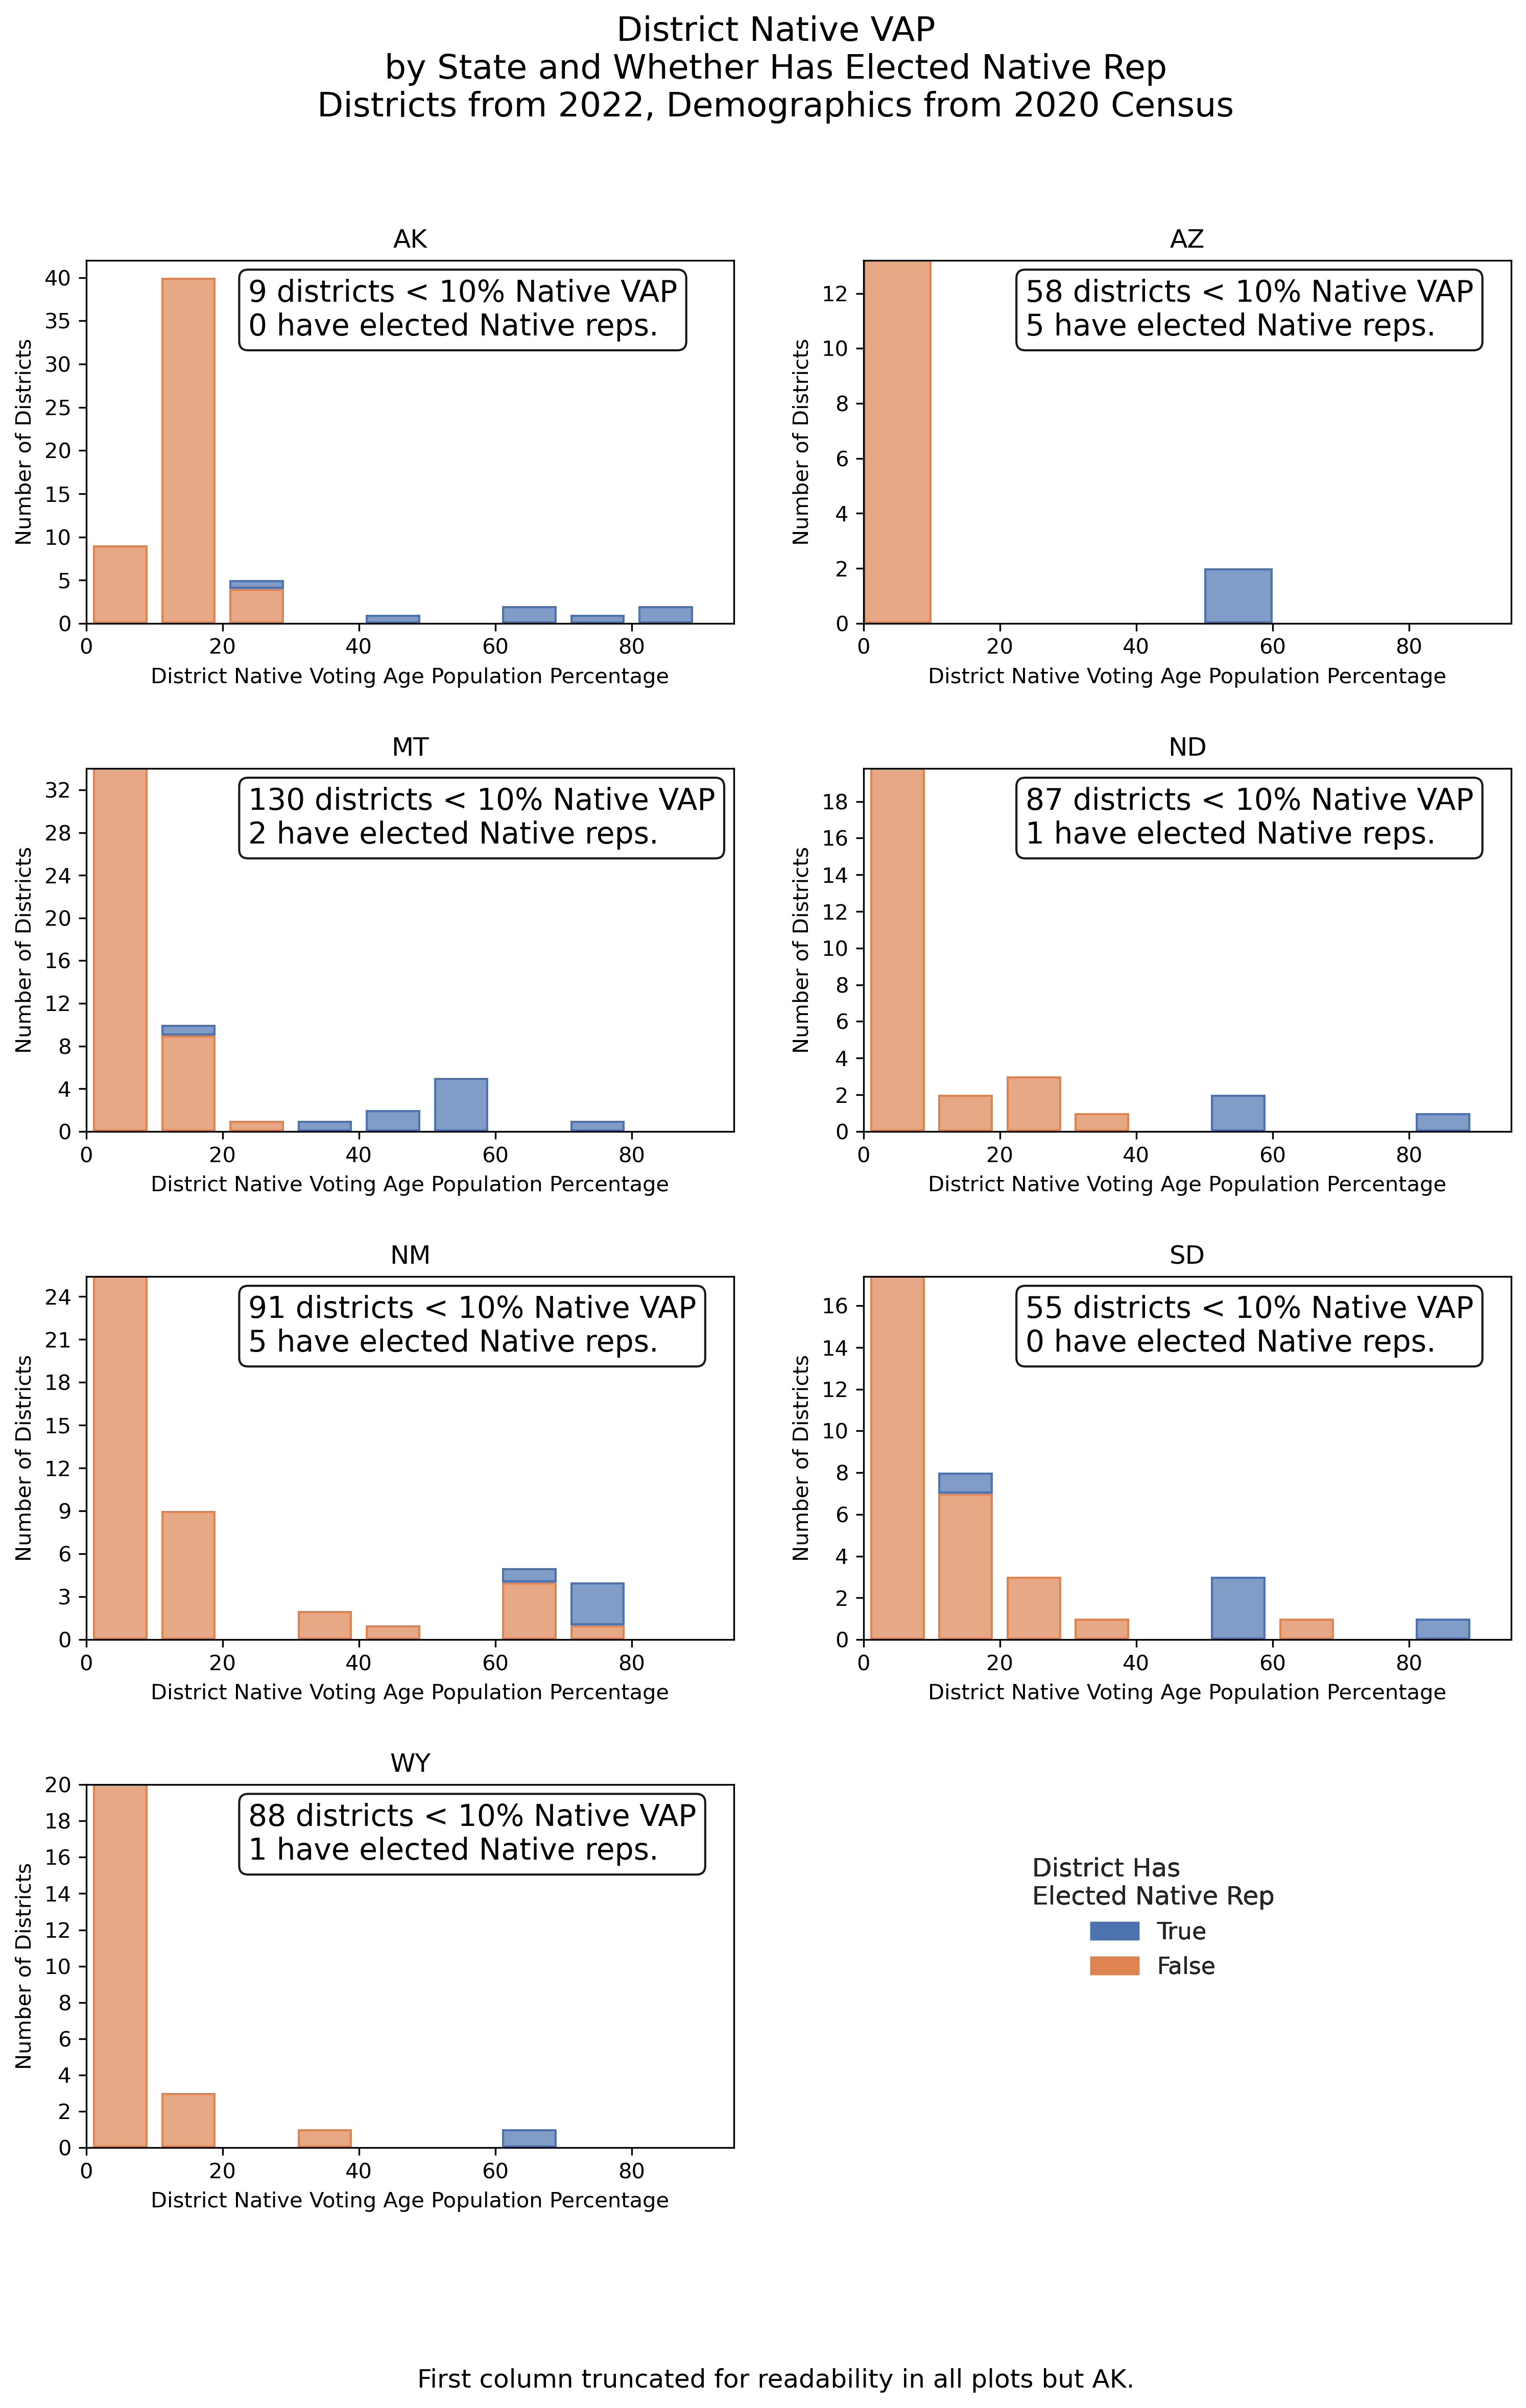
2020 Redistricting Cycle #
National #
Figure 1 in the paper
By State #
Figure 2 in the paper
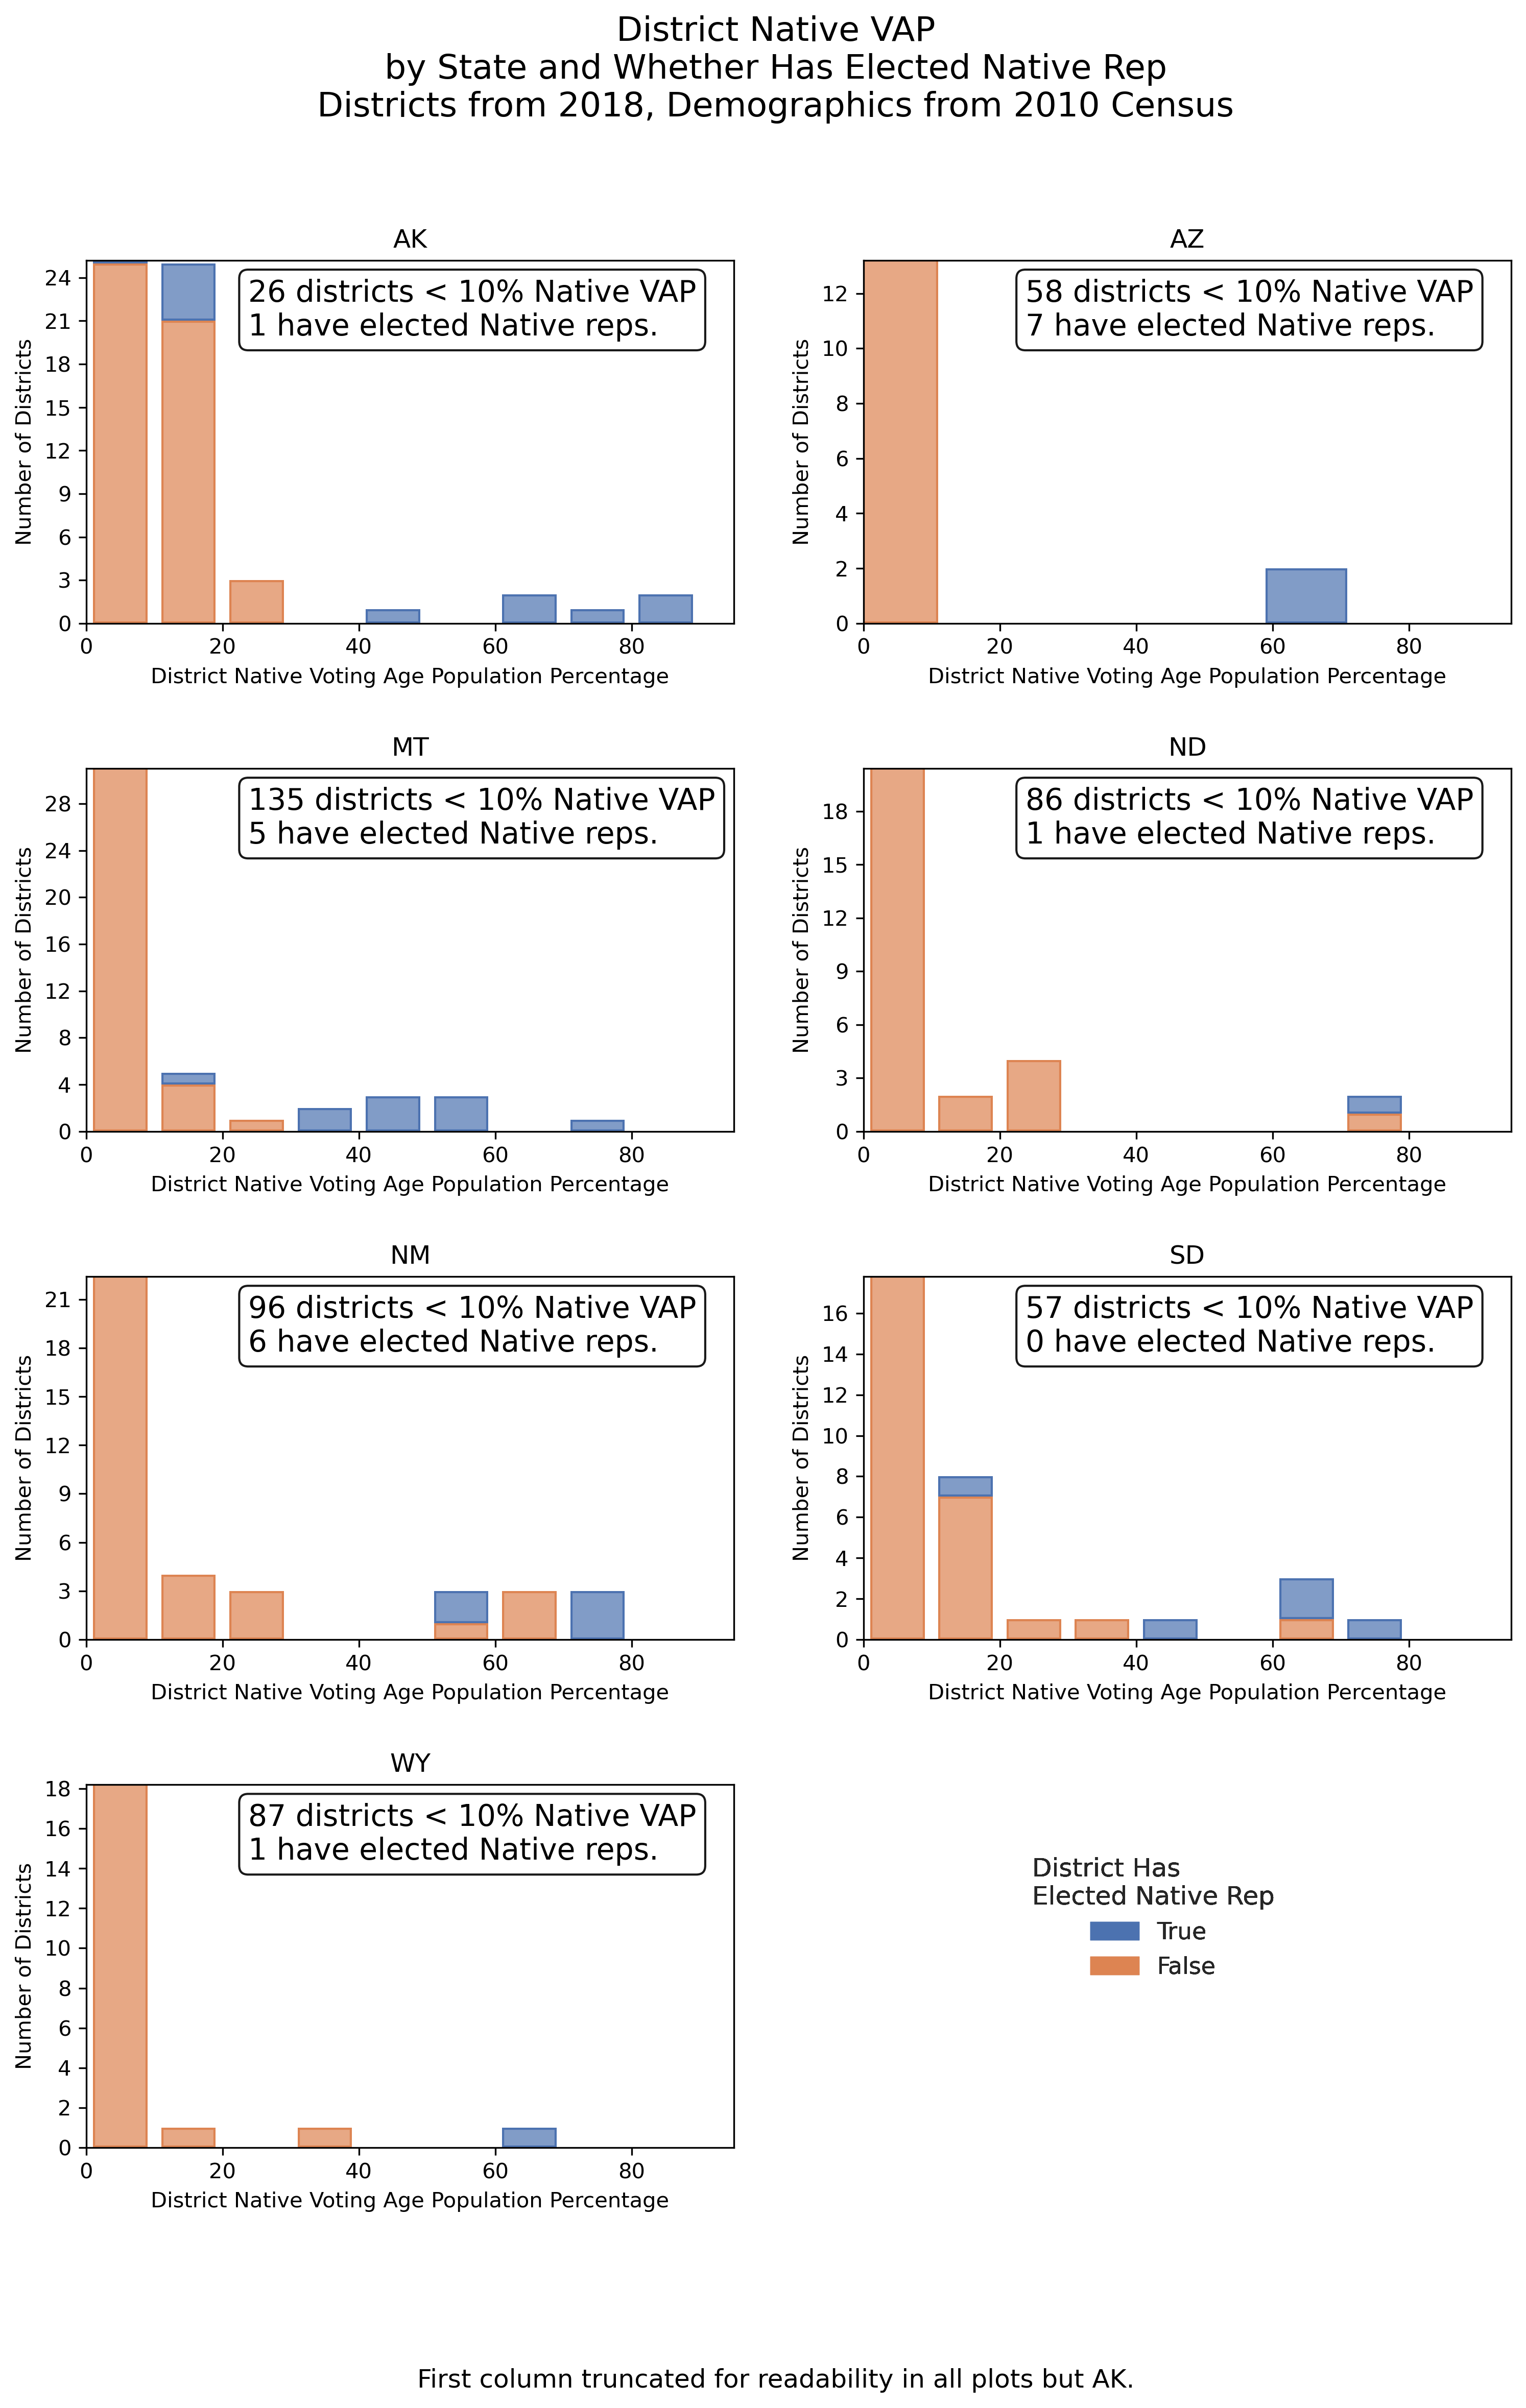
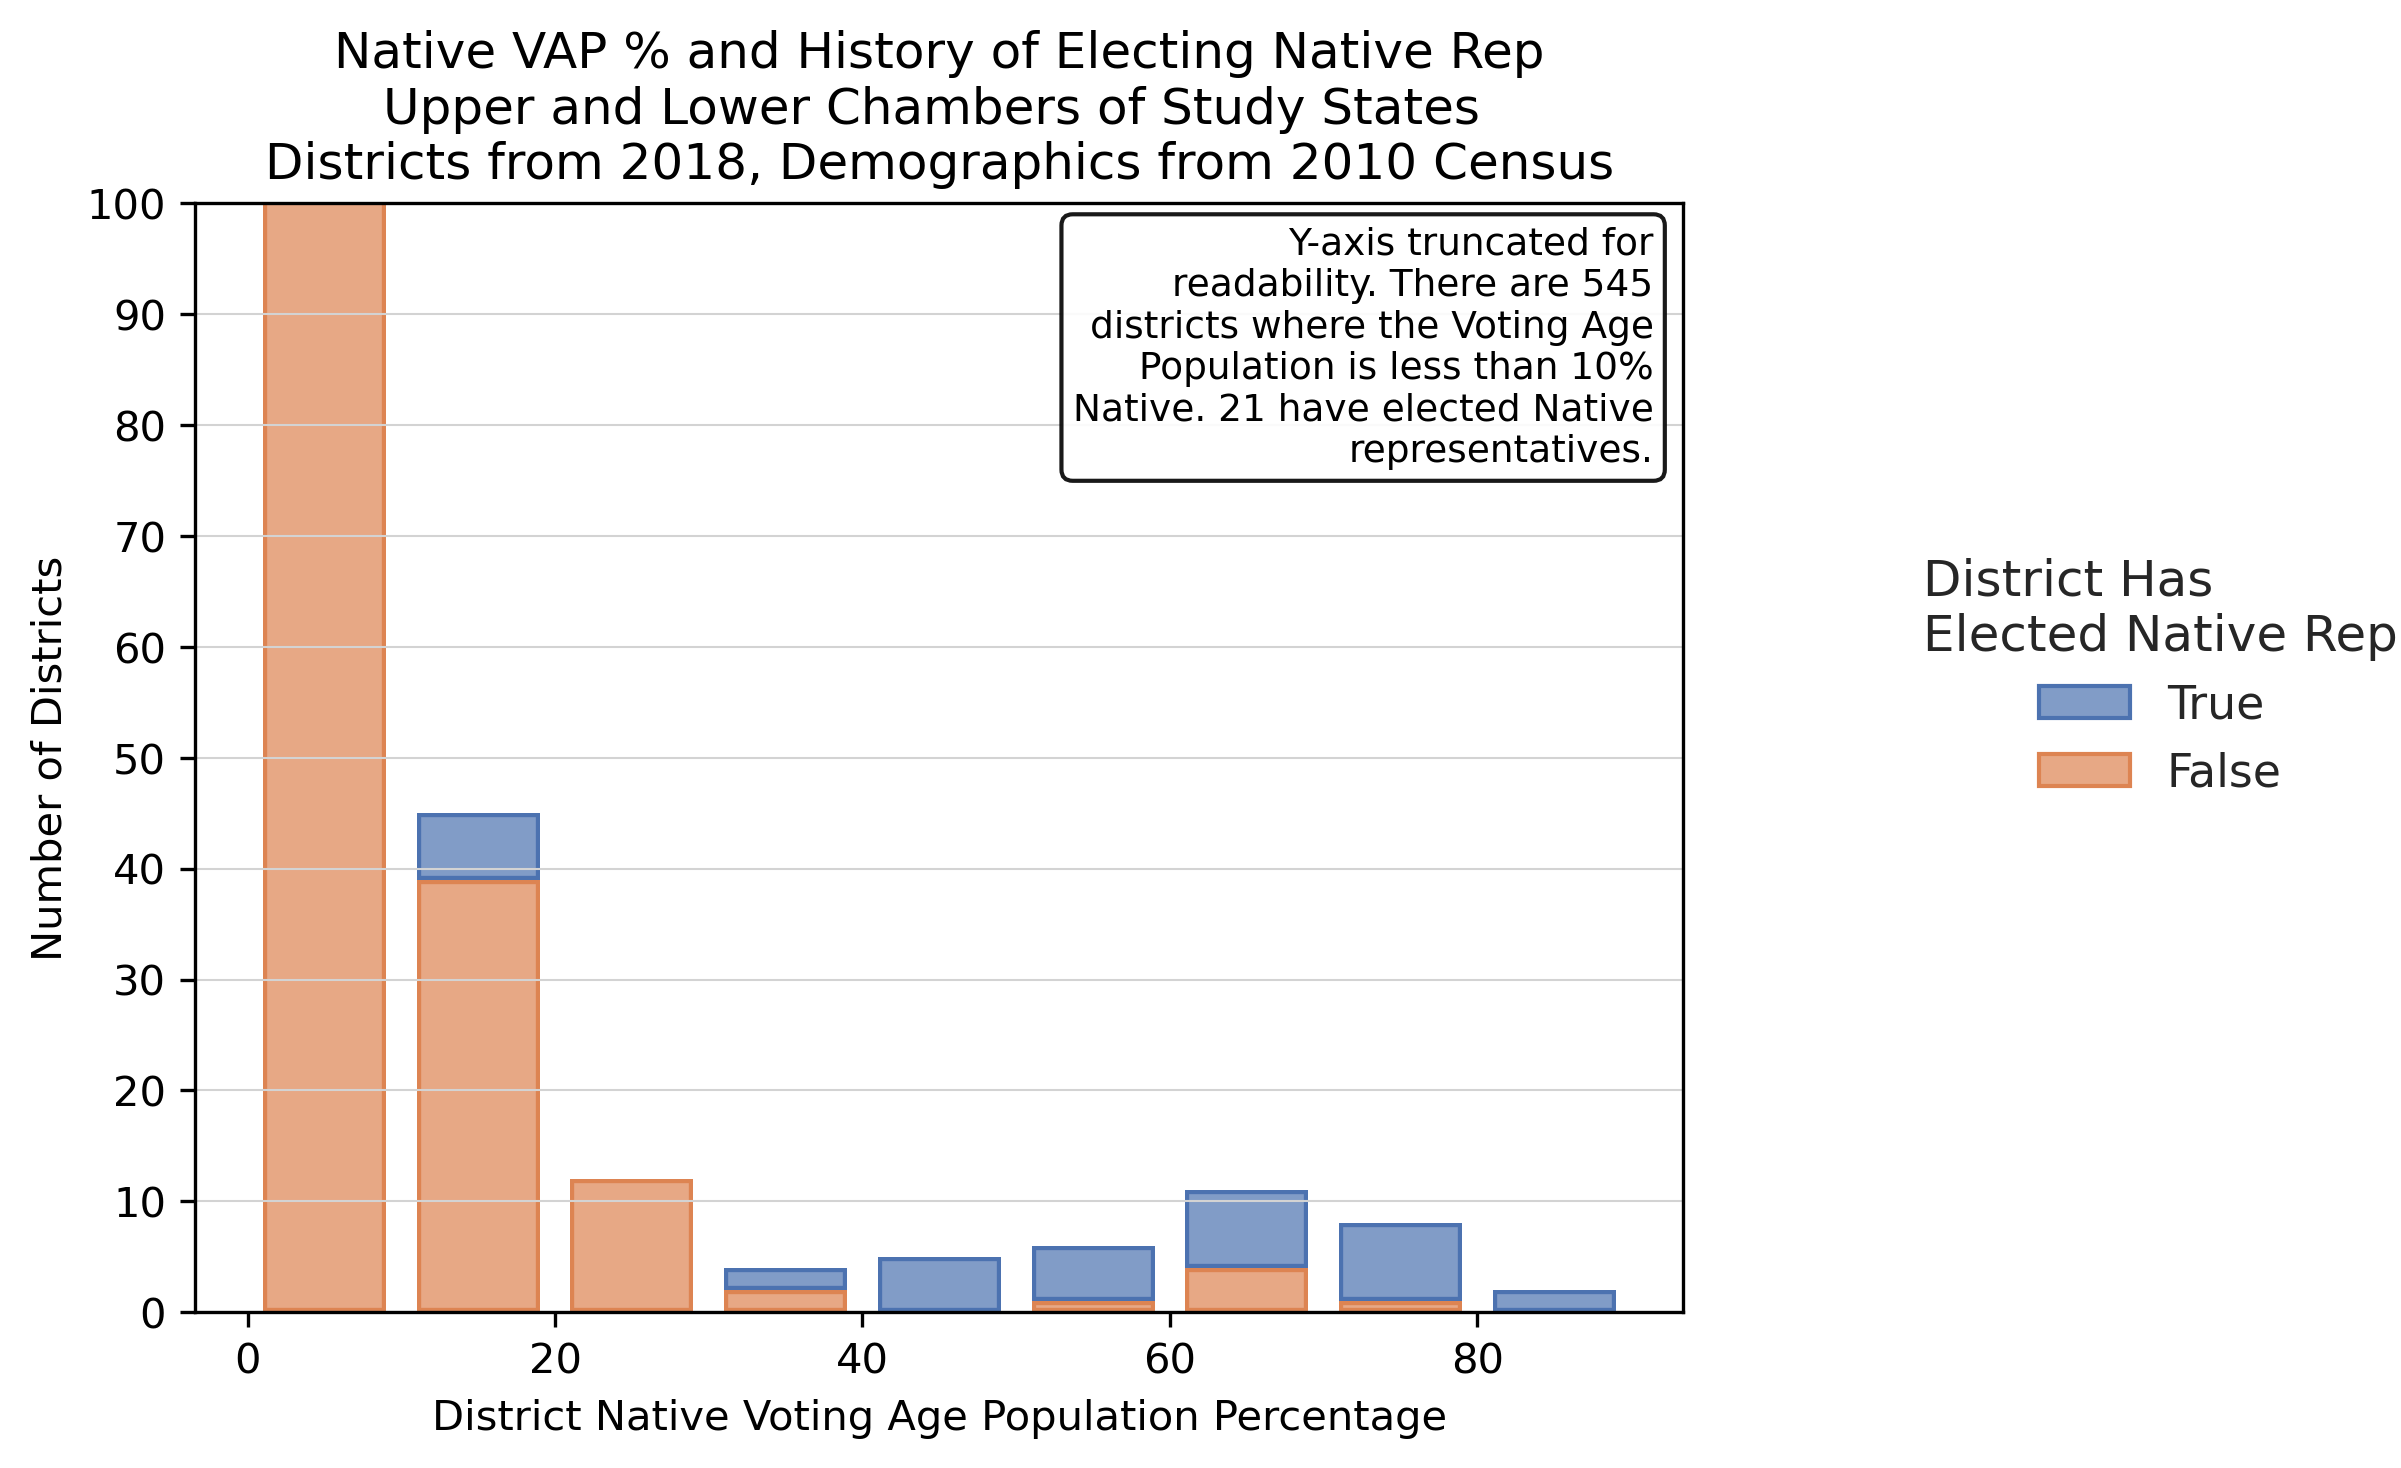
2010 Redistricting Cycle #
National #
By State #