Native Representation Probability Plots
·1 min
These figures show the relationship between a district’s Native voting-age population (NVAP) share and the probability that it elects a Native representative. Figures from the 2020 redistricting cycle (based on the 2020 census) appear first, followed by analogous figures from the 2010 redistricting cycle.
2020 Redistricting Cycle #
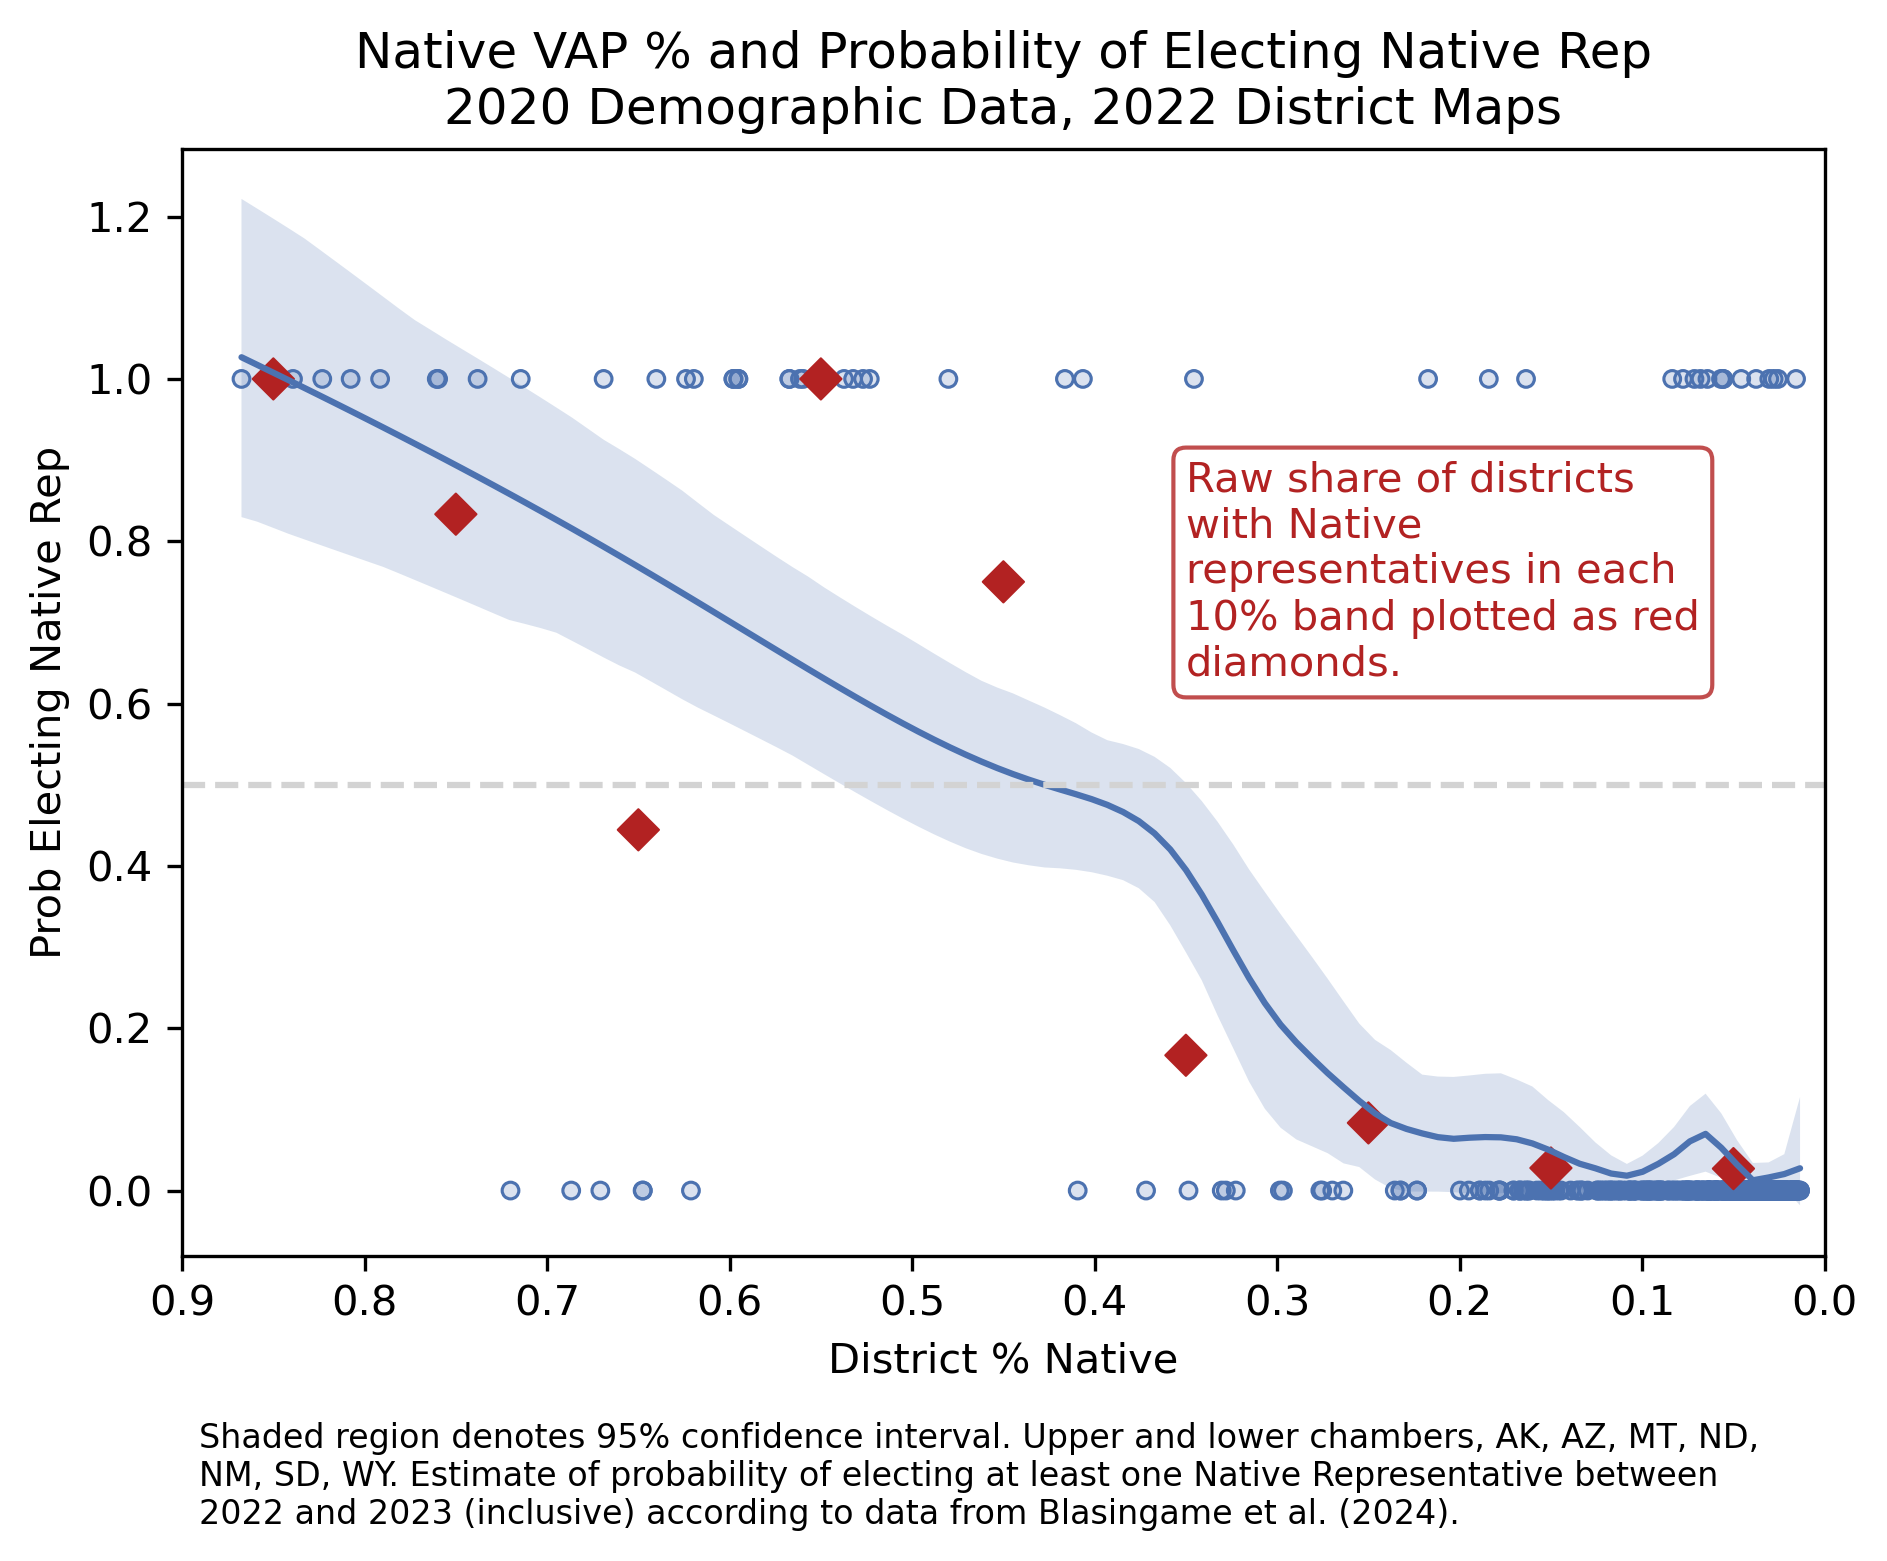
All Chambers — National #
Figure 3 in the paper
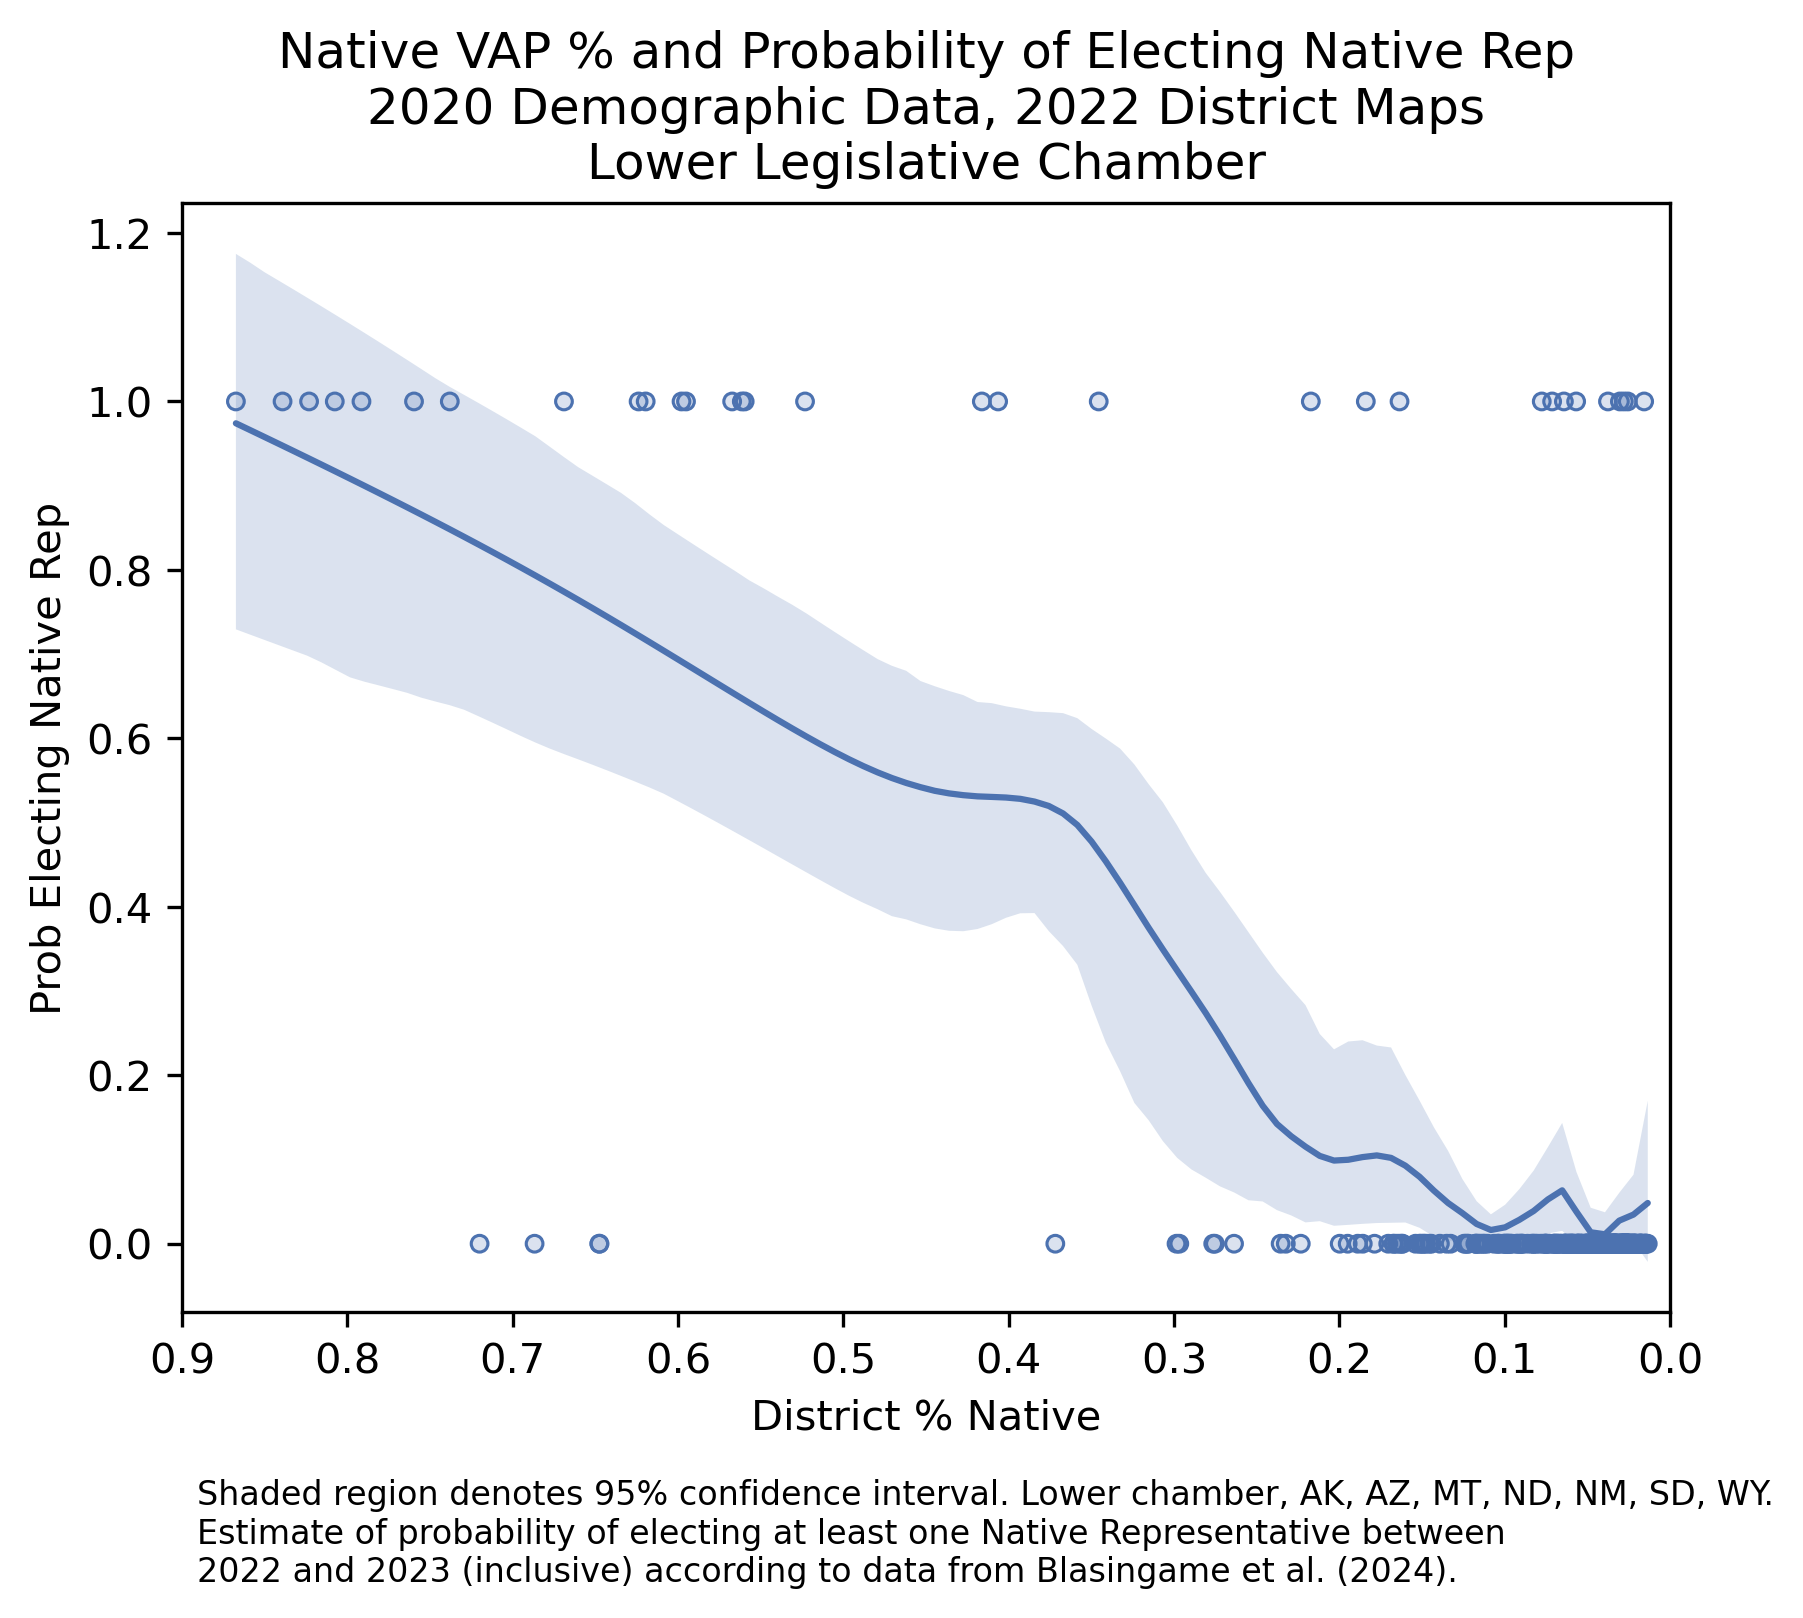
Lower Chamber — National #
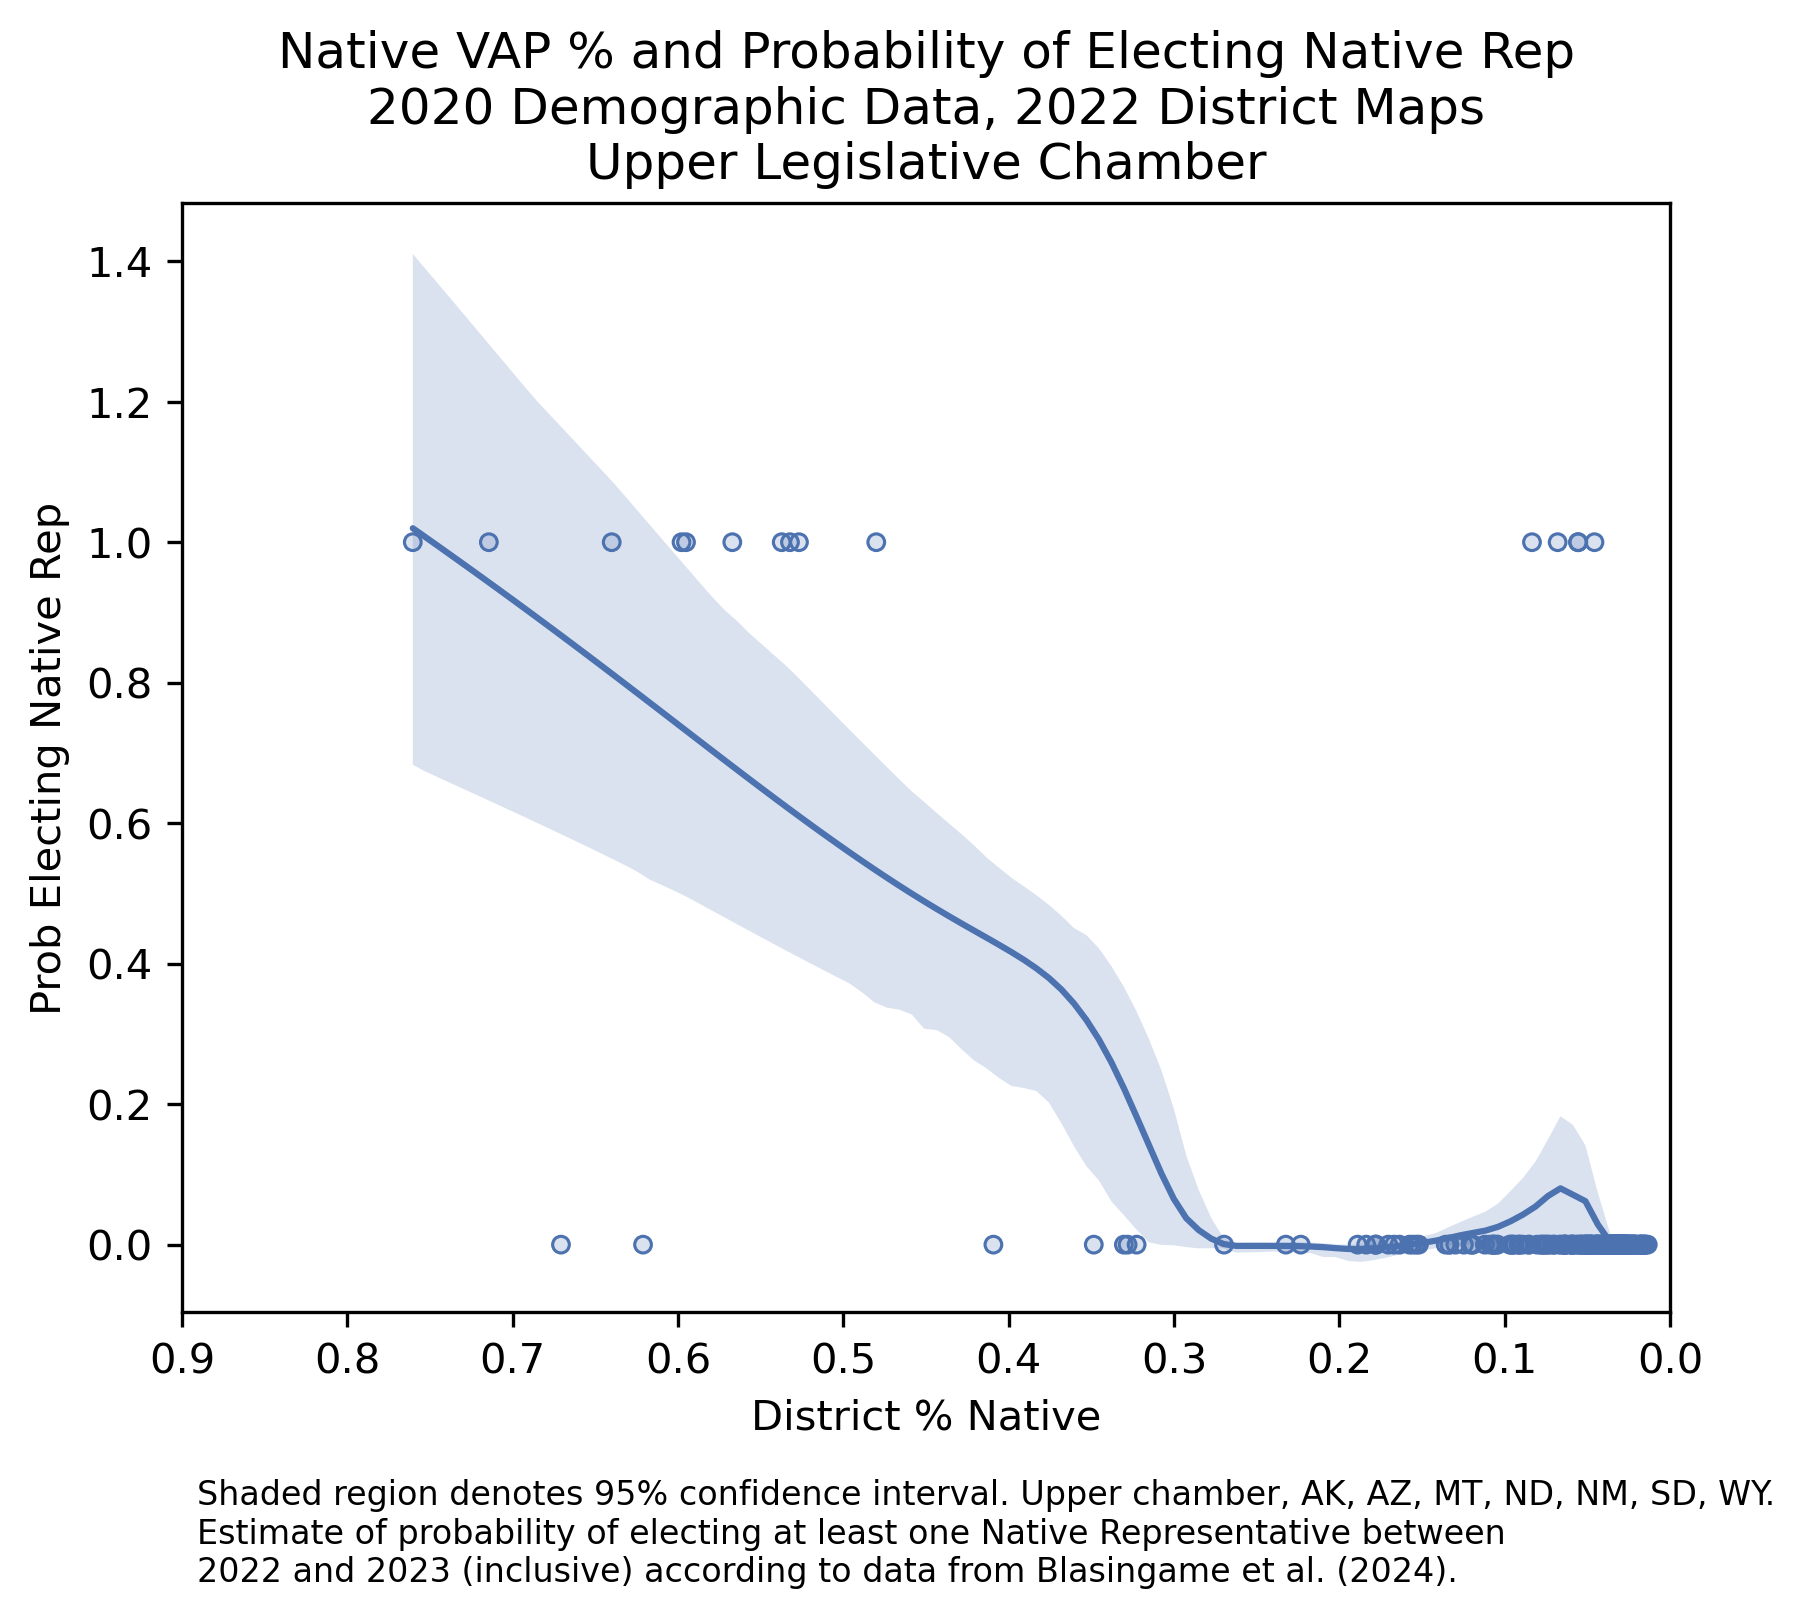
Upper Chamber — National #
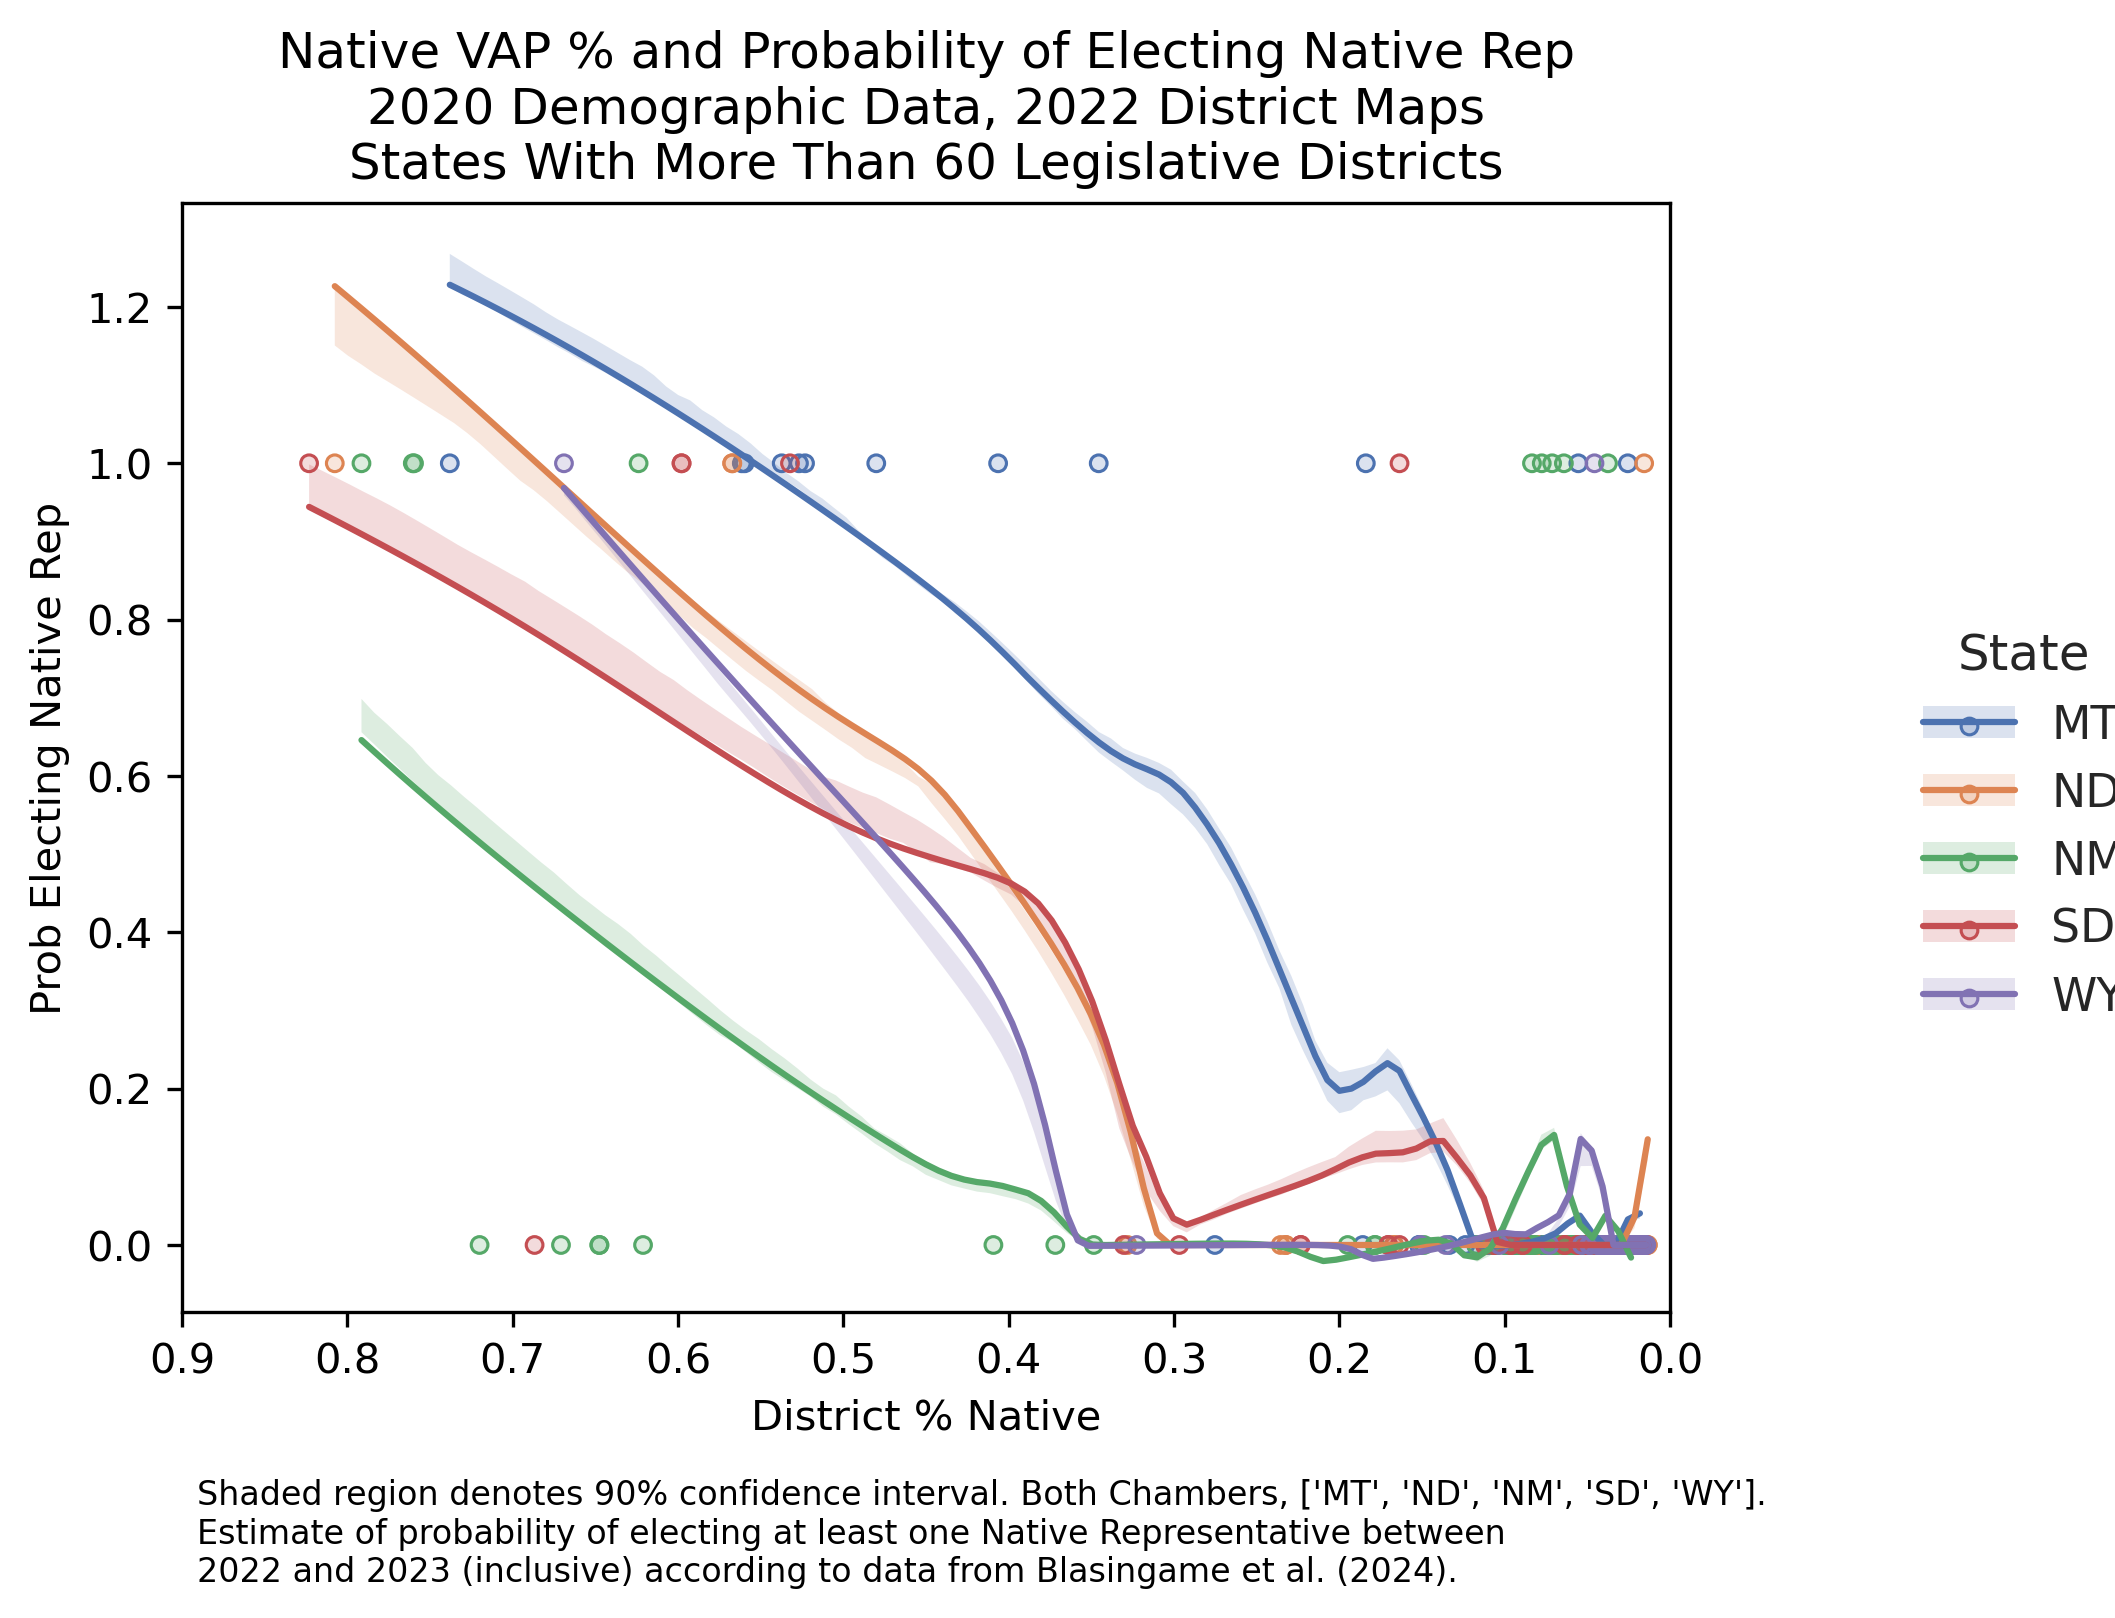
All Chambers — By State #
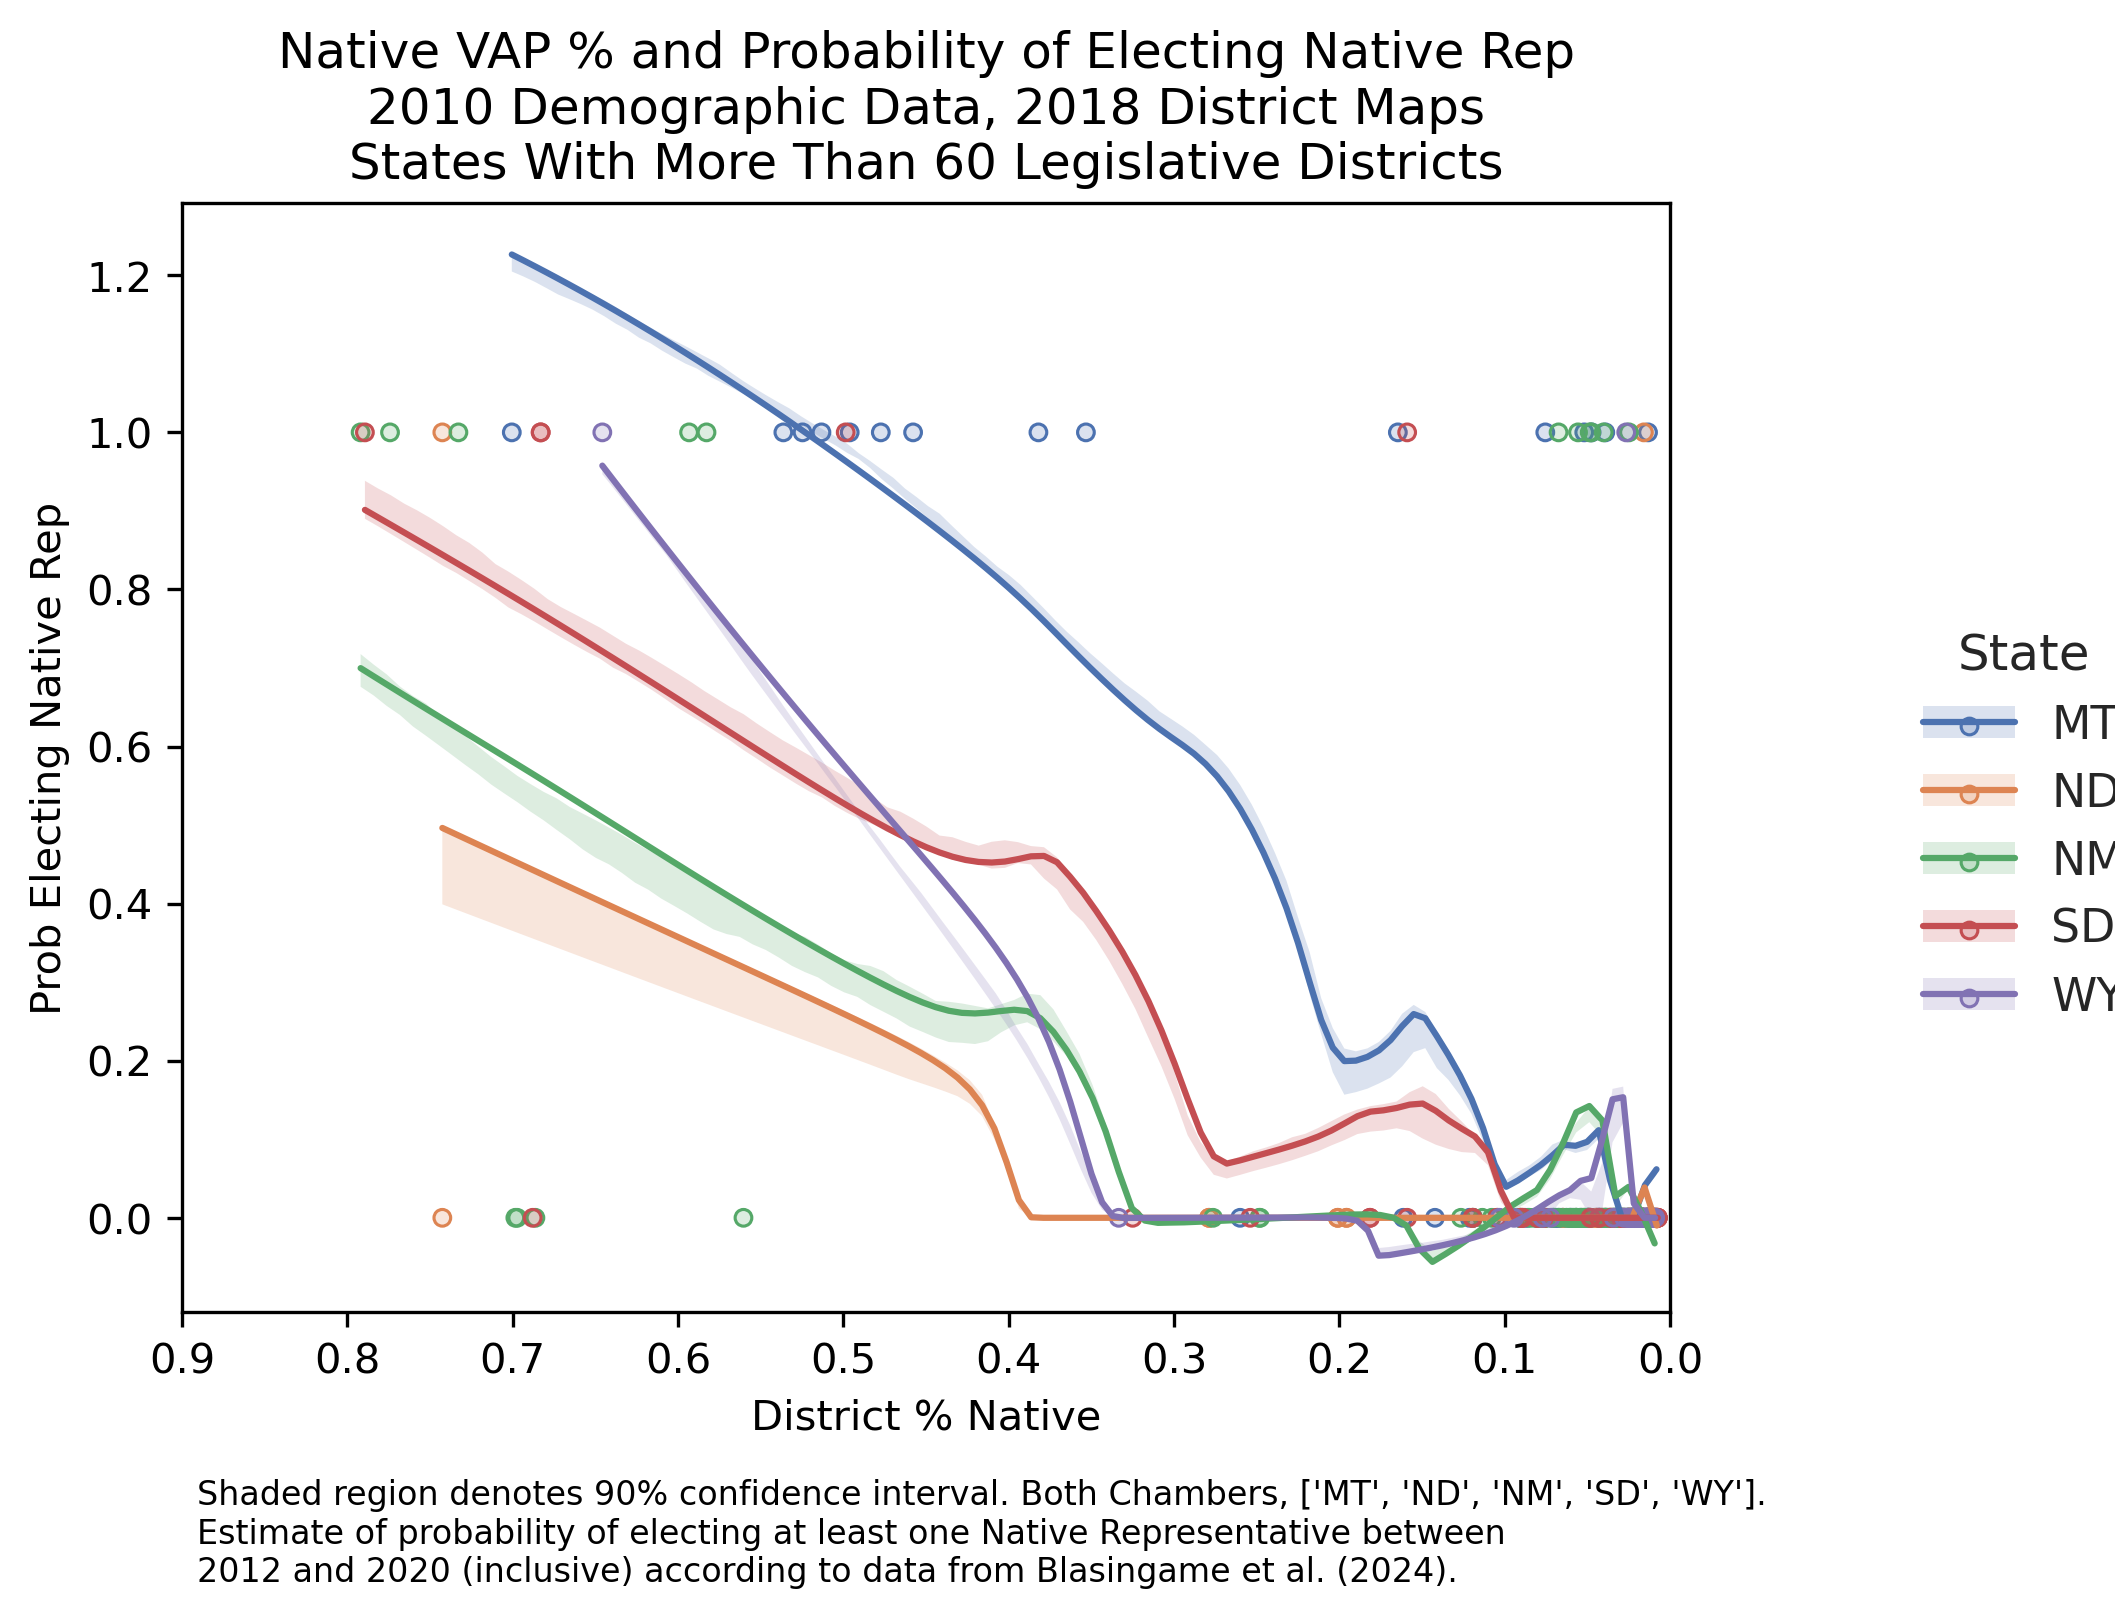
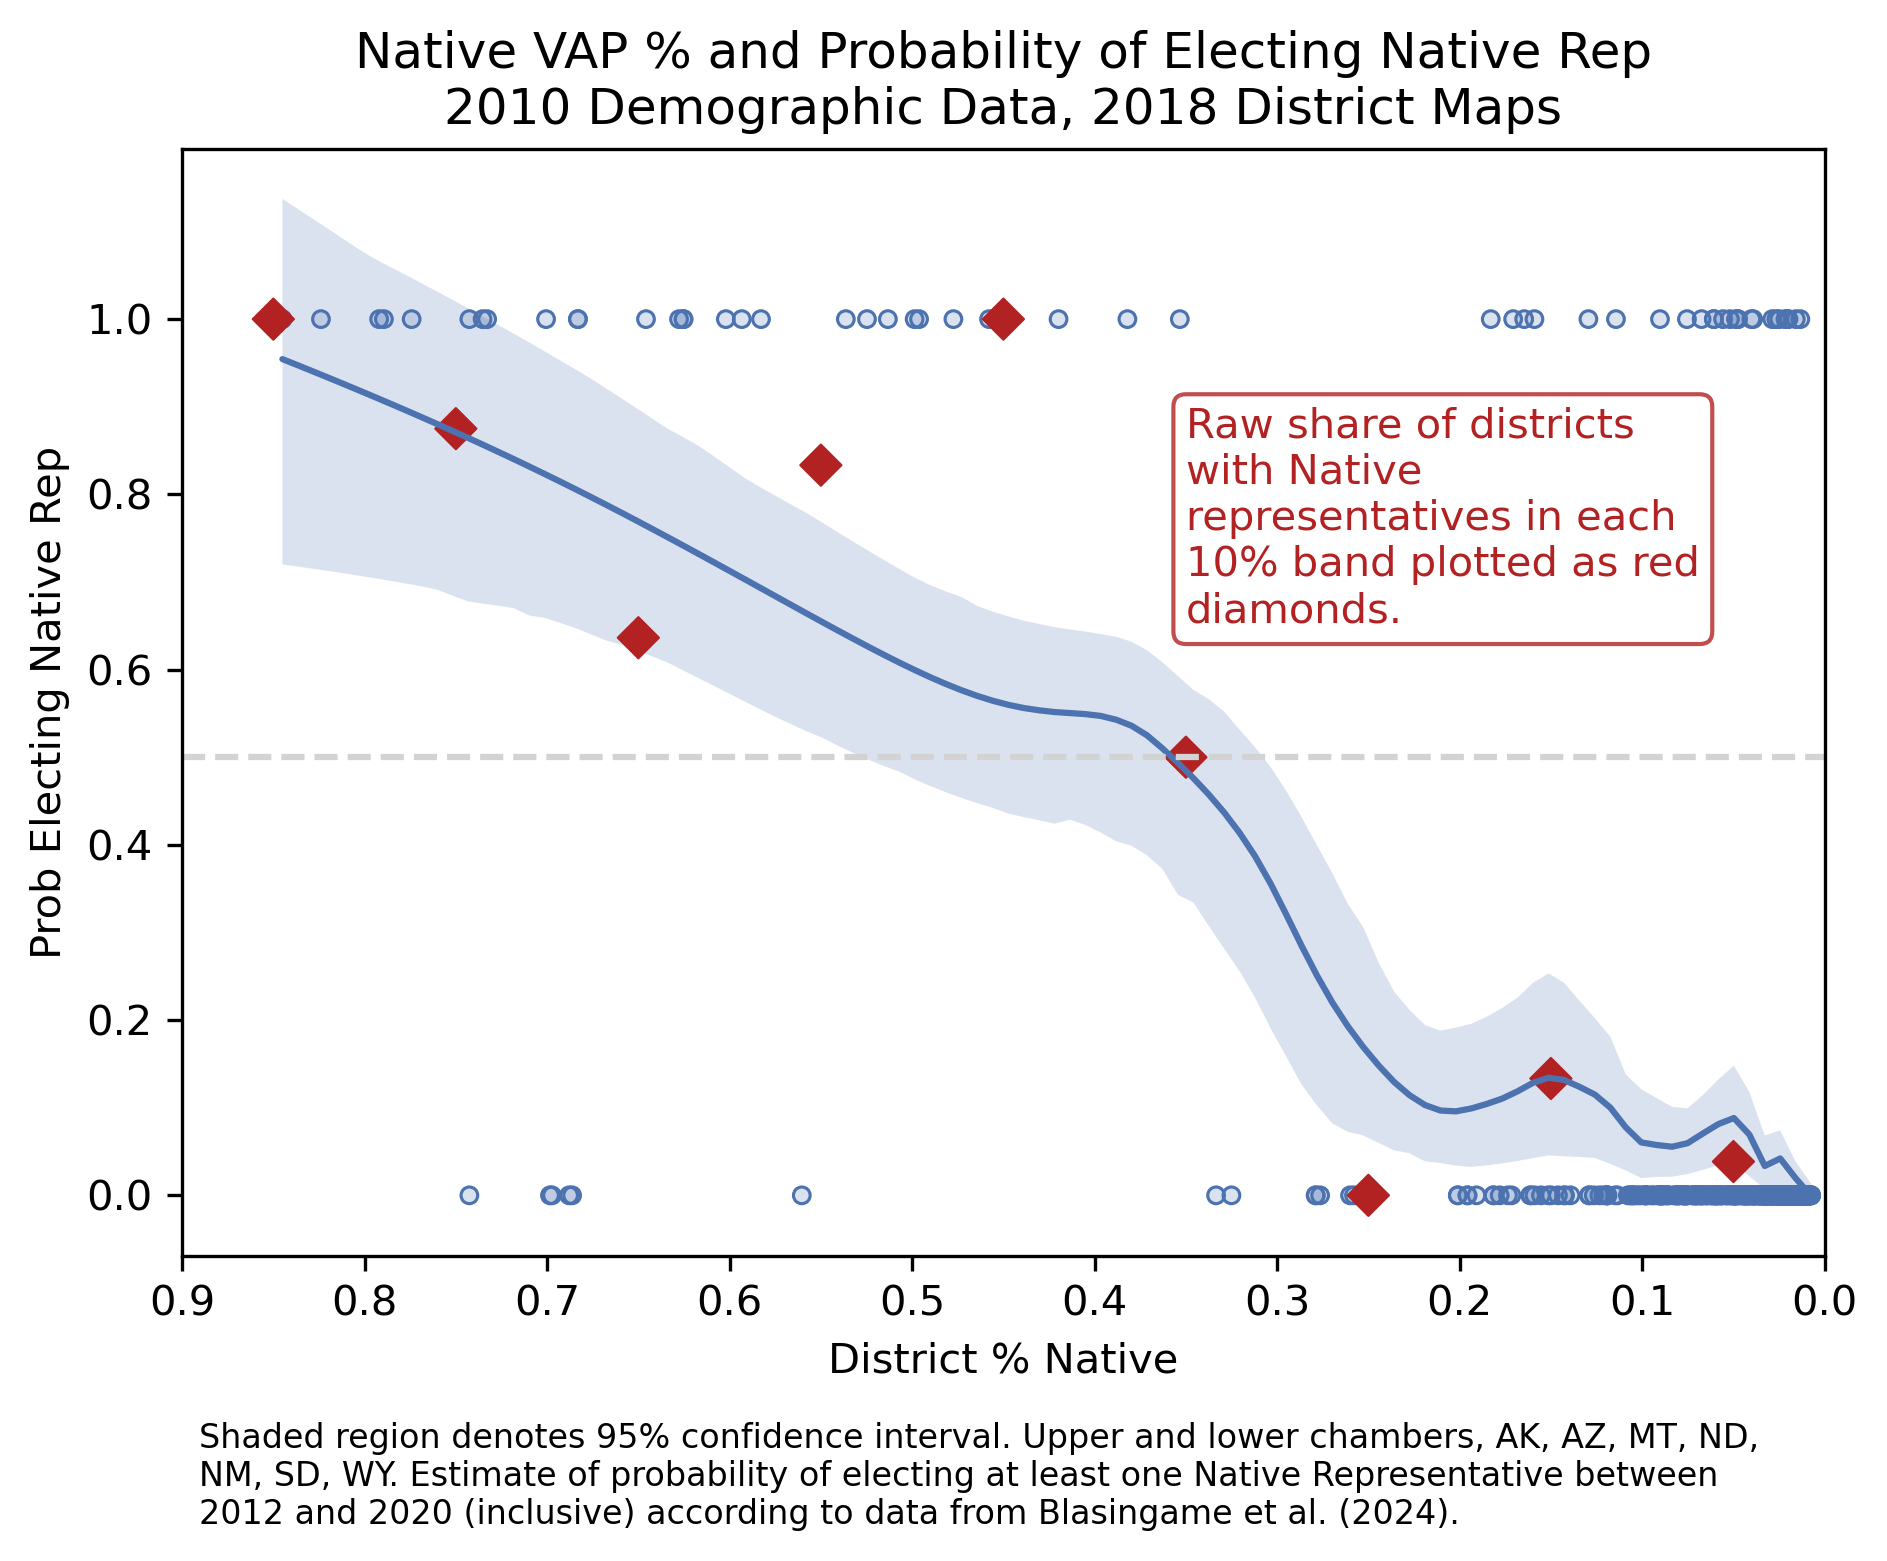
2010 Redistricting Cycle #
All Chambers — National #
Appendix figure in the paper
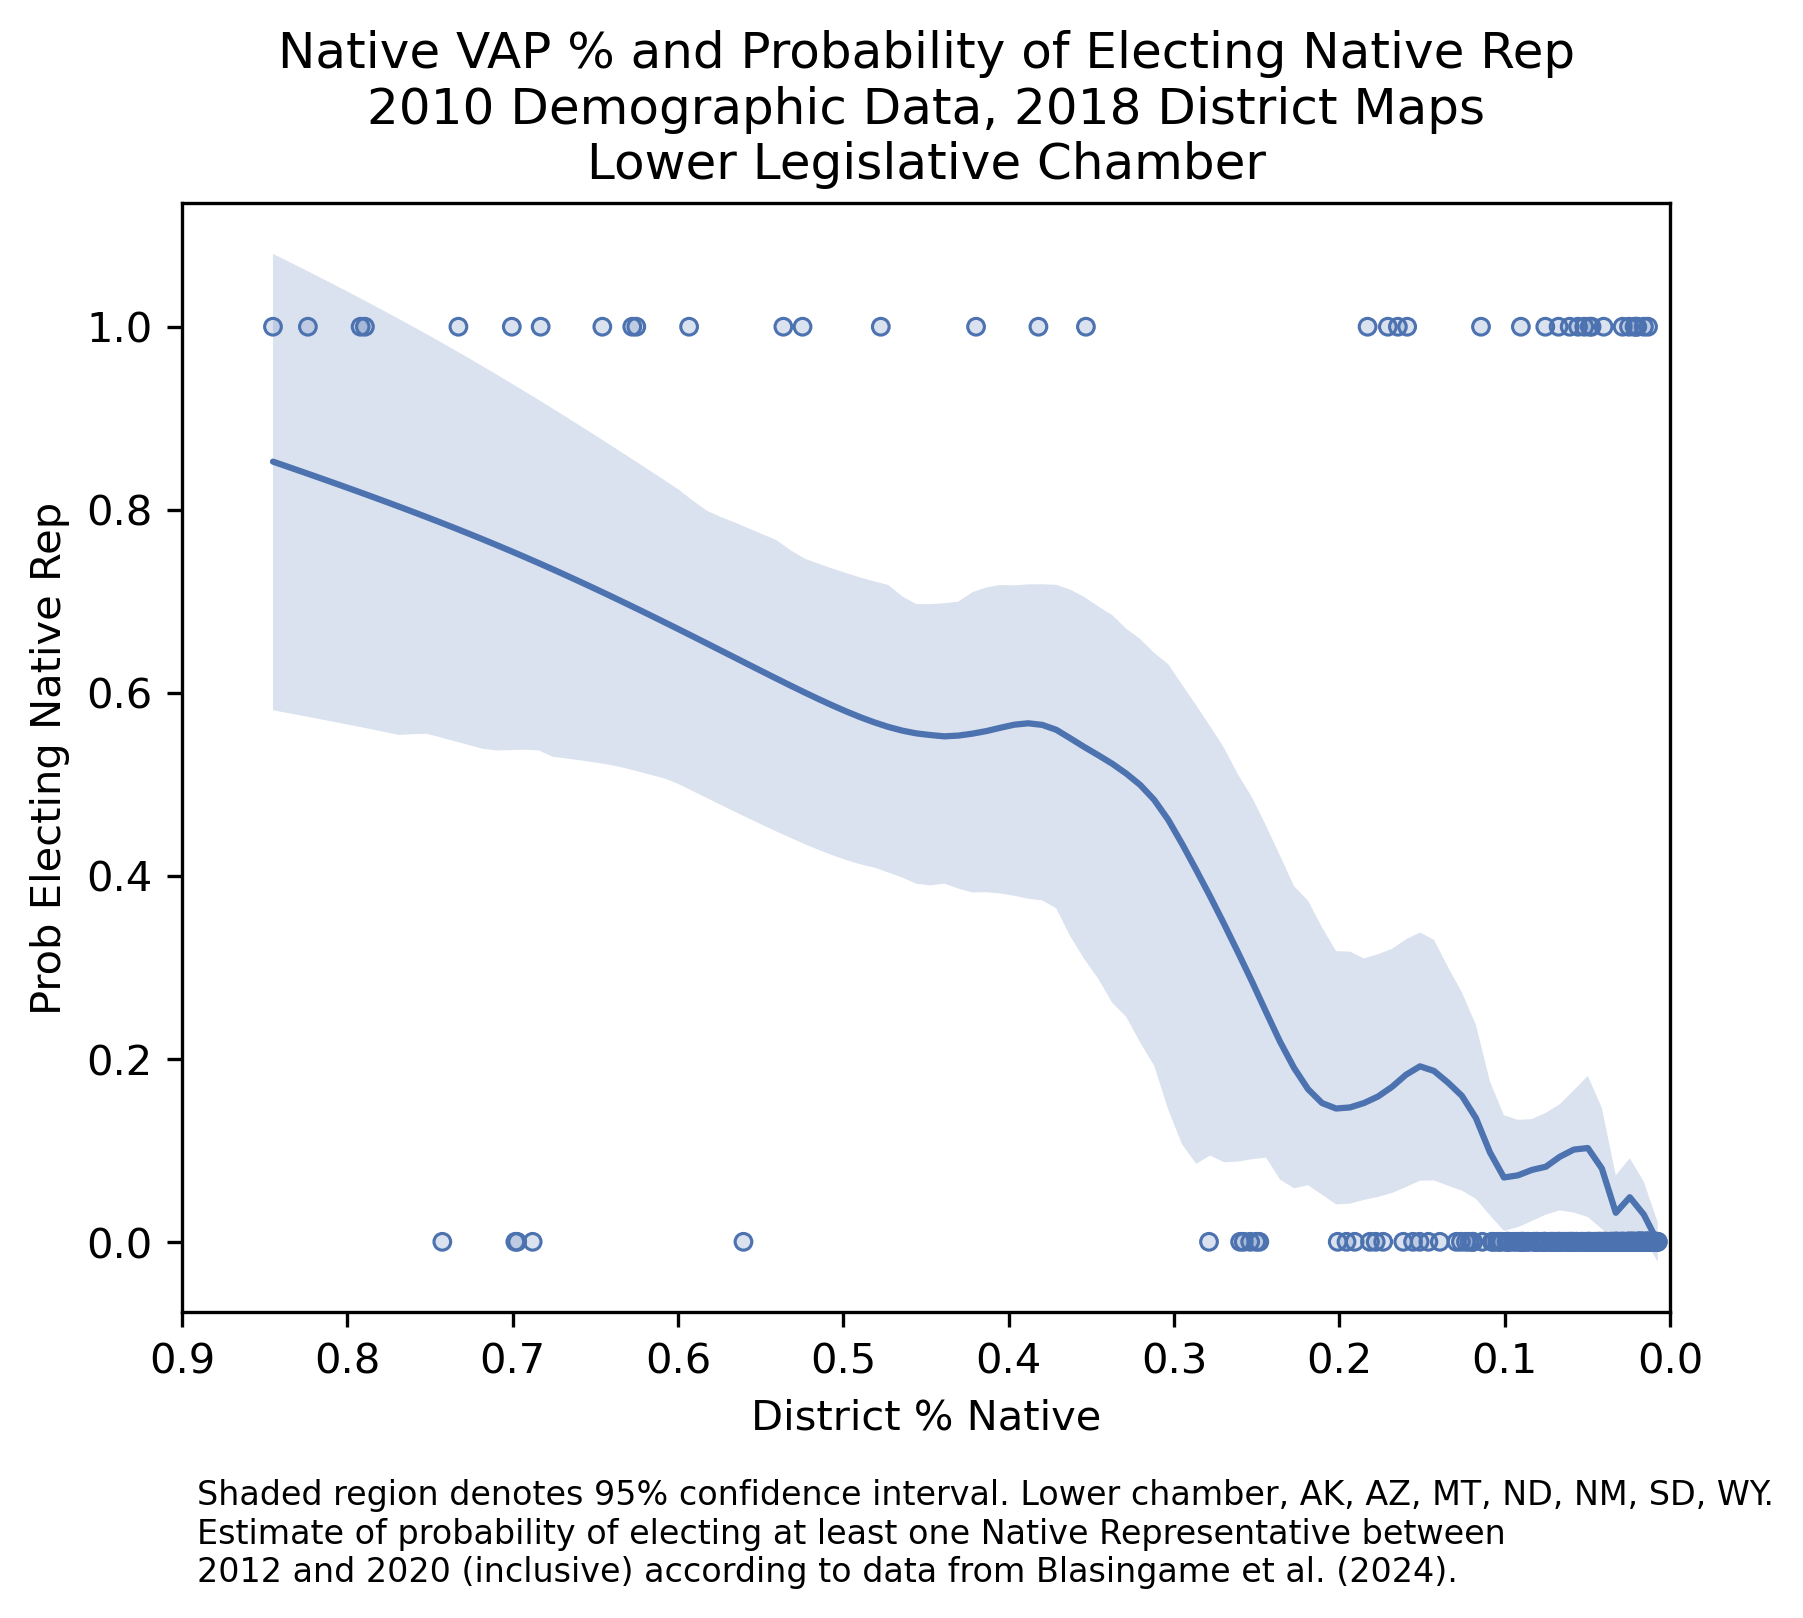
Lower Chamber — National #
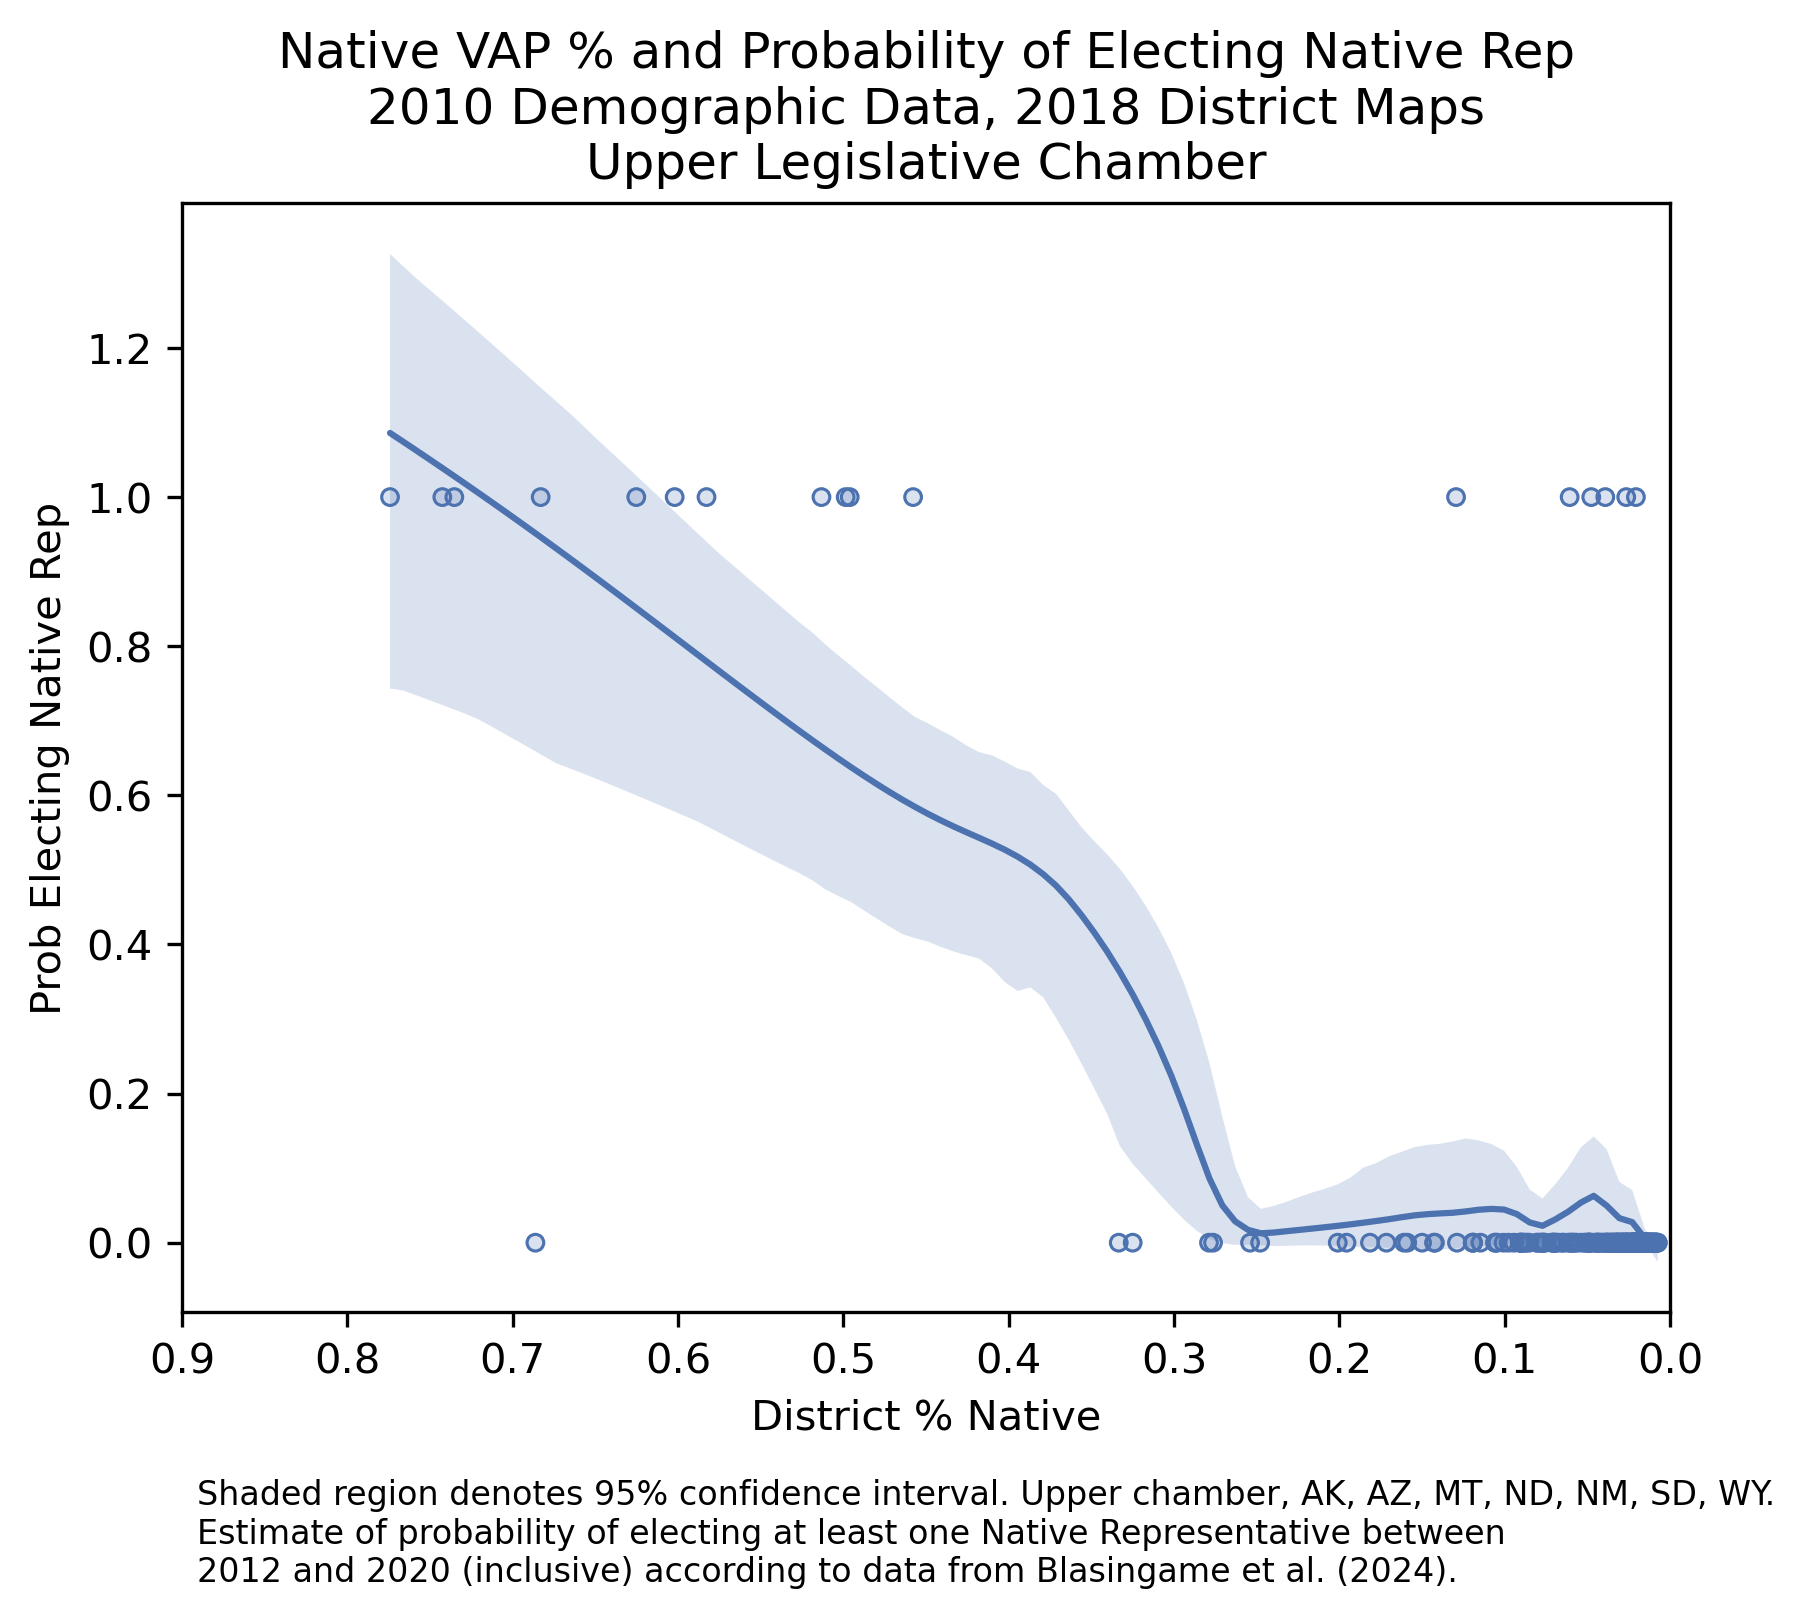
Upper Chamber — National #
All Chambers — By State #